INTRODUCTION
Ribosomal protein S15a (RPS15a) is a highly conserved ribo- somal protein, and some reports suggest that it is overex- pressed in several human cancers, including hepatic cancer, lung adenocarcinoma, and colorectal cancer.1-3 In addition, it
has been shown that RPS15a silencing inhibits cancer cell proliferation and enhances apoptosis.1-5 RPS15a has been im- plicated in the occurrence and development of liver cancer, and upregulation of RPS15a has been demonstrated to stimu- late hepatic cancer cell growth, colony formation in soft agar, and tumor formation in severe combined immunodeficient mice.6 In accordance with these findings, downregulation of RPS15a mRNA has been shown to inhibit human hepatic can- cer cell growth and to suppress cell cycle progression via G0/
G1 phase arrest in vitro.4 Furthermore, Chen, et al.3 reported that RPS15a overexpression promotes malignant transforma- tion in colorectal cancer through deregulation of the p53 sig- naling pathway. Some studies1,7 suggest that RPS15a could po- tentially be a new oncogene involved in lung carcinogenesis and thus a potential therapeutic target. However, until now, little is known about the role of the RPS15a gene in gastric can- cer. Therefore, in this study, we examined its expression in tu- mors and the corresponding normal gastric tissues of gastric
RPS15a Silencing Suppresses Cell Proliferation and Migration of Gastric Cancer
Ding Shi1 and Jinjin Liu2
1Department of Gastroenterology, Ningbo No. 2 Hospital, Ningbo;
2Department of Gastroenterology, Henan University of Chinese Medicine, Zhengzhou, China.
Purpose: Information on the possible role of the ribosomal protein S15a (RPS15a) in gastric cancer is scarce. The aim of this study was to evaluate the impact of RPS15a gene expression on the growth and cell cycle of gastric cancer cells in vitro and in vivo.
Materials and Methods: RPS15a mRNA expression was examined in cancer tissues and their corresponding adjacent normal tis- sues of 40 gastric adenocarcinoma patients. Next, RPS15a was knocked down using a lentivirus-mediated RNA interference (short hairpin RNA) system in the gastric cancer cell line BGC823. The effect of RPS15a knockdown was examined using CCK-8 assay, cell scratch test, colony formation assay, and flow cytometry. Finally, in nude mice, a tumorigenicity test was performed, and the tumor volume and weight were measured.
Results: RPS15a expression in tumor tissue was significantly greater than that in the adjacent normal tissue of gastric cancer pa- tients. After RPS15a silencing, the BGC823 cell proliferation rate decreased significantly; most cells were arrested in the G0/G1 phase, cell growth was inhibited, and the migration rate was decreased. Colony formation assay showed that the number and size of clones in the RPS15a-silenced cells were fewer and smaller, compared to control cells. The nude mouse tumorigenicity test showed that RPS15a silencing had an inhibitory effect on tumor volume and mice weight.
Conclusion: The present study found RPS15a expression to be higher in gastric tumors and its silencing in gastric cancer cells to inhibit the proliferation, growth, and migration thereof. Accordingly, RPS15a may be considered as a potential therapeutic target in gastric cancer.
Key Words: Gastric cancer, RPS15a, BGC823 cells, gene silencing
pISSN: 0513-5796 · eISSN: 1976-2437
Received: June 21, 2018 Revised: October 6, 2018 Accepted: October 12, 2018
Co-corresponding authors: Jinjin Liu, MM, Department of Gastroenterology, Henan University of Chinese Medicine, Zhengzhou 450000, Henan Province, China.
Tel: 86-057483871152, Fax: 86-057483871152, E-mail: [email protected] and Ding Shi, PhD, Department of Gastroenterology, Ningbo No. 2 Hospital, Ningbo 315010 Zhejiang Province, China.
Tel: 86-057487362216, Fax: 86-057487362216, E-mail: [email protected]
•The authors have no financial conflicts of interest.
© Copyright: Yonsei University College of Medicine 2018
This is an Open Access article distributed under the terms of the Creative Com- mons Attribution Non-Commercial License (https://creativecommons.org/licenses/
by-nc/4.0) which permits unrestricted non-commercial use, distribution, and repro- duction in any medium, provided the original work is properly cited.
Yonsei Med J 2018 Dec;59(10):1166-1173 https://doi.org/10.3349/ymj.2018.59.10.1166
cancer patients. Next, we applied a short hairpin RNA (shRNA) system to specifically knock down RPS15a expression in the human gastric cancer cell line BGC823 and evaluated the im- pact of RPS15a on gastric cancer cell growth and the cell cycle.
Finally, we performed a tumorigenicity test to examine the im- pact of RPS15a on tumor growth in nude mice in vivo.
MATERIALS AND METHODS
Patient tissues and cell lines
For this study, tumor samples were collected from 40 patients with gastric adenocarcinoma who had been admitted to the Department of Gastroenterology Surgery of the First People’s Hospital of Yuhang District, China and the Department of Gas- troenterology Surgery of Ningbo No. 2 Hospital, China between June 2016 and December 2017. This study was approved by the ethics committees of the First People’s Hospital of Yuhang District and Ningbo No. 2 Hospital. All participants provided written informed consent. Tumor tissues and their correspond- ing adjacent normal tissues (approximately 5 cm away from cancer tissue) were obtained during surgery and immediately stored at -70°C after freezing in liquid nitrogen. Adjacent normal tissues were used as matched adjacent non-neoplastic tissues.
In preliminary experiments, we found that RPS15a expres- sion was the highest in BGC823 cells, compared with other gas- tric cancer cells (Supplementary Fig. 1, only online). Therefore, we chose BGC823 cells as our research cell line. The gastric ad- enocarcinoma cell line BGC823 was purchased from the Shang- hai Cell Bank (Shanghai, China). BGC823 cells were cultured in Ham’s F-12 medium supplemented with 10% fetal calf serum and were maintained at 37°C under a 5% CO2 atmosphere.
Detection of RPS15a mRNA expression in gastric cancer and adjacent normal tissues, and tumor cell lines Total RNA was extracted using TRIzol reagent (Invitrogen, Carlsbad, CA, USA) from gastric cancer tissues, adjacent nor- mal tissues, and tumor cells. Gel electrophoresis and Genspec III (Hitachi Company, Tokyo, Japan) were used to determine the concentration of total RNA. Next, the 5× Prime Script RT Master Mix (TaKaRa, Kusatsu, Japan) was used to obtain the cDNA used for polymerase chain reaction (PCR). RPS15a gene primers were designed using Oligo 6.8 (Molecular Bio- logical Insights, Inc., Cascade, CO, USA), and β-actin was used as the reference gene (GenBank accession number: AK225414).
The PCR conditions were as follows: 40 s at 94°C, 35 s at 58°C, and 40 s at 72°C for 40 cycles. The relative gene copy number was calculated according to the 2-ΔΔCt method, and the data were analyzed using SPSS 16.0 software (SPSS, Inc., Chicago, IL, USA). The primer sequences are shown in Supplementary Table 1 (only online).
Detection of RPS15a protein in gastric cancer tissues, adjacent normal tissues, and tumor cell lines
For Western blot analysis, total proteins were extracted from gastric cancer cells and quantified using the bicinchoninic acid assay method. Next, proteins (20 μg) were loaded onto a 10%
sodium dodecyl sulfate-polyacrylamide electrophoresis gel.
The gel was run at 200 mA for 35 min and transferred to a poly- vinylidene difluoride membrane (PVDF, IPVH00010, Milli- pore, Billerica, MA, USA). The PVDF membrane was rinsed with phosphate-buffered saline containing Tween 20 (PBST) and incubated with the RPS15a antibody (Hangzhou United Biotechnology Co., Ltd., Hangzhou, China) at room tempera- ture for 1 h. Then, the membrane was blocked for about 1.5 h with 5% bovine serum albumin. Next, the membrane was rinsed three times with PBST and incubated with a horseradish per- oxidase-labeled secondary antibody (secondary antibody, Hangzhou United Biotechnology Co., Ltd.) for 1–2 h. The Su- perSignal chromogenic reagent kit (Biyuntian, Shanghai, Chi- na) and X-ray films were used for visualization (Chemidoc XRS+; Bio-Rad Laboratories, Inc., Hercules, CA, USA).
Construction of RPS15a siRNA and transduction into gastric adenocarcinoma cells
Two different siRNAs against the human RPS15a gene were de- signed to specifically knock down RPS15a expression. The siR- NA sequences were as follows: siRPS15a-1, 5'-GCA AAC GCC AGG TGC TTA TTA-3' and siRPS15a-2, 5'-GAT GAT GAA GCA TGG TTA CAT-3'. The control siRNA sequence was a random small fragment with the same length. For transfection, the siR- NA sequences or the random small fragment and 6 μL of Lipo- fectamine® 2000 (Invitrogen; Thermo Fisher Scientific, Waltham, CA, USA) were added to 200 μL of F12 medium. Following mixing and incubation at room temperature for 20 min, the mixture was added to BGC823 cells that had been plated and had reached 75% cell confluence. Next, the transfection effi- ciency was detected. Transfected BGC823 cells were divided into four groups: ck (normal cells), siNC (cells transfected with the noncoding sequence), siRPS15a-1, and siRPS15a-2 (cells transfected with either siRPS15a-1 or siRPS15a-2, respective- ly). After the treatment period, RNA and protein were extract- ed from the cells, and RPS15a expression was analyzed using reverse transcription (RT)-PCR and Western blot.
Construction of the RPS15A shRNA-containing lentivirus
The shRNA sequence was designed according to siRPS15a-2.
This sequence was cloned into the pCD316-ZsGreen-shRNA expressing vector. For lentiviral production, the recombinant plasmid and packaging plasmid were cotransfected into 293T cells. After 48 h, the viral supernatant was harvested. The three experimental groups were as follows: ck, BGC823 cells with- out plasmid; vector, BGC823 cells transfected with the empty plasmid; and shRPS15a, BGC823 cells transfected with the
shRPS15a plasmid.
Cell infection
BGC823 cells were seeded in six-well plates and transduced with the constructed lentiviruses (Vector, shRPS15a) at a mul- tiplicity of infection of 30. After infection for 48 h, the co-ex- pression of green fluorescent protein was observed by fluo- rescence microscopy, and the infection efficiency was detected.
Then, RNA and protein were extracted from the cells, and RP- S15a expression was analyzed using RT-PCR and Western blot.
Cell cycle
The cell cycle was assayed by a cell cycle staining kit (Hangzhou Multi Sciences Co., Ltd., Hangzhou, China), according to the manufacturer’s instructions. BGC823 cells (4×10⁵ cells/well) were added to different wells of a six-well plate, incubated for 48 h, and then harvested. After centrifugation, the pellets were washed with phosphate-buffered saline (PBS) and suspended in cell-based assay buffer. 1 mL of DNA Staining solution and 10 μL of permeabilization solution were added, and the sus- pension was vortexed for 5–10 s. Finally, the samples were in- cubated at room temperature for 30 min in the dark, and the cells were analyzed immediately by a C6 flow cytometer (BD Biosciences, San Jose, CA, USA).
CCK-8 cell proliferation assay
A CCK-8 (Beyotime Institute of Biotechnology, Shanghai, Chi- na) assay was used to evaluate the growth of the BGC823 cells according to the manufacturer’s protocol. BGC823 cells (4×10⁵ cells/well) were seeded into 96-well plates and cultured for 24 h. Next, cells were incubated with different concentrations of prucalopride (0, 0.1, 1, 10, 20, 50, 100 μM) and cultured for an additional 72 h. Next, 10 μL of CCK-8 solution was added into the wells, and the cells were incubated at 37°C for 1.5 h for CCK-8 detection. A microplate reader (Bio-Rad) was used to determine the absorbance (optical density, OD) of cells at 450 nm. The following experimental drug concentration (10 μM) was chosen from the series of the gradient concentration. Then, cells were incubated with prucalopride (10 μM) and vehicle (DMSO, 0.1% in culture media) for 24, 48, and 72 h. CCK-8 as- say was used to measure cells viability, and OD values were measured as described above.
Colony formation analysis
BGC823 cells (200 cells/well) were seeded in a six-well plate and cultured at 37°C under 5% CO2 for two weeks. Next, the su- pernatant was discarded, and the cells were washed two times with PBS. Then, 0.01% crystal violet (Sigma, St. Louis, MO, USA) was added to stain the cells. After incubation for 1 h, the cells were washed three times with PBS. Finally, the cells were pho- tographed (Olympus, Tokyo, Japan).
Cell scratch test
Six parallel lines were drawn with a marking pen on the back of the bottom of a 6-well plate. The logarithmic phase cells were digested with 0.25% Trypsin+0.02% EDTA and counted using Trypan blue. Next, 5×10⁵ cells/well were spread onto six-well plates, 10% fetal bovine serum medium was added, and the cells were incubated at 37°C under 5% CO2.
After the cells adhered to the surface of the well, a scratch was made perpendicular to the parallel line using a 200-µL pipette tip so as to separate the single cell layer from the middle to the two sides. Next, the medium was discarded, the cells were rinsed three times with PBS, and then serum-free medium was added. The cell migration in each group was observed and pho- tographed using a microscope under the three selected areas.
The cell migration in each group was analyzed using Image Pro Plus software (Media Cybernetics, Rockville, MD, USA).
Tumor formation test in nude mice
For the tumor formation test, 18 female BALB/c nude mice aged 4–6 weeks [provided by the Shanghai SLAC Co. Ltd.; Pro- duction license number: SCXK (Shanghai) 2012-0002, certifi- cate number: 0246106, SPF class, weight of each mouse was 16–20 g] were inoculated with BGC823 cells transfected with plasmids containing either the shRNA or NC sequence to es- tablish the subcutaneous tumor model. BALB/c nude mice were divided into three groups: ck (n=6), normal BCG823 cells were inoculated into each nude mouse; pCDH (n=6), noncod- ing sequence-transfected BCG823 cells were inoculated into each nude mouse; and RPS15a-shRNA (n=6), RPS15a-silenced cells were inoculated into each nude mouse. In brief, BGC823 cells in logarithmic growth phase were collected, and a single cell suspension was prepared by adjusting the cell concentra- tion to 1×10⁷/mL by centrifugation at 1000 rpm for 5 min. Then, a 0.1-mL suspension containing 6×10⁶ cells was inoculated into the right side of the neck of each nude mouse, and the in- jection site was pressed for 30 s.
At 7 days after cell inoculation, the nude mice were weighed, and the tumor diameter (a) and the short diameter (b) were measured using vernier calipers to calculate the tumor vol- ume (V) using the formula V (cm3)=1/2ab2=0.5ab2. The animal weight was calculated as overall weight - tumor volume (the tu- mor density is assumed as 1). The tumor volume inhibition rate was calculated as (1 - average tumor volume in test group/aver- age tumor volume in control group)×100%. At the end of the experiment, after weighing, the animals were sacrificed. The tumor was extracted rapidly from the animals, weighed, and divided into two parts of which one was preserved at -80°C for Western blot analysis and the other part was fixed using 4%
formaldehyde for pathological examination. The body weight, tumor growth, and survival curve were determined.
Statistical analysis
Bands from Western blot or quantitative PCR were quantified
using Quantity software (CFX Connect Real-Time System, Bio- Rad). Numerical data are presented as a mean±standard devi- ation. The difference between means was assessed with Stu- dent’s t-test. The multi group average was analyzed using CFX Manager 3.1 (Bio-Rad) statistical software. The homogeneity test of variance was first performed for the data. If the variance was homogeneous, single factor analysis of variance was used to compare differences among all groups. The mean compari- son was made between the multiple dose groups and one con- trol group by means of the one-to-one comparison method. The rank sum test was used to analyze the data of non-normal or heterogeneous variance. All statistical analyses were performed using SPSS 16.0 software (SPSS, Inc., Chicago, IL, USA). p<0.05 was considered to indicate a statistically significant result.
RESULTS
Expression of RPS15a mRNA in gastric cancer and adjacent normal tissues
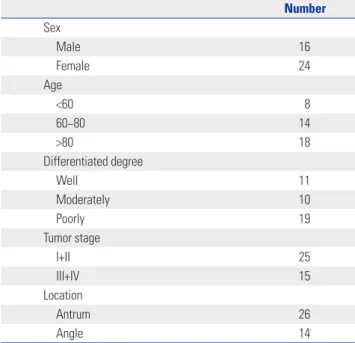
The clinicopathologic features of 40 patients with gastric cancer are shown in Table 1. Gel electrophoresis of total RNA showed that the 28S and 18S bands were of good integrity and quality.
The Gene Spec III test further confirmed that the A260/A280 values were between 1.9 and 2, and the results were consistent with the electrophoresis results. All of the indices were up to the requirement of reverse transcription. Quantitative PCR showed that the expression of RPS15a mRNA in gastric cancer tissues was significantly greater than that in the adjacent nor- mal tissues (Fig. 1). RPS15a mRNA expression levels in the mod- erately and poorly differentiated gastric cancers were signifi- cantly greater than those in well differentiated respectively
(*p<0.01) (Supplementary Fig. 2, only online). Of the 40 pa- tients, 27 were Helicobacter pylori-positive and 13 were negative.
There was no significant difference in the mRNA expression of RPS15a between H. pylori-positive and -negative gastric can- cer tissue (p>0.05) (Supplementary Fig. 3, only online).
Expression of RPS15a after silencing in transfected gastric cancer cells
The efficiency of RPS15a gene silencing was examined by PCR amplification of RPS15a mRNA from total RNA isolated from BGC823 cells. The results demonstrated that the expression of RPS15a in ck and siNC cells was greater than that in siRPS15a-1- (p<0.05) and siRPS15a-2-transfected cells (p<0.01), and a sta- tistically significant difference was observed between the siRNA- treated and control cells (Table 2). No difference was observed between ck and siNC cells (p>0.05). RPS15a fragments were almost undetectable in cells transfected with siRPS15a-2, which had better silencing performance than siRPS15a-1 (Fig. 2).
The Western blot analysis results showed that the expres- sion of RPS15a protein in the ck and siNC cells was greater than that in the BGC823 cells transfected with siRPS15a-1 (p<0.05) or siRPS15a-2 (p<0.01) (Table 2). RPS15a protein expression was the highest in the ck cells and the lowest in the BGC823 cells transfected with siRPS15a-2 (Fig. 3). There was a statisti- cal difference between the experimental group and the con- trol group. No statistical difference between the ck and siNC cells was observed (p>0.05). The colony formation assay ex- periments showed that colony growth of siRNA-treated cells
Table 1. Clinicopathologic Features
Number Sex
Male 16
Female 24
Age
<60 8
60–80 14
>80 18
Differentiated degree
Well 11
Moderately 10
Poorly 19
Tumor stage
I+II 25
III+IV 15
Location
Antrum 26
Angle 14
*
Fig. 1. Ribosomal protein S15a (RPS15a) expression in gastric cancer and normal tissue as detected by quantitative PCR. The relative expression levels of RPS15a were significantly greater in gastric cancer tissues compared with normal tissues (n=40, *p<0.05). M, mark; C, gastric cancer tissues, N: adjacent tissues. β-actin was used as a reference.
25
20
15
10
5
0 Normal Tumor
Fold change of mRNA
RPS15a
β-actin M C N C N C N C N C N C N C N C N
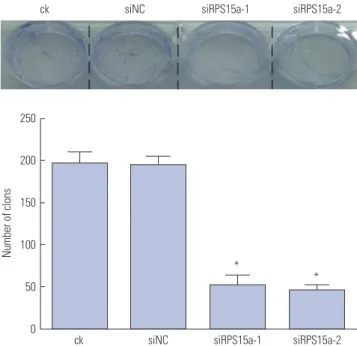
was slower, less colonies were formed, and clones were also smaller; while the control cells grew more colonies of larger size (Fig. 4).
Effects of RPS15a silencing on BGC823 cell growth After RPS15a silencing, the BGC823 cell proliferation rate was significantly less in cells transfected with siRPS15a-1- and siRP- S15a-2-containing siRNA, compared to ck normal cells and
siNC cells transfected with the negative control sequence (Fig. 5).
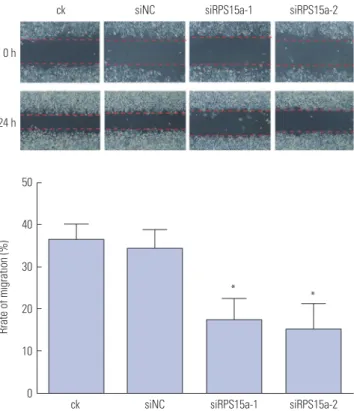
The cell cycle analysis showed that most of the cells were concentrated in the G0/G1 phase after the shRNA silencing and that cell growth was inhibited (Fig. 6). The migration rate of BGC823 cells was decreased significantly in the siRPS15a-1- and siRPS15a-2-transfected cells (*p<0.01) (Fig. 7).
Table 2. Detection of RPS15a Gene and Protein Expression by Reverse Transcription-PCR and Western Blot
Group ck siNC* siRPS15a-1† siRPS15a-2‡
Gene 0.71±0.11 0.69±0.09 0.37±0.05 0.20±0.06
Protein 4.11±0.15 3. 99±0.23 2.31±0.35 2.13±0.21
RPS15a, ribosomal protein S15a; ck, normal BGC823 cells; siNC, BGC823 cells transfected with the negative control sequence; siRPS15a-1 and siRPS15a-2, BGC823 cells transfected with siRPS15a-1- and siRPS15a-2-containing siRNA, respectively.
*p>0.05, †p<0.05, ‡p<0.01.
Fig. 2. Ribosomal protein S15a (RPS15a) expression in siRNA-transfected gastric cancer and control cells as detected by quantitative PCR. PCR analysis of RPS15a mRNA expression in BGC823 cells transfected with dif- ferent siRNAs and control cells showed that the RPS15a fragments were virtually not amplified in cells treated with siRPS15a-2, which was proven to be better than siRPS15a-1 in the silencing experiments (*p<0.01). ck, normal BGC823 cells; siNC, BGC823 cells transfected with the negative control sequence; siRPS15a-1 and siRPS15a-2, BGC823 cells transfected with siRPS15a-1- and siRPS15a-2-containing siRNA, respectively.
1.5
1.0
0.5
0.0 ck siNC siRPS15a-1 siRPS15a-2
*
*
Fold change of mRNA
Fig. 3. Ribosomal protein S15a (RPS15a) expression after RPS15a silencing in each group as detected by western blot analysis. Western blot analysis of RPS15a protein expression in BGC823 cells transfected with different siRNAs and control cells demonstrated that the highest protein expression was present in the wild-type BGC cells and the lowest in the siRPS15a- 2-transfected cells. ck, normal BGC823 cells; siNC, BGC823 cells transfect- ed with the negative control sequence; siRPS15a-1 and siRPS15a-2, BGC823 cells transfected with siRPS15a-1- and siRPS15a-2-containing siRNA, respectively.
ck siNC siRPS15a-1 siRPS15a-2
RPS15a
GAPDH
Fig. 4. Colony formation experiments. After ribosomal protein S15a (RP- S15a) interference, BGC823 cells were grown for 2 weeks, and cell colo- nies were compared. ck, normal BGC823 cells; siNC, BGC823 cells trans- fected with the negative control sequence; siRPS15a-1 and siRPS15a-2, BGC823 cells transfected with siRPS15a-1- and siRPS15a-2-containing siRNA, respectively (*p<0.01).
250
200
150
100
50
0 ck
ck
siNC siNC
siRPS15a-2 siRPS15a-2
siRPS15a-1 siRPS15a-1
* *
Number of clons
Fig. 5. Cell proliferation assay. The proliferation rate of BGC823 cells was decreased significantly in siRPS15a-1- and siRPS15a-2-transfected cells (*p<0.05, †p<0.01). RPS15a, ribosomal protein S15a; ck, normal BGC823 cells;
siNC, BGC823 cells transfected with the negative control sequence; siRP- S15a-1 and siRPS15a-2, BGC823 cells transfected with siRPS15a-1- and siRPS15a-2-containing siRNA, respectively.
0.6
0.4
0.2
0.0 1 day 2 days
cksiNC siRPS15a-1 siRPS15a-2
3 days
† †
* †
Rate of proliferation
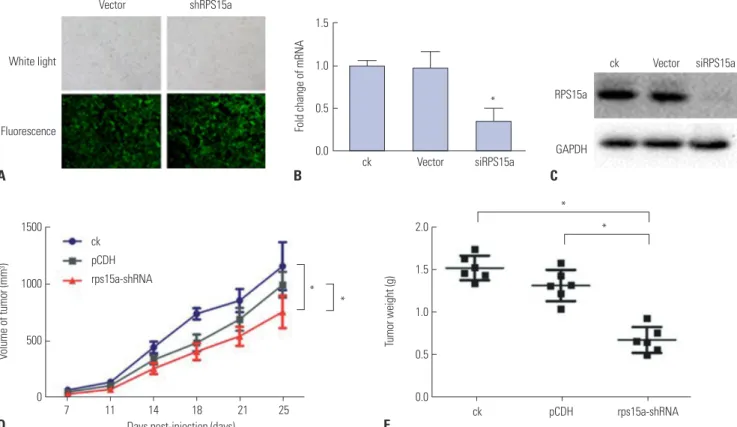
Expression of transfected plasmid in gastric cancer cells Green fluorescent protein was used as an indicator protein for cells transfected with plasmid. The fluorescence results showed that tumor cells were successfully transfected by the plasmid (Fig. 8A). Quantitative PCR analysis of RPS15a mRNA expres- sion in BGC823 cells transfected with shRNA showed that it was decreased significantly in siRPS15a-transfected cells, com- pared to control cells (Fig. 8B). Western blot analysis of RPS15a protein expression in BGC823 cells transfected with shRNA and control cells showed that the highest protein expression was present in the wild-type BGC cells (Fig. 8C).
Effects of RPS15a silencing on tumor growth in nude mice The BALB/c tumor model of nude mice was successfully estab- lished by inoculating RPS15a gene-knockdown BGC823 cells.
The results showed that RPS15a silencing had an inhibitory effect on the tumor volume and weight of nude mice (Fig. 8D and E), and the difference was found to be statistically signifi- cant. The tumor volume and weight of nude mice in the rps15a- shRNA group were significantly less than those of the ck and pCDH groups (*p<0.01).
DISCUSSION
Gastric cancer is one of the most common digestive tract can- cers in China and has the lowest survival rate globally, with an estimated 952000 new cases and 723000 deaths annually.8 Al- though important advances in surgical techniques and adju- vant chemotherapies have improved patient outcomes, the 5-year overall survival of gastric cancer is only approximately
10–30%.9,10 Knowledge regarding its molecular mechanisms remains poorly understood. At present, only a few molecules have been found to play pivotal roles in gastric cancer cell pro- liferation and survival.11-13 Therefore, the identification of novel therapeutic targets is of central importance. Our results showed that expression of the RPS15a gene in gastric cancer tissues was significantly greater than that in adjacent normal tissues, sug- gesting that RPS15a might be involved in the proliferation of gastric cancer cells. To confirm this hypothesis, a lentivirus- mediated shRNA system was applied to inhibit RPS15a mRNA expression in human gastric adenocarcinoma. The results dem- onstrated that the expression of RPS15a in the RPS15a silenc- ing group was apparently lower than that in the control group.
The RPS15a fragments were virtually not amplified in cells treat- ed with shRPS15a-2, which was better than shRPS15a-1. The efficiency of RPS15a silencing was also confirmed by RT-PCR and Western blotting assays.
To determine the impact of RPS15A knockdown on the gas- tric cancer cell growth in vitro, a colony formation assay was carried out. The results showed that the number and size of clones in the RPS15a silencing group were fewer and smaller than those in the control group. Cell cycle analysis showed that most of the cells were concentrated in the G0/G1 phase in re- sponse to RPS15a silencing and that cell growth was inhibited.
The migration rate of BGC823 cells decreased significantly af- Fig. 7. Cell migration assay. The migration rate of BGC823 cells was de- creased significantly in siRPS15a-1- and siRPS15a-2-transfected cells (*p<
0.01). RPS15a, ribosomal protein S15a; ck, normal BGC823 cells; siNC, BGC823 cells transfected with the negative control sequence; siRPS15a-1 and siRPS15a-2, BGC823 cells transfected with siRPS15a-1- and siRPS15a- 2-containing siRNA, respectively.
50
40
30
20
10
0 ck
ck
0 h
24 h
siNC siNC
siRPS15a-2 siRPS15a-2
siRPS15a-1 siRPS15a-1
* *
Rrate of migration (%)
Fig. 6. Cell cycle analysis. The cell cycle distribution after ribosomal protein S15a (RPS15a) interference for 48 h was determined (*p<0.05). ck, normal BGC823 cells; siNC, BGC823 cells transfected with the negative control se- quence; siRPS15a-1 and siRPS15a-2, BGC823 cells transfected with siRP- S15a-1- and siRPS15a-2-containing siRNA, respectively.
100 80 60 40 20
0 ck
ck
siNC G1 S G2/M
siNC
siRPS15a-2 siRPS15a-2
siRPS15a-1 siRPS15a-1
Cell cycle
Percentage of cells (%)
* *
* *
ter RPS15a silencing. The tumorigenicity test in nude mice showed that RPS15a silencing had a certain inhibitory effect on the tumor volume and weight of the nude mice. The changes of tumor volume and weight in the nude mice demonstrated that the tumor growth in nude mice was inhibited to some extent.
Our results showed that shRNA could effectively reduce the expression of RPS15a and inhibit the proliferation of gastric cancer cells by suppressing RPS15a expression. Nevertheless, the mechanism of the effect of RPS15a expression on the pro- liferation of cancer cells is not clear. GeneChip analysis has sug- gested that RPS15a depletion might lead to deregulation of the p53 signaling pathway, which might contribute to cell cycle arrest at G0/G1 and counteract the pro-apoptotic effect of p53 in colorectal cancer.3 Similar results also have been seen in lung cancer studies, in which RPS15a might serve as an upstream modulator of the p53 signaling pathway.1 RPS15a knockdown also has been shown to activate the mitochondrial pathway of apoptosis in human glioblastoma to induce glioblastoma cell apoptosis,14 leading to a p-Akt level decrease and cell cycle ar- rest at the G0/G1 phase in glioblastoma cells.15 To the best of our knowledge, however, it is not known how RPS15a induces the proliferation of gastric cancer cells. Therefore, the identifi- cation of the downstream target of RPS15a is a focal point of
our future research, which will facilitate elucidation of the mechanisms underlying the effects of RPS15A on gastric cancer.
Because our animal sample size was limited, the statistical analysis of the animal experimental results might have certain limitations. Moreover, the signaling pathway of RPS15a in gas- tric cancer was not investigated in this study. Further research is needed.
In conclusion, the expression of RPS15a in gastric cancer tissues was found to be significantly greater than that in adja- cent normal tissues. RPS15a silencing could effectively inhibit the proliferation, growth, and cell migration of gastric cancer cells. Thus, RPS15a might be considered as a potential thera- peutic target for gastric cancer.
ORCID
Ding Shi https://orcid.org/0000-0002-3310-7854 Jinjin Liu https://orcid.org/0000-0002-6023-4517
REFERENCES
1. Zhang Y, Zhang G, Li X, Li B, Zhang X. The effect of ribosomal protein S15a in lung adenocarcinoma. PeerJ 2016;4:e1792.
White light
Fluorescence
Vector shRPS15a
1.5
1.0
0.5
0.0 ck
ck
ck
Vector
pCDH
Vector
siRPS15a
rps15a-shRNA
siRPS15a RPS15a
GAPDH
*
*
*
* *
Fold change of mRNA
A
D E
B C
Fig. 8. Cell transfection efficiency and the effect of knocking down ribosomal protein S15a (RPS15a) on tumor growth in nude mice. (A) The fluorescence analysis shows that tumor cells were successfully transfected with the shRNA (magnification: ×100). (B) Quantitative PCR analysis of RPS15a mRNA ex- pression in BGC823 cells transfected with shRNA and control cells (*p<0.01). (C) Western blot analysis of RPS15a protein expression in BGC823 cells trans- fected with shRNA and control cells demonstrated that the highest protein expression was present in the wild-type BGC cells. (D) Tumor growth curve (*p<0.01). (E) Tumor weight (*p<0.01). vector, BGC823 cells transfected with the empty plasmid; ck, normal BGC823 cells; shRPS15a, BGC823 cells transfect- ed with the shRPS15a plasmid; pCDH, noncoding sequence-transfected BCG823 cells; rps15a-shRNA, RPS15a knock-down group.
1500
1000
500
0
2.0
1.5
1.0
0.5
7 11 14 18 21 25 0.0 ck
pCDH rps15a-shRNA
Days post-injection (days)
Volume of tumor (mm3) Tumor weight (g)
2. Li G, Zhang L, Liu J, Xiao T, Liu G, Wang J, et al. shRNA-mediated RPS15A silencing inhibits U937 acute myeloid leukemia cell pro- liferation and enhances apoptosis. Mol Med Rep 2016;13:4400-6.
3. Chen J, Wei Y, Feng Q, Ren L, He G, Chang W, et al. Ribosomal protein S15A promotes malignant transformation and predicts poor outcome in colorectal cancer through misregulation of p53 signaling pathway. Int J Oncol 2016;48:1628-38.
4. Xu M, Wang Y, Chen L, Pan B, Chen F, Fang Y, et al. Down-regula- tion of ribosomal protein S15A mRNA with a short hairpin RNA inhibits human hepatic cancer cell growth in vitro. Gene 2014;
536:84-9.
5. Zhang C, Zhang T, Song E, Himaya SW, Chen X, Zheng L. Ribo- somal protein S15A augments human osteosarcoma cell prolifer- ation in vitro. Cancer Biother Radiopharm 2014;29:451-6.
6. Lian Z, Liu J, Li L, Li X, Tufan NL, Wu MC, et al. Human S15a ex- pression is upregulated by hepatitis B virus X protein. Mol Carcinog 2004;40:34-46.
7. Zhao X, Shen L, Feng Y, Yu H, Wu X, Chang J, et al. Decreased ex- pression of RPS15A suppresses proliferation of lung cancer cells.
Tumour Biol 2015;36:6733-40.
8. Ferlay J, Soerjomataram I, Dikshit R, Eser S, Mathers C, Rebelo M, et al. Cancer incidence and mortality worldwide: sources, methods and major patterns in GLOBOCAN 2012. Int J Cancer 2015;136:
E359-86.
9. Akhondi-Meybodi M, Ghane M, Akhondi-Meybodi S, Dashti G.
Five-year survival rate for gastric cancer in Yazd Province, Central Iran, from 2001 to 2008. Middle East J Dig Dis 2017;9:39-48.
10. Qiao YF, Chen CG, Yue J, Ma MQ, Ma Z, Yu ZT. Prognostic signifi- cance of preoperative and postoperative CK19 and CEA mRNA levels in peripheral blood of patients with gastric cardia cancer.
World J Gastroenterol 2017;23:1424-33.
11. Baniak N, Senger JL, Ahmed S, Kanthan SC, Kanthan R. Gastric biomarkers: a global review. World J Surg Oncol 2016;14:212.
12. Laza˘r DC, Ta˘ban S, Cornianu M, Faur A, Goldis¸ A. New advances in targeted gastric cancer treatment. World J Gastroenterol 2016;
22:6776-99.
13. Jomrich G, Schoppmann SF. Targeted therapy in gastric cancer.
Eur Surg 2016;48:278-84.
14. Zhang C, Fu J, Xue F, Ryu B, Zhang T, Zhang S, et al. Knockdown of ribosomal protein S15A induces human glioblastoma cell apop- tosis. World J Surg Oncol 2016;14:129.
15. Yao Y, Liu Y, Lv X, Dong B, Wang F, Li J, et al. Down-regulation of ribosomal protein S15A inhibits proliferation of human glioblasto- ma cells in vivo and in vitro via AKT pathway. Tumour Biol 2016;
37:4979-90.