D I A B E T E S & M E T A B O L I S M J O U R N A L
This is an Open Access article distributed under the terms of the Creative Commons Attribution Non-Commercial License (http://creativecommons.org/licenses/by-nc/4.0/) which permits unrestricted non-commercial use, distribution, and reproduction in any medium, provided the original work is properly cited.
The Effectiveness of Green Tea or Green Tea Extract on Insulin Resistance and Glycemic Control in Type 2
Diabetes Mellitus: A Meta-Analysis
Jinyue Yu1, Peige Song2, Rachel Perry3, Chris Penfold3, Ashley R. Cooper3,4
1Division of Medicine, School of life and Medical Science, University College London, London,
2Centre for Population Health Sciences, University of Edinburgh, Edinburgh,
3NIHR Bristol Biomedical Research Centre, Nutrition Theme, University of Bristol, Bristol,
4Centre for Exercise, Nutrition and Health Sciences, School for Policy Studies, University of Bristol, Bristol, UK
Green tea or green tea extract (GT/GTE) has been demonstrated to reduce insulin resistance and improve glycemic control. How- ever, evidence for this health beneficial effect is inconsistent. This systematic review evaluated the effect of GT/GTE on insulin re- sistance and glycemic control in people with pre-diabetes/type 2 diabetes mellitus (T2DM). Ovid MEDLINE, Embase, AMED, Web of Science, and the Cochrane Library were searched up to April 2017 for randomised controlled trials of participants with pre-diabetes or T2DM, where the intervention was GT/GTE. Meta-analysis was performed to assess the standardised mean dif- ference (SMD) in biomarkers of insulin resistance and glycemic control between GT/GTE and placebo groups. Six studies (n=382) were pooled into random-effects meta-analysis. Overall, no differences were found between GT/GTE and the placebo for glycosylated hemoglobin (HbA1c: SMD, –0.32; 95% confidence interval [CI], –0.86 to 0.23), homeostatic model assessment for insulin resistance (HOMA-IR: SMD, 0.10; 95% CI, –0.17 to 0.38), fasting insulin (SMD, –0.25; 95% CI, –0.64 to 0.15), and fasting glucose (SMD, –0.10; 95% CI, –0.50 to 0.30). No evidence support the consumption of GT/GTE could reduce the levels of HbA1c, HOMA-IR, fasting insulin, or fasting glucose in people with pre-diabetes/T2DM. However, the studies included were small and of varying quality.
Keywords: Diabetes mellitus, type 2; Glycemic control; Green tea; Insulin resistance; Meta-analysis
Corresponding author: Ashley R. Cooper https://orcid.org/0000-0001-8644-3870
Centre for Exercise, Nutrition and Health Sciences, School for Policy Studies, University of Bristol, Bristol, UK
INTRODUCTION
Accounting for 90% of cases of diabetes, type 2 diabetes melli- tus (T2DM) is a chronic metabolic disorder that is character- ized by insulin resistance and high blood glucose levels (hyper- glycemia) [1,2]. The number of cases of T2DM has almost quadrupled since 1980 and it has been become a major global health challenge [3]. The chronic hyperglycemia of T2DM is associated with long-term complications, including the dam- age, dysfunction, and failure of heart, kidneys, blood vessels, and other organs [4]. Pre-diabetes can precede T2DM by 10 to
20 years [2,5,6], and research suggests that T2DM could be largely preventable through dietary and lifestyle changes [7,8].
Tea is the second most commonly consumed beverage in the world aside from water [9]. In comparison to black tea and oolong tea, green tea (GT) contains greater quantities of cate- chins, which are strong antioxidants in vitro and in vivo. The most abundant catechin found in GT is epigallocatechin gal- late (EGCG), which is thought to have many health benefits including a role in body weight control and diabetes preven- tion [10]. Experimental animal studies have shown that green tea extract (GTE) can increase insulin sensitivity and lower https://doi.org/10.4093/dmj.2017.41.4.251
pISSN 2233-6079 · eISSN 2233-6087
blood glucose levels in diabetic (db/db) mice [11,12], whilst in humans, epidemiological studies suggest that long-term con- sumption of GT may be associated with a reduction of the in- cidence of diabetes [13,14]. A number of randomized con- trolled trials (RCTs) have reported that daily consumption of GTE may enhance oral glucose tolerance in healthy people as well as reduce fasting plasma glucose and glycosylated hemo- globin (HbA1c) levels in people at risk of diabetes [15-19].
Therefore, GT or GTE may have a role to play in reducing in- sulin resistance and improving glycemic control in people with T2DM.
However, systematic reviews and meta-analyses investigat- ing the relationship between GT consumption and insulin re- sistance and glycemic control have reported mixed findings.
Whilst one meta-analysis has concluded that GT consumption is effective in decreasing fasting glucose and glycemic control (HbA1c concentration) in both healthy subjects and patients with obesity or metabolic syndrome [20]. Wang et al. [21]
found no effect of GT consumption on fasting glucose, insulin, glycemic control or insulin resistance in participants both with, and at risk of, T2DM. In order to clarify the potential of GT in improving metabolic health in people with T2DM, fur- ther evaluation of the evidence for this health beneficial effect of GT on people with a clinical diagnosis of T2DM or pre-dia- betes are needed. The objectives of this study are thus: (1) to collate and evaluate the evidence for the effect of GT or GTE on insulin resistance and glycemic control in people with pre- diabetes or T2DM; (2) conduct a meta-analysis to assess the standardised mean difference (SMD) in biomarkers of insulin resistance and glycemic control between GT/GTE and placebo group.
METHODS
Search strategy
The following electronic databases were searched from their inception upto April 2017: Ovid MEDLINE (1946 to present), Ovid Embase (1974 to April 2017), AMED (1985 to April 2017), the Web of Science (Core Collection), The Cochrane Li- brary (2017). Search terms were: ‘green tea,’ ‘GTE,’ ‘EGCG,’
‘epigallocatechin,’ ‘epigallocatechin,’ ‘epicatechin,’ ‘random,’
‘RCT,’ ‘insulin resistance,’ ‘glycemic control,’ ‘diabetes,’ and
‘T2DM’ (Appendix 1 for electronic search strategy). The refer- ence list from all selected articles were hand-searched for fur- ther relevant studies. The first 20 pages of Google Scholar were
hand-searched for additional studies.
Selection criteria
Criteria for considering studies for this review were: (1) ran- domised controlled trials; (2) participants were people with pre-diabetes (fasting blood glucose 110 to 125 mg/dL [6.1 to 6.9 mM/L]) or T2DM; (3) the interventions were GT bags, GTEs or aqueous beverages where the chemical composition was provided; and (4) comparable measures for insulin resis- tance and glycemic control were provided. In addition, studies that used a cross-over design were only included if the results of the period before the cross-over were presented separately, in which data from the first phase were analysed.
Excluded studies
Studies were excluded if they were: (1) animal trials; (2) obser- vational studies; (3) review articles; (4) the experimental bever- age contains other kinds of tea in addition to GT; (5) the prepa- ration of GT contained ingredients in addition to GT or its nat- ural constituents of catechins and caffeine; (6) the intervention or treatment included a combination of GT and physical activ- ity; and (7) the participants’ clinical state was not specified.
Data extraction and management
Data were extracted independently by two reviewers (J.Y. and A.R.C.) and confirmed by a third reviewer (P.S.) using a form adapted from Cochrane Data Extraction Form for Interven- tion Review. Specific information, including the study design, the characteristics of participants, and study outcomes, were extracted and recorded. A summary of the characteristic s of the studies and the results are presented in Table 1. Any dis- crepancies were resolved through discussion between the re- viewers.
All extracted data were entered into the RevMan 5.3 (Co- chrane, London, UK) for further analysis.
Methodological quality and risk of bias assessment
Assessment of the reporting quality of the included studies was based on the CONSORT (CONsolidated Standards of Report- ing Trials) 2010 checklist [22]. Studies were categorized as (1) high quality, with more than 75% compliance to the checklist;
(2) moderate quality, with 50% to 75% compliance to the checklist; (3) low quality, with less than 50% compliance to the checklist; and (4) very low quality, with no more than 30%
compliance to the checklist.
The risk of bias of each included study was assessed under the criteria in the ‘risk of bias assessment tool’ [23]. For each entry, the risk of bias was assessed as ‘low risk,’ ‘high risk,’ or
‘unclear risk.’ The assessment process was conducted by J.Y.
and A.R.C. independently. A meeting was organized to discuss any disagreements.
Data analysis
The SMD was calculated based on the standard equation to
combine trials which measured the same outcome using dif- ferent methods [23]. The pooled estimates of SMD were calcu- lated using a random-effects model with 95% confidence in- terval (CI) and inverse variance weights. The statistical hetero- geneity was examined and measured using the I² statistic, and subgroup analysis was considered when two or more trials contributed data. The pre-specified subgroup analysis was for decaffeinated GTE versus GT beverage/extract. Dealing with the missing data was based on the technique given by Co- Table 1. Characteristics of the included studies
Study Design Participant Age, yr Intervention Control Treatment
duration Quality of reportinga Fukino et al.
(2008) [16]
Japan
Crossover T2DM and pre-diabetes patients
(n=60)
32–73 GTE beverage (456 mg
catechins; 102 caffeine) Water 8 weeks Moderate to high
Mirzaei et al.
(2009) [27]
Iran
Parallel T2DM patients
(n=72) 54.56±11.23 GTE capsule (240 mg polyphenols; 150 mg caffeine)
Placebo (cellulose cap-
sules) 8 weeks Low
Nagao et al.
(2009) [30]
Japan
Parallel T2DM patients
(n=50) 64.9±1.6
62.8±2.2 GTE beverage (528.8 mg catechins; 75 mg caf- feine)
GTE beverage (96.3 mg catechins; 72.3 mg caffeine)
12 weeks Moderate to high Huyen et al.
(2010) [24]
Vietnam
Parallel T2DM patients
(n=24) 63.5±6.5
57.2±8.2 Gynostemma pentaphyl- lum tea 6 g/day (3 g/
packet, twice a day)
GT 6 g/day (3 g/packet,
twice a day) 12 weeks High
Hsu et al.
(2011) [17]
China
Parallel T2DM patients
(n=68) 20-65 DGTE capsule (856 mg
EGCG) Placebo (cellulose cap-
sules) 16 weeks High
Huyen et al.
(2013) [25]
Vietnam
Crossover T2DM patients
(n=16) 58.8±5.9
58.1±6.6 Gynostemma pentaphyl- lum tea 6 g/day (3 g/
packet, twice a day)
GT 6 g/day (3 g/packet,
twice a day) 8 weeks Moderate to high Mousavi et al.
(2013) [28]
Iran
Parallel T2DM patients
(n=63) 35–65 GT (4 cups/day); GT (2
cups/day) Water (no tea drinks) 8 weeks Moderate to high
Lasaite et al.
(2014) [26]
Lithuanian
Parallel T2DM patients
(n=56) 37–78 GTE capsules (200 mg
polyphenols) Placebo (cellulose cap-
sules) 18 months Low
Liu et al. (2014)
[19] China Parallel T2DM patients
(n=77) 55.0±6.6
53.5±7.0 DGTE capsule (856.8 mg
EGCG) Placebo (cellulose cap-
sules) 16 weeks High
Mozaffari- Khosravi et al.
(2014) [29]
Iran
Parallel T2DM patients
(n=94) 52.2±6.7
52.1±6.0 GT bag (3 g/day) Sour tea bag (3 g/day) 4 weeks High
Ryu et al.
(2006) [31]
Korea
Crossover T2DM patients
(n=55) 53.9±7.7 GTE beverage (9 g GT) Water 4 weeks Very low
Values are presented as range or mean±standard deviation.
T2DM, type 2 diabetes mellitus; GTE, green tea extract; GT, green tea; DGTE, decaffeinated green tea extract; EGCG, epigallocatechin gallate.
aAssessed by the CONSORT (CONsolidated Standards of Reporting Trials) checklist for randomized controlled trials.
chrane handbook with the following principles [23]: (1) ob- taining the missing data from the other available data provided in the trial; (2) substituting the missing data with replacement values; and (3) analysing only the available data.
Ethical approval
The study was approved by the Human Research Ethics Com- mittee of the Centre for Exercise, Nutrition and Health Scienc- es, University of Bristol (Ethics Approval Number: 013-15).
RESULTS
Results of the search
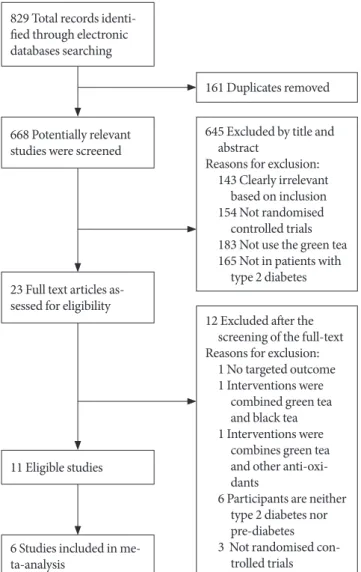
A description of the selection process is outlined in Fig. 1 in
the form of the PRISMA (Preferred Reporting Items for Sys- tematic Reviews and Meta-Analyses) flowchart (Appendix 1, search strategy MEDLINE). In total, 829 references were iden- tified from the research of which eleven of the 23 full-text stud- ies that were examined were included in this review [16,17,19, 24-31]. The characteristics of the included studies are provided in Tables 1 and 2. The 12 excluded studies [32-43] with the rea- son for exclusion were recorded in Table 3.
Trial characteristics
Trial characteristics for all the included studies are illustrated in Table 1. Participants of 10 studies were T2DM patients (n=635) between the age of 20 to 78 years [17,19,24-31] while one study enrolled the patients with T2DM and pre-diabetes [16]. Additionally, 10 of the studies were conducted in Asian countries, including China [17,19], Japan [16,30], Iran [27-29], Korea [31], and Vietnam [24,25], and one study was conducted in Lithuania [26]. The type of the GT or GTE used in the 11 studies included GTE beverage [16,30,31], four of the studies used GT bags [24,25,28,29], two studies used GTE capsules [26,27], and two studies used decaffeinated GTE capsules [17, 19]. As the most common test for glucose control, the HbA1c (%) was measured in seven studies [16,17,19,24,26,27,30]
while the fasting blood glucose (FG) was been measured in 10 studies [16,17,19,24,25,27-29,30,31]. Eight studies provided data for the change of fasting insulin (FI) [16,17,19,24,25,27, 30,31] and six studies measured the homeostatic model assess- ment for insulin resistance (HOMA-IR) [16,17,19,24,29,31].
Quality of reporting
Overall, four studies were judged as being of high reporting quality [17,19,24,29], four studies were of moderate to high quality [16,25,28,30], and two were of low quality [26,27]. One of the study was of very low quality [31], in which only 30% of items met the assessment criteria. Thus, this study was exclud- ed from further data analysis.
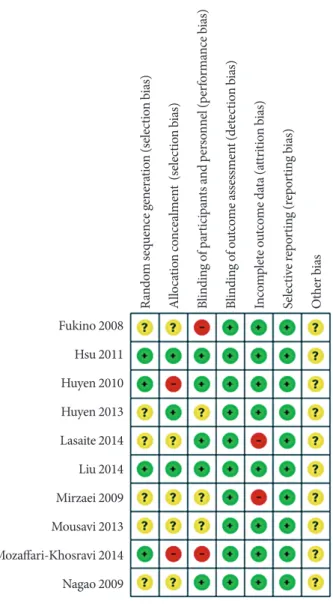
For the risk of bias assessment (Fig. 2), the majority of stud- ies were rated as low risk of bias on most assessed items. Most of the information from the studies was categorized as having an unclear bias for key elements of randomization. Two studies [16,29] were classified as high risk of performance bias without blinding. Two studies were judged to be at high risk of bias for the allocation concealment, in which the participants were matched by gender through the allocation process [24,29].
High attrition bias was found in two studies [26,27].
829 Total records identi- fied through electronic databases searching
668 Potentially relevant studies were screened
23 Full text articles as- sessed for eligibility
6 Studies included in me- ta-analysis
11 Eligible studies
161 Duplicates removed
645 Excluded by title and abstract
Reasons for exclusion:
143 Clearly irrelevant based on inclusion 154 Not randomised
controlled trials 183 Not use the green tea 165 Not in patients with
type 2 diabetes
12 Excluded after the screening of the full-text Reasons for exclusion:
1 No targeted outcome 1 Interventions were
combined green tea and black tea 1 Interventions were
combines green tea and other anti-oxi- dants
6 Participants are neither type 2 diabetes nor pre-diabetes 3 Not randomised con-
trolled trials
Fig. 1. Flow-chart of study selection and exclusion in details.
Adapted from www.mdpi.com/link.
Meta-analysis
In total, data from six studies [16,17,19,26-28] that compared GT supplements with placebos were included in these meta-
analyses. Four studies were excluded from the meta-analyses since the beverages in these studies included sour tea [29], Gy- nostemma pentaphyllum tea [24,25], and lower dose of GT Table 2. Outcomes and results of the included studies
Study Outcomes Assessment point Results (intervention vs. control)
Fukino et al.
(2008) [16] FI, FG, HOMA-IR,
HbA1c T0: baseline
T1: 4 weeks HbA1c (%): T0: 6.2±2.0 vs. 6.1±1.3, P=0.03; T1: 5.9±1.9 vs. 6.1±1.4 FG (mmol/L): T0: 7.5±3.5 vs. 7.7±2.5, P=0.18; T1: 7.0±2.7 vs. 7.2±1.6 FI (µU/mL): T0: 8.8±7.3 vs. 10.3±10.1, P=0.41; T1: 7.4±7.3 vs. 6.5±4.0 HOMA-IR: T0: 3.0±2.9 vs. 3.7±4.4, P=0.35; T1: 2.4±2.5 vs. 2.1±1.3 Mirzaei et al.
(2009) [27] HbA1c, FI, FG T0: baseline
T1: 8 weeks HbA1c (%): T0: 7.21±1.63 vs. 7.61±2.04, P=0.3; T1: 7.25±1.87 vs. 8.17±2.09, P=0.05
FG (mmol/L): T0: 162.71±65.72 vs. 175.90±62.39, P=0.7; T1: 169.07±70.60 vs. 185.51±72.75, P=0.15
FI (µU/mL): T0: 15.92±7.42 vs. 14.13±4.39, P=0.3; T1: 16.70±8.99 vs.
15.57±7.03, P=0.06 Nagao et al.
(2009) [30] FI, FG, HbA1c T0: baseline
T1: 12 weeks T0–T1 Changes:
HbA1c (%): –0.37±0.12 vs. –0.01±0.17 FG (mg/dL): –8.0±4.7 vs. 4.9±5.7 FI (µU/mL): 1.78±0.81 vs. –0.55±0.46 Huyen et al.
(2010) [24] FI, FG, HbA1c,
HOMA-IR T0: baseline
T1: 12 weeks T0–T1 Changes:
HbA1c (%): 2.0±1.3 vs. 0.2±0.5
FG (mmol/L): –3.0±1.8 vs. –0.6±2.2, P=0.007 FI (pmol/L): –6.0±42.9 vs. –22.5±47.5, P=0.147 HOMA-IR: –2.14±3.05 vs. 1.1±3.27, P=0.023 Hsu et al.
(2011) [17] FI, FG, HOMA-IR,
HbA1c T0: baseline
T1: 16 weeks T0–T1 Changes:
HbA1c (%): 4.3±9.1 vs. 3.0±9.0, P=0.54 FG (mmol/L): 0.26±1.58 vs. 0.15±1.25, P=0.76 FI (UI/L): 11.0±47.6 vs. –0.4±65.1, P=0.41 HOMA-IR: 11.1± 62.2 vs. 2.4±62.7, P=0.57 Huyen et al.
(2013) [25] FI, FG T0: baseline
T1: 4 weeks T0–T1 Changes:
FG (mmol/L): –1.9±1.0 vs. –0.2±1.5, P<0.001 FI (pmol/L): –0.23±7.8 vs. –0.3±9.8, P=0.984 Mousavi et al.
(2013) [28] FG T0: baseline
T1: 8 weeks FG: T0: 142.0±42.0 vs. 144.3±44.9 ; T1: 143.6±43.9 vs. 142.9±3.2 Lasaite et al.
(2014) [26] HbA1c T0: baseline
T1: 9 months HbA1c (%): T0: 7.8±1.4 vs. 8.1±2.0; T1: 7.5±1.3 vs. 7.5±1.5 Liu et al.
(2014) [19] FI, FG, HOMA-IR,
HbA1c T0: baseline
T1: 16 weeks T0–T1 Changes:
FG (mg/dL): 9.0±30.3 vs. –0.6±25.2, P=0.13 HbA1c (%): 0.0±5.5 vs. –0.2±0.6, P=0.24 FI (IU/L): –6.3±10.0 vs. –4.7±13.5, P=0.54 HOMA-IR: –0.20±4.0 vs. 1.3±4.8, P=0.50 Mozaffari-Khosravi
et al. (2014) [29] FG, HOMA-IR T0: baseline
T1: 4 weeks T0–T1 Changes:
FG (mg/dL): –1.6±26 vs. 1.2±26, P=0.5
HOMA-IR: T0: 1.20 vs. 1.30, P=0.6; T1: 1.60 vs. 1.10, P=0.004 Ryu et al.
(2006) [31] FI, FG, HOMA-IR T0: baseline
T1: 4weeks T0- T1 Changes:
FG (mmol/L): 6.7±1.3 vs. 6.9±1.1, P=0.09 FI (µU/mL): 10.29±1.69 vs. 10.40±1.47, P=0.71 HOMA-IR: 2.99±1.71 vs. 3.15±1.51, P=0.45 Values are presented as mean±standard deviation.
FI, fasting insulin; FG, fasting blood glucose; HOMA-IR, homeostatic model assessment for insulin resistance; HbA1c, glycosylated hemoglo- bin.
[30], which might be less comparative. One study was exclud- ed due to the very low report quality [26]. Diet and physical activities were controlled in each arm of the six included RCTs.
These studies were excluded post hoc as we had not anticipated this variation prior to extraction. Forest plots depicting the re- sults of meta-analysis are shown in Fig. 3.
HbA1c
Five studies involving 308 participants provided data for HbA1c concentration before and after the intervention (Fig.
3A) [16,17,19,26,27]. There was no overall difference between the treatment and control arms (SMD, –0.32; 95% CI, –0.86 to 0.23; P=0.25) for all studies. Considerable heterogeneity was found in the subgroups of GT/GTE (I²=87%), while the decaf- feinated GTE group showed consistent results (I²=0%). For the subgroup analysis, there was no effect for GT/GTE (SMD, –0.50; 95% CI, –1.44 to 0.43; P=0.29) or decaffeinated GTE (SMD, –0.04; 95% CI, –0.37 to 0.29; P=0.81) on HbA1c.
Fasting glucose
Five studies with 326 participants provided information for the analysis of fasting glucose at baseline and after the intervention
(Fig. 3B) [16,17,19,27,28]. No evidence was found that GT/
GTE affects FG levels in comparison to the placebo group (SMD, –0.10; 95% CI, –0.50 to 0.30; P=0.61). The heterogene- ity within the subgroup of GT/GTE was considerable (I²=
81%); comparatively, the decaffeinated GTE group showed a low level of heterogeneity (I²=10%). Findings from subgroup analysis showed no effect of the test beverage in both the decaf- feinated GTE and the GT/GTE groups (SMD, –0.26; 95% CI, –0.61 to 0.09; P=0.14) (SMD, 95% CI, 0.02; –0.68 to 0.72; P=
0.96, respectively).
Fasting insulin
Data from four studies were pooled in to the FI analysis, from Table 3. Excluded studies after screening of the full text
Excluded study Reasons for exclusion
MacKenzie et al. (2007) [32] Intervention are combined green tea and black tea
Fenercioglu et al. (2010) [33] Intervention are combined green tea and pomegranate extract
Stote et al. (2012) [34] Participants are neither T2DM or pre-diabetes patients
Vieira Senger et al. (2012) [35] Participants are neither T2DM or pre-diabetes patients
Huang et al. (2013) [36] Not RCT
Pham et al. (2014) [37] Participants are neither T2DM or pre-diabetes patients
Takahash et al. (2014) [38] No targeted outcomes reported Keske et al. (2015) [39] Not RCT
Dower et al. (2015) [40] Participants are neither T2DM or pre-diabetes patients
Peristiowati et al. (2015) [41] Not RCT
Dostal et al. (2016) [42] Participants are neither T2DM or pre-diabetes patients
Lu et al. (2016) [43] Participants are neither T2DM or pre-diabetes patients
T2DM, type 2 diabetes mellitus; RCT, randomized controlled trial.
Fig. 2. Risk of bias summary: review authors’ judgements about each risk of bias item for each included study.
Fukino 2008 Hsu 2011 Huyen 2010 Huyen 2013 Lasaite 2014 Liu 2014 Mirzaei 2009 Mousavi 2013 Mozaffari-Khosravi 2014 Nagao 2009
Random sequence generation (selection bias) Allocation concealment (selection bias) Blinding of participants and personnel (performance bias) Blinding of outcome assessment (detection bias) Incomplete outcome data (attrition bias) Selective reporting (reporting bias) Other bias
Fig. 3. Meta-analysis results for each assessed outcome. (A) Comparison between decaffeinated green tea extract and placebo, outcome: glycosylated hemoglobin (HbA1c, %). (B) Comparison between decaffeinated green tea extract and green tea extract, outcome: fasting glucose. (C) Comparison between decaffeinated green tea extract and green tea extract, outcome: fasting insulin.
(D) Comparison between decaffeinated green tea extract and green tea extract versus placebo, outcome: homeostatic model as- sessment for insulin resistance (HOMA-IR). SD, standard deviation; IV, independent variable; CI, confidence interval.
D C B A HbA1c (%)
Fasting glucose
Fasting insulin
HOMA-IR
which a total of 277 participants were included (Fig. 3C) [16,17,19,27]. The overall heterogeneity was substantial (I²=63%) among these four studies and considerable for the subgroup of GT/GTE (I²=87%). No intervention effect on FI was seen overall (SMD, –0.25; 95% CI, –0.64 to 0.15, P=0.23) or in subgroup analyses (decaffeinated GTE: SMD, –0.16; 95%
CI, –0.49 to 0.16; P=0.32) (GT/GTE: SMD, –0.33; 95% CI, –1.31 to 0.66; P=0.51).
HOMA-IR
Three studies involving 205 participants were included in the HOMA-IR analysis (Fig. 3D); two studies using decaffeinated GTE [17,19] and one [16] using GT beverage as the interven- tion arm. There was no evidence that either intervention was effective in improving HOMA-IR (SMD, 0.10; 95% CI, –0.17 to 0.38; P=0.46). However, due to the insufficient amount of studies and the relatively small sample size, this analysis result may not be reliable.
DISCUSSION
In total, 11 studies were identified in this systematic review. Of these, six studies were included in the meta-analysis. We found no evidence of differences between GT/GTE/decaffeinated GTE and the placebo for any analyzed outcomes. Within the subgroup analyses we found considerable heterogeneity be- tween studies which may reflect the limited number of studies in this field. The general reporting quality of the included stud- ies was moderate to high. Moreover, eight of the studies in- cluded in this review were conducted in developing countries, where the prevalence rates of T2DM are higher than in devel- oped nations. Additionally, the types of GT provided in studies by [17,19,26,27] were capsules, which may be more convenient and acceptable for the T2DM participants than a GT beverage, since the drop-out participants cited the unacceptable taste of GT as their reason for leaving. However, the cost-effective fac- tors for using the capsules or the GT bags were not mentioned in these studies. It should also be noted that no information for this review is available from large-scale programmatic effec- tiveness trials. Instead, most of the information obtained was from small-scale studies using targeted fortification. In addi- tion, the majority of the studies were carried out in Asian countries (n=10), since GT consumption appeared to be more acceptable in these countries [21].
This systematic review and meta-analysis comprehensively
evaluated the effect of GT/GTE on insulin and glycemic pa- rameters in people with T2DM or pre-diabetes. Studies in- cluded in this review had been updated from Wang et al. [21], in which the findings show no effects of the GT/GTE on HbA1c, FG, FI, and HOMA-IR in people at risk of T2DM.
Compared to the current study, the latest studies included in Wang et al. [21] were published in 2011 [15,17]. Moreover, the population in Wang et al. [21] included people with T2DM, prediabetes, obesity, or metabolic syndrome, where the sub- group analysis included only four studies of people with T2DM or prediabetes patients. Additionally, it might be criti- cized that the dependent variable in one of the studies in Wang et al. [21] did not focus on the T2DM, but on the cardiovascu- lar disease (CVD). Thus, we updated the literature search up to April 2017 to expand the evidence base for individuals with T2DM or prediabetes. In this review, six studies on T2DM or prediabetes people were pooled into meta-analysis and results show consensus evidence with Wang et al. [21]. Although these results suggested no effects of GT/GTE in the reduction of insulin resistance and the maintenance of glycemic, several findings provide evidence for further exploration. For one as- pect, findings of Nagao et al. [30] in 2009 indicated a reduction of HbA1c and fasting glucose levels. For another, in the results of a registered trial by Mozaffari-Khosravi et al. [29], GT had showed a positive effect on reducing the HOMA-IR level in people with T2DM. These two studies were excluded from the meta-analysis, since the comparison arm in both studies was neither a placebo nor the water, which might be less compara- tive. However, they provided evidence for the potential effects of GT on improving the insulin function. Future studies with complete comparisons between GT/GTE and placebo/water are required for improving the strength of this evidence.
In recent years, an increasing amount of research has sug- gested that GT may favorably modulate insulin sensitivity and glucose homeostasis and therefore inhibit the development of T2DM [9,44]. A review of experimental studies demonstrate that GT plays a role in enhancing insulin sensitivity by improv- ing the absorption of glucose into skeletal muscle in healthy subjects [9]. Evidence from animal studies indicates that the GTE could lower blood glucose levels and alleviate insulin re- sistance in diabetic mice by increasing the expression of glu- cose transporter IV and improving muscular β-oxidation [12,45]. An animal study reported that the increased insulin concentrations were found in rats with 23 g GTE feeding per day; this study suggested that a higher consumption of GT
were beneficial for T2DM prevention [46]. Further, a meta- analyses included 17 RCTs found that GT/GTE consumptions are associated with improved glycemic control and reduced FI concentration in healthy subjects as well as in people with obe- sity, CVD, cancer, and T2DM [20]. Comparatively, different findings were found in another meta-analyses, which included nine cohort studies to explore the consumption of tea and the risk of T2DM [47]. Although results from this meta-analyses show no association between the tea consumption and the re- duced T2DM risk (risk ratio [RR], 0.96; 95% CI, 0.92 to 1.01), stratified analyses of this study indicated that >4 cups per day tea consumption might related to the prevention of T2DM (RR, 0.8; 95% CI, 0.7 to 0.93). Recently, another meta-analysis included 10 studies identified that the consumptions of tea could alleviate the decrease of fasting blood insulin (1.30 U/L;
95% CI, 0.36 to 2.24) in T2DM subjects whereas no differences found in homeostasis model of insulin resistance 0.38 (95% CI, 0.18 to 0.95) and fasting blood glucose 0.05 mmol/L (95% CI, 0.51 to 0.40) [48]. The test tea in both meta-analyses included black tea, oolong tea, GT, and a combination of the tea ex- tracts.
This review has several limitations that should be acknowl- edged. First, only a small number of studies met the inclusion criteria. Second, due to the small number of studies included we were unable to repeat our analyses excluding studies of low methodological quality, which may have biased our results.
Moreover, the methodological qualities of some of the includ- ed studies are relatively low. Finally, the random-effects model used in these meta-analyses may achieve better estimates when a greater number of studies are included [23]. Thus, since these results are inconsistent, further RCTs with larger sample sizes and longer duration are needed in the future, in order to have a better estimation of the effects of GT/GTE in retarding the de- velopment of T2DM or its clinical consequences in people with T2DM or pre-diabetes.
As suggested by Bauer et al. [49], the prevention of T2DM is a ‘whole-of-life’ task requiring an integrated approach operat- ing from the origin of the disease. As one of the most popular beverages worldwide, tea had been examined in both epidemi- ological and experimental studies as a possible food supple- ments for the prevention of T2DM [8,46]. Therefore, any dis- covery of specific anti-diabetic effects in GT on insulin resis- tance and glycemic control might ultimately lead to therapeu- tic modalities that can retard the development of T2DM.
Based on the present meta-analysis results, in people with
T2DM, no reductions on the levels of HbA1c, fasting glucose, FI, and HOMA-IR were found in GT or GTE treatment groups, in comparison with the placebo groups. However, findings from the meta-analyses may be limited due to the small number of eligible studies. Results may also be affected by the limited duration of intervention, varied reporting quali- ty of the included studies. Therefore, further investigations in this field are necessary. Particularly, adequately powered RCTs with longer duration of follow-up are needed.
CONFLICTS OF INTEREST
No potential conflict of interest relevant to this article was re- ported.
ACKNOWLEDGMENTS
The work of all Ashley R. Cooper and Rachel Perry was sup- ported by the National Institute for Health Research (NIHR) Bristol Nutrition Biomedical Research Unit based at University Hospitals Bristol NHS Foundation Trust and the University of Bristol. The views expressed are those of the author(s) and not necessarily those of the NHS, the NIHR, or the Department of Health.
REFERENCES
1. World Health Organization. Obesity: preventing and manag- ing the global epidemic. Geneva: World Health Organization;
2000.
2. Kahn SE, Hull RL, Utzschneider KM. Mechanisms linking obesity to insulin resistance and type 2 diabetes. Nature 2006;
444:840-6.
3. World Health Organization. Global status report on noncom- municable diseases 2014. Geneva: World Health Organization;
2014.
4. American Diabetes Association. Diagnosis and classification of diabetes mellitus. Diabetes Care 2010;33 Suppl 1:S62-9.
5. DeFronzo RA. Insulin resistance, lipotoxicity, type 2 diabetes and atherosclerosis: the missing links. The Claude Bernard Lecture 2009. Diabetologia 2010;53:1270-87.
6. Ovalle F, Azziz R. Insulin resistance, polycystic ovary syn- drome, and type 2 diabetes mellitus. Fertil Steril 2002;77:1095- 105.
7. Diabetes Prevention Program Research Group. Reduction in
the incidence of type 2 diabetes with lifestyle intervention or metformin. Obstet Gynecol Surv 2003;58:182-3.
8. Huxley R, Lee CM, Barzi F, Timmermeister L, Czernichow S, Perkovic V, Grobbee DE, Batty D, Woodward M. Coffee, decaf- feinated coffee, and tea consumption in relation to incident type 2 diabetes mellitus: a systematic review with meta-analy- sis. Arch Intern Med 2009;169:2053-63.
9. Cabrera C, Artacho R, Gimenez R. Beneficial effects of green tea: a review. J Am Coll Nutr 2006;25:79-99.
10. Bose M, Lambert JD, Ju J, Reuhl KR, Shapses SA, Yang CS. The major green tea polyphenol, (-)-epigallocatechin-3-gallate, in- hibits obesity, metabolic syndrome, and fatty liver disease in high-fat-fed mice. J Nutr 2008;138:1677-83.
11. Ortsater H, Grankvist N, Wolfram S, Kuehn N, Sjoholm A.
Diet supplementation with green tea extract epigallocatechin gallate prevents progression to glucose intolerance in db/db mice. Nutr Metab (Lond) 2012;9:11.
12. Tsuneki H, Murata S, Anzawa Y, Soeda Y, Tokai E, Wada T, Kimura I, Yanagisawa M, Sakurai T, Sasaoka T. Age-related in- sulin resistance in hypothalamus and peripheral tissues of orexin knockout mice. Diabetologia 2008;51:657-67.
13. Oba S, Nagata C, Nakamura K, Fujii K, Kawachi T, Takatsuka N, Shimizu H. Consumption of coffee, green tea, oolong tea, black tea, chocolate snacks and the caffeine content in relation to risk of diabetes in Japanese men and women. Br J Nutr 2010;
103:453-9.
14. Toolsee NA, Aruoma OI, Gunness TK, Kowlessur S, Dambala V, Murad F, Googoolye K, Daus D, Indelicato J, Rondeau P, Bourdon E, Bahorun T. Effectiveness of green tea in a random- ized human cohort: relevance to diabetes and its complica- tions. Biomed Res Int 2013;2013:412379.
15. Basu A, Du M, Sanchez K, Leyva MJ, Betts NM, Blevins S, Wu M, Aston CE, Lyons TJ. Green tea minimally affects biomark- ers of inflammation in obese subjects with metabolic syn- drome. Nutrition 2011;27:206-13.
16. Fukino Y, Ikeda A, Maruyama K, Aoki N, Okubo T, Iso H.
Randomized controlled trial for an effect of green tea-extract powder supplementation on glucose abnormalities. Eur J Clin Nutr 2008;62:953-60.
17. Hsu CH, Liao YL, Lin SC, Tsai TH, Huang CJ, Chou P. Does supplementation with green tea extract improve insulin resis- tance in obese type 2 diabetics? A randomized, double-blind, and placebo-controlled clinical trial. Altern Med Rev 2011;16:
157-63.
18. Brown AL, Lane J, Coverly J, Stocks J, Jackson S, Stephen A,
Bluck L, Coward A, Hendrickx H. Effects of dietary supple- mentation with the green tea polyphenol epigallocatechin- 3-gallate on insulin resistance and associated metabolic risk factors: randomized controlled trial. Br J Nutr 2009;101:886- 94.
19. Liu CY, Huang CJ, Huang LH, Chen IJ, Chiu JP, Hsu CH. Ef- fects of green tea extract on insulin resistance and glucagon- like peptide 1 in patients with type 2 diabetes and lipid abnor- malities: a randomized, double-blinded, and placebo-con- trolled trial. PLoS One 2014;9:e91163.
20. Liu K, Zhou R, Wang B, Chen K, Shi LY, Zhu JD, Mi MT. Effect of green tea on glucose control and insulin sensitivity: a meta- analysis of 17 randomized controlled trials. Am J Clin Nutr 2013;98:340-8.
21. Wang X, Tian J, Jiang J, Li L, Ying X, Tian H, Nie M. Effects of green tea or green tea extract on insulin sensitivity and glycae- mic control in populations at risk of type 2 diabetes mellitus: a systematic review and meta-analysis of randomised controlled trials. J Hum Nutr Diet 2014;27:501-12.
22. Schulz KF, Altman DG, Moher D; CONSORT Group. CON- SORT 2010 statement: updated guidelines for reporting paral- lel group randomised trials. BMC Med 2010;8:18.
23. Higgins JP, Green S. Cochrane handbook for systematic re- views of interventions. Chichester: John Wiley & Sons; 2011.
24. Huyen VT, Phan DV, Thang P, Hoa NK, Ostenson CG. Antidi- abetic effect of Gynostemma pentaphyllum tea in randomly as- signed type 2 diabetic patients. Horm Metab Res 2010;42:353- 7.
25. Huyen VT, Phan DV, Thang P, Hoa NK, Ostenson CG. Gyn- ostemma pentaphyllum tea improves insulin sensitivity in type 2 diabetic patients. J Nutr Metab 2013;2013:765383.
26. Lasaite L, Spadiene A, Savickiene N, Skesters A, Silova A. The effect of Ginkgo biloba and Camellia sinensis extracts on psy- chological state and glycemic control in patients with type 2 di- abetes mellitus. Nat Prod Commun 2014;9:1345-50.
27. Mirzaei K, Hossein-Nezhad A, Karimi M, Hosseinzadeh-Attar MJ, Jafari N, Najmafshar A, Larijani B. Effect of green tea ex- tract on bone turnover markers in type 2 diabetic patients: a double-blind, placebo-controlled clinical trial study. Daru 2010;17(Suppl 1):38-44.
28. Mousavi A, Vafa M, Neyestani T, Khamseh M, Hoseini F. The effects of green tea consumption on metabolic and anthropo- metric indices in patients with type 2 diabetes. J Res Med Sci 2013;18:1080-6.
29. Mozaffari-Khosravi H, Ahadi Z, Fallah Tafti M. The effect of
green tea versus sour tea on insulin resistance, lipids profiles and oxidative stress in patients with type 2 diabetes mellitus: a randomized clinical trial. Iran J Med Sci 2014;39:424-32.
30. Nagao T, Meguro S, Hase T, Otsuka K, Komikado M, Tokimit- su I, Yamamoto T, Yamamoto K. A catechin-rich beverage im- proves obesity and blood glucose control in patients with type 2 diabetes. Obesity (Silver Spring) 2009;17:310-7.
31. Ryu OH, Lee J, Lee KW, Kim HY, Seo JA, Kim SG, Kim NH, Baik SH, Choi DS, Choi KM. Effects of green tea consumption on inflammation, insulin resistance and pulse wave velocity in type 2 diabetes patients. Diabetes Res Clin Pract 2006;71:356- 8.
32. Mackenzie T, Leary L, Brooks WB. The effect of an extract of green and black tea on glucose control in adults with type 2 di- abetes mellitus: double-blind randomized study. Metabolism 2007;56:1340-4.
33. Fenercioglu AK, Saler T, Genc E, Sabuncu H, Altuntas Y. The effects of polyphenol-containing antioxidants on oxidative stress and lipid peroxidation in type 2 diabetes mellitus without complications. J Endocrinol Invest 2010;33:118-24.
34. Stote KS, Clevidence BA, Novotny JA, Henderson T, Radecki SV, Baer DJ. Effect of cocoa and green tea on biomarkers of glucose regulation, oxidative stress, inflammation and hemo- stasis in obese adults at risk for insulin resistance. Eur J Clin Nutr 2012;66:1153-9.
35. Vieira Senger AE, Schwanke CH, Gomes I, Valle Gottlieb MG.
Effect of green tea (Camellia sinensis) consumption on the components of metabolic syndrome in elderly. J Nutr Health Aging 2012;16:738-42.
36. Huang SM, Chang YH, Chao YC, Lin JA, Wu CH, Lai CY, Chan KC, Tseng ST, Yen GC. EGCG-rich green tea extract stimulates sRAGE secretion to inhibit S100A12-RAGE axis through ADAM10-mediated ectodomain shedding of extra- cellular RAGE in type 2 diabetes. Mol Nutr Food Res 2013;57:
2264-8.
37. Pham NM, Nanri A, Kochi T, Kuwahara K, Tsuruoka H, Kuro- tani K, Akter S, Kabe I, Sato M, Hayabuchi H, Mizoue T. Coffee and green tea consumption is associated with insulin resistance in Japanese adults. Metabolism 2014;63:400-8.
38. Takahashi M, Miyashita M, Suzuki K, Bae SR, Kim HK, Waki- saka T, Matsui Y, Takeshita M, Yasunaga K. Acute ingestion of catechin-rich green tea improves postprandial glucose status and increases serum thioredoxin concentrations in postmeno- pausal women. Br J Nutr 2014;112:1542-50.
39. Keske MA, Ng HL, Premilovac D, Rattigan S, Kim JA, Munir K, Yang P, Quon MJ. Vascular and metabolic actions of the green tea polyphenol epigallocatechin gallate. Curr Med Chem 2015;
22:59-69.
40. Dower JI, Geleijnse JM, Gijsbers L, Zock PL, Kromhout D, Hollman PC. Effects of the pure flavonoids epicatechin and quercetin on vascular function and cardiometabolic health: a randomized, double-blind, placebo-controlled, crossover trial.
Am J Clin Nutr 2015;101:914-21.
41. Peristiowati Y, Indasah I, Ratnawati R. The effects of catechin isolated from green tea GMB-4 on NADPH and nitric oxide levels in endothelial cells exposed to high glucose. J Intercult Ethnopharmacol 2015;4:114-7.
42. Dostal AM, Samavat H, Espejo L, Arikawa AY, Stendell-Hollis NR, Kurzer MS. Green tea extract and catechol-O-methyl- transferase genotype modify fasting serum insulin and plasma adiponectin concentrations in a randomized controlled trial of overweight and obese postmenopausal women. J Nutr 2016;
146:38-45.
43. Lu PH, Hsu CH. Does supplementation with green tea extract improve acne in post-adolescent women? A randomized, dou- ble-blind, and placebo-controlled clinical trial. Complement Ther Med 2016;25:159-63.
44. Sae-tan S, Grove KA, Lambert JD. Weight control and preven- tion of metabolic syndrome by green tea. Pharmacol Res 2011;
64:146-54.
45. Nishiumi S, Bessyo H, Kubo M, Aoki Y, Tanaka A, Yoshida K, Ashida H. Green and black tea suppress hyperglycemia and in- sulin resistance by retaining the expression of glucose trans- porter 4 in muscle of high-fat diet-fed C57BL/6J mice. J Agric Food Chem 2010;58:12916-23.
46. Islam MS, Choi H. Green tea, anti-diabetic or diabetogenic: a dose response study. Biofactors 2007;29:45-53.
47. Jing Y, Han G, Hu Y, Bi Y, Li L, Zhu D. Tea consumption and risk of type 2 diabetes: a meta-analysis of cohort studies. J Gen Intern Med 2009;24:557-62.
48. Li Y, Wang C, Huai Q, Guo F, Liu L, Feng R, Sun C. Effects of tea or tea extract on metabolic profiles in patients with type 2 diabetes mellitus: a meta-analysis of ten randomized controlled trials. Diabetes Metab Res Rev 2016;32:2-10.
49. Bauer DC, Gaff C, Dinger ME, Caramins M, Buske FA, Fenech M, Hansen D, Cobiac L. Genomics and personalised whole-of- life healthcare. Trends Mol Med 2014;20:479-86.
Appendix 1. Search strategy (MEDLINE) 1. diabetes.af.
2. diabetes mellitus.af.
3. type 2 diabetes.af.
4. T2D.af.
5. T2DM.af.
6. "type 2 diabetes mellitus".af.
7. (insulin adj1 resistance).af.
8. insulin*.af.
9. (insulin adj1 sensitivit*).af.
10. (glucose adj1 control).af.
11. (glycemic adj1 control).af.
12. (glucose adj1 tolerance).af.
13. glucose*.af.
14. glycaemic*.af.
15. (blood adj1 sugar).af.
16. 1 or 2 or 3 or 4 or 5 or 6 or 7 or 8 or 9 or 10 or 11 or 12 or 13 or 14 or 15
17. (green adj1 tea*).af.
18. (tea adj1 extract*).af.
19. GT.af.
20. GTE.af.
21. EGCG.af.
22. catechin.af.
23. (epigallocatechin adj1 gallate).
af.
24. epigallocatechin.af.
25. exp Tea/
26. 17 or 18 or 19 or 20 or 21 or 22 or 23 or 24 or 25
27. exp Randomized Controlled
Trials as Topic/
28. Random Allocation/
29. Double-Blind Method/
30. Single-Blind Method/
31. Clinical Trial/
32. exp Clinical Trials as Topic/
33. clinical trial, phase i.pt.
34. clinical trial, phase ii.pt.
35. clinical trial, phase iii.pt.
36. clinical trial, phase iv.pt.
37. controlled clinical trial.pt.
38. randomi#ed controlled trial.
39. multicenter study.pt.pt.
40. clinical trial.pt.
41. (clinical adj trial).tw.
42. ((sing* or doubl* or treb* or tripl*) adj (blind* or mask*)).
43. Placebos/ tw.
44. placebo*.tw.
45. exp Placebo Effect/
46. random*.tw.
47. (crossover or cross-over).tw.
48. RCT*.tw.
49. ((allocat* or assign*) adj2 ran- dom*).tw.
50. (randomi?ed or randomi?
ation).tw.
51. randomly.ab.
52. ((administ* or allocat* or as-
sign* or class* or control* or determine* or divide* or dis- tribut* or expose* or fashion*
or number* or place* or re- cruit* or substitut* or treat*) adj3 random*).tw.
53. drug therapy.fs.
54. trial.tw.
55. groups.ab.
56. (control* adj3 (trial* or study or studies)).tw.
57. ((singl* or doubl* or treb* or tripl*) adj3 (blind* or mask* or dummy*)).tw.
58. (control* adj3 (trial* or study or studies)).tw.
59. ((singl* or doubl* or treb* or tripl*) adj3 (blind* or mask* or dummy*)).mp.
60. Clinical Trial, Phase II/
61. Clinical Trial, Phase III/
62. Clinical Trial, Phase IV/
63. exp Randomized Controlled Trial/
64. exp Pragmatic Clinical Trial/
65. ((waitlist* or wait* list* or treatment as usual or TAU) adj3 (control or group)).ab.
66. 27 or 28 or 29 or 30 or 31 or 32 or 33 or 34 or 35 or 36 or 37 or 38 or 39 or 40 or 41 or 42 or 43
or 44 or 45 or 46 or 47 or 48 or 49 or 50 or 51 or 52 or 53 or 54 or 55 or 56 or 57 or 58 or 59 or 60 or 61 or 62 or 63 or 64 or 65 67. 16 and 26 and 66
68. (animals not humans).mp.
[mp=title, abstract, original ti- tle, name of substance word, subject heading word, key- word heading word, protocol supplementary concept word, rare disease supplementary concept word, unique identifi- 69. exp Animals, Laboratory/ er]
70. exp Animal Experimentation/
71. exp Rats/
72. exp Rodentia/
73. (rat* or mouse).mp. or mice.
ti,ab. [mp=title, abstract, orig- inal title, name of substance word, subject heading word, keyword heading word, proto- col supplementary concept word, rare disease supplemen- tary concept word, unique identifier]
74. 68 or 69 or 70 or 71 or 72 or 73 75. 67 not 74