ARTICLE
Int J Thyroidol 2020 November 13(2): 118-127 https://doi.org/10.11106/ijt.2020.13.2.118Received April 28, 2020 / Revised May 28, 2020 / Accepted June 1, 2020
Correspondence: Young Joo Park, MD, PhD, Department of Internal Medicine, Seoul National University College of Medicine, 101 Daehak-ro, Jongno-gu, Seoul 03080, Korea
Tel: 82-2-2072-4183, Fax: 82-2-764-2199, E-mail: [email protected]
Copyright ⓒ the Korean Thyroid Association. All rights reserved.
This is an open-access article distributed under the terms of the Creative Commons Attribution Non-Commercial License (http://creative- commons.org/licenses/by-nc/4.0/), which permits unrestricted non-commercial use, distribution, and reproduction in any medium, provided the original work is properly cited.
Changes of Nodular Size and Its Risk Factors in Iodine-Sufficient Area: a Retrospective Cohort Analysis of 7753 Thyroid Nodules
Hwa Young Ahn
1, Kyung Won Kim
2, Hoon Sung Choi
3, Jae Hoon Moon
4, Ka Hee Yi
5, Min Kyung Hyun
6, Min Joo Kang
7, Jung Im Shim
7, Ja Youn Lee
7, Do Joon Park
2and Young Joo Park
2Department of Internal Medicine, Chung-Ang University College of Medicine1, Department of Internal Medicine, Seoul National University College of Medicine2, Seoul, Department of Internal Medicine, Kangwon National University School of Medicine3, Chuncheon, Department of Internal Medicine, Seoul National University Bundang Hospital4, Seongnam, Department of Internal Medicine, Seoul National University Boramae Medical Center5, Seoul, Department of Preventive Medicine, College of Korean Medicine, Dongguk University6, Gyeongju, National Evidence-Based Healthcare Collaborating Agency7, Seoul, Korea
Background and Objectives: Iodine is known to be an important factor in the occurrence of goiter, and South Korea is a region with sufficient iodine supplementation. In this regard, we checked the size change of thyroid nodules found by health check-up in Koreans and examined which risk factors influence the size change. Materials and Methods: A total 7753 subjects who underwent thyroid sonography two or more times were included. We defined that there was a change in the size of the nodule when the difference in diameter identified in the last ultrasound was more than 3 mm. Results: Thyroid nodules were decreased in 895 subjects (11.5%) and increased in 1041 subjects (13.5%). The rate of increased nodule was on an increasing trend according to the duration (annual percent change 2.6%, p<0.001). In contrast, the rate of decreased nodule was unchanged. Predictive factors related to decrease of the nodule size were young age, male sex, larger initial nodule size and thyroiditis.
Similarly, young age, larger initial nodule size and diffuse parenchymal abnormality were significant predictive factors for increased nodules. However, diffuse parenchymal abnormality was not a predictive factor when we analyzed only thyroid nodules larger than 1 cm. Conclusion: In our study, 11.5-13.5% of benign thyroid nodules were increased or decreased during median 27 months of follow-up in iodine sufficient condition. Young age, larger initial size and diffuse parenchymal abnormality were common predictive factor affecting both the increase and decrease of thyroid nodules.
Key Words: Thyroid nodule, Size, Iodine, Diffuse parenchymal abnormality
Introduction
The detection of thyroid nodules has been increased since ultrasonography commonly used for thyroid examination. Even very small sized nodules (1-2 mm) can be found by high resolution ultrasonography. In
some prospective studies using ultrasonography, 20 to 70 percent of subjects had thyroid nodules.1-3) Among them, only 5 to 10% of thyroid nodules are known to be malignant,4,5) and most are benign and requires no treatment throught the life. However, benign nodules also can cause clinical conditions requiring surgical treatment by compressive symptoms such as neck
fullness, dysphagia, odynophagia, and dyspnea6) or some benign nodules have a malignant potential and may later be diagnosed with thyroid cancer.7) Therefore, when thyroid nodules with low or very low suspicious ultrasonographic pattern detected, 12 to 24 months of follow-up of ultrasonography is recommended.8,9) However, the adequate interval of follow-up to mon- itor the changes of nodular size is not yet determined, because there exists only limited knowledge about the changes; one report in iodine deficient area showed that 61.2% of benign thyroid nodules showed a con- tinuous growth during 5 year follow-up,10) and the other report performed in moderately iodine-deficient area demostrtated that only one-third of benign thy- roid nodules showed continuous growth during 40 months’ follow-up.11)
Because the relation between iodine deficiency and occurrence of goiter and hypothyroidism is well estab- lished,12) those result could suggest iodine-deficiency as a risk factor of changes in nodular size. Also, a study in China showed the possibe relation between iodine and the risk for the occurrence of diffuse goiter showed U-shape curve in the 3 areas with different iodine intakes,13) suggesting a possible difference in the natural history of benign thyroid nodules in iodine sufficient condition compared with iodine deficient area. However, there is only a few studies reported unitl now.14,15)
It is not yet clear what risk factors influence the change in nodule size except iodine supplementation status. However, previous studies have suggested that metabolic abnormalities, such as imparied glucose metabolism,16) metabolic syndrome and insulin resist- ance17) and type 2 diabetes melliuts,18) may affect the thyroid volume and nodule prevalence. Therefore, it is possible that these metabolic abnormalities affect the change in nodule size.
Korea belongs to the iodine sufficient area19) and thyroid ultrasonography has been performed very commonly for the health checkups. So, to investigate the changes of nodular size in iodine sufficient area, we retrospectively analysed the size change of benign thyroid nodules using a relatively large database of the health checkups in two large heathcare centers. Also
we evaluate predictive clinical factors for the changes of thyroid nodule size.
Materials and Methods
Subjects
From 2003 to 2011, 19,058 subjects underwent thyroid sonography 2 or more times in Seoul National University Hospital Healthcare System or the Health Promotion Center of Seoul National Bundang Hospital.
Among the subject, 9935 showed no nodule and 941 had only pure cysts at initial sonography. Remained 8182 subjects showed one or more pure solid or mixed solid and cystic nodule(s) at baseline exammination. Among them, 303 subjects were ex- cluded because the duration of follow-up was less than 3 months, and 126 were also excluded because they underwent some management for the nodules during the follow-up period; 125 underwent surgery and 1 radiofrequency ablation. Finally, 7753 were in- cluded in this study (male 41.7%, mean age 52.1±9.4 years old). Their median duration of follow up was 27.0 months (interquartile range [IQR] 13.3–48.1), and the number of sonography underwent was mean 3.1±1.4 (median [IQR] 3.0 [2.0–4.0]) times. We retrospecitvely reviewed the medical records of all subjects about sex, age, date and numbers of thyroid sonography, nodule size, body mass index, waist circumference, body fat %, systolic and diastolic blood pressure, smoking history and laborytory results including thy- roid stimulating hormone (TSH), free T4, fasting glu- cose, HbA1c, and total cholesterol. Blood samples were taken from all participants after overnight fasting.
The protocols of all laboratory tests were identical to that of our previous study.20) When we analyzed for each parameter, we excluded the case of taking drugs that could affect the result of each parameter (e.g., thyroid hormone, anti-hypertensive or anti-diabetic medication, etc.).
Thyroid sonographic examination was performed in our health care centers by several radiologists using high-resolution ultrasonography. Thyroid nodules were defined as one or more discrete lesions which were
within the thyroid gland but radiologically distinct from surrounding thyroid parenchyma. If there are coex- istence of cyst and nodule in one patient, we classified it as a nodule. We used the maximal diameter of nod- ule recorded at baseline examination as its repre- sentative, and then compared final maximal diameter of the nodule at last follow up exammination. When multiple nodules were found, we measured maximal diameter of largest nodule and compared the size change of that nodule. Significant change was defined when maximal diameter increased or decreased 3 mm or more to minimize operator-dependent differences in size assessement.21) Heterogeneous echogenicity includes coarse or diffuse micronodulative patterns without definite focal nodule. They had decreased or increased parenchymal echogenicity, which was es- tablished by comparing the brightness of the echoes from the thyroid with those from the surrounding neck muscles and connective tissue.22) This study was ap- proved by the Institutional Review Board (IRB) and ethics committe of Seoul National Univeristy Hospital (No 1106-113-367) and Seoul National Univeristy Bundang Hospital (No B-1107-132-007).
Statistical Analysis
Comparisons between two groups (no change vs.
decreased or increased group) were analyzed by Mann-Whitney’s U test for continuous variables.
Continuous variables were expressed as mean±stand- ard deviation (SD). For categorical variables, we used χ2 test. Two-sided p<0.05 was considered significant.
Multivariate logistic regression analysis was used to evaluate the influence of several risk factors to changes of nodule size. Confidence intervals (CIs) were set to 95%. Time to changes of nodule size was determined by using life-table methods. We performed Cox pro- portional hazard regression to evaluate the effect of age, sex, initial size of nodules, TSH, smoking, body mass index, fasting glucose, total cholesterol and dif- fuse parenchymal abnormality to changes of nodule size. Data were analyzed by using IBM SPSS statistics, version 20 (IBM, Chicago, IL, USA).
Results
Changes of Nodule Size According to the Duration of Follow-Up
When we compare the size of last examination with the initial result, thyroid nodules were decreased in 895 subjects (11.5% of total) during median 35.2 months of follow-up (ranges 3.0-87.3 months) and increased in 1041 subjects (13.5%) during median 37.1 months (ranges 3.0-91.3 months). Thyroid nod- ule was unchanged in 5817 subjects (75.0%) during median 25.7 months (ranges 3.0-91.3 months).
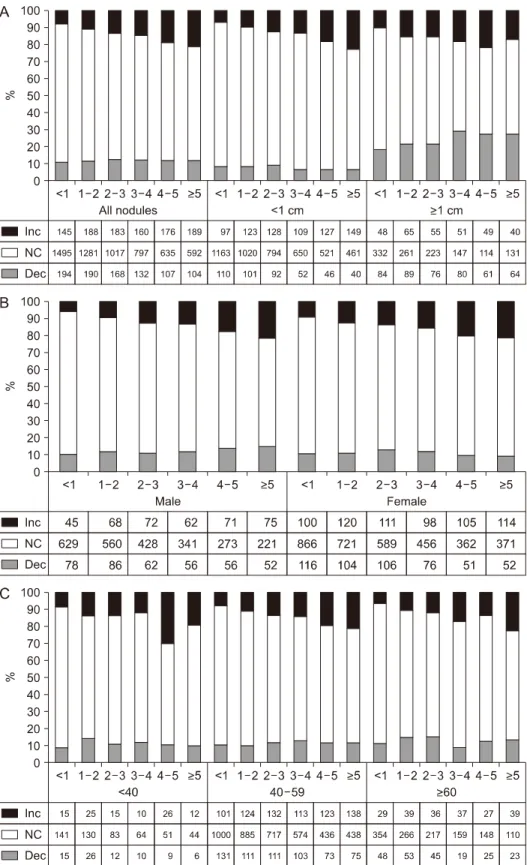
To examined the changes of nodular sizes according to each follow-up durations, we calcuated the rate of change by the year (Fig. 1A). In this analysis, the re- sults of all sonographic examination performed during the follow-up in one subject were included regardless of the number. Subsequent thyroid sonography was done within 1 year of follow-up in 1834 sujbects.
Among them, nodules were increased in 145 (7.9%) and decreased in 194 (10.6%). The rate of increased nodule was on an increasing trend according to the duration (annual percent change 2.6%, p<0.001), and after 5 years or more of follow-up, 21.4% of 885 nod- ules were increased. In contrast, the rate of decreased nodule was unchanged during the follow-up; 11.8% of nodules were decreased after 5 and more years of fol- low-up.
When we investigated the changes based on the initial size of the nodule, the incresing rate or its time-trend was similar to the total nodules in less than 1 cm (annaul pecent change 3.0%, p<0.001; Fig. 1A).
While increasing trend was not significant in nodules sized 1 cm or more. The reduction rate in nodule size did not chagned over time, but, the nodules less than 1 cm had significantly less reduction than all nodules (mean 7.4±1.2 vs. 11.7±0.6%, p=0.002). While the nodules sized 1 cm or more showed greater reduction rate than all nodules (mean 24.0±4.3 vs. 11.7±0.6%, p=0.002). The pattern of nodule change was similar when we classified the nodule by gender or age (Fig.
1B, 1C).
Fig. 1. The rate of change in the size of the thyroid nod- ules according to the follow- up period (years), the num- bers (<1, 1-2, 2-3, 3-4, 4-5, >5) on the horizontal axis indicate the duration of follow-up of the nodule. (A).
All nodules and when div- ided by size (1 cm). (B) When divided by gender. (C) When divided by age cate- gories (<40, 40-59, ≥60 years). Dec: decrease, Inc:
increase, NC: no change
Comparison of Baseline Demographic or Clinical Characteristics of Subjects According to the Change of Noduar Size
Baseline demographic or clinical characteristics of
subjects showing no change, decrease, or increase of their nodular size were summarized in Table 1.
Comparison was made between no change group and decreased or increased group. There was no sig- nificant difference of age and sex among the groups
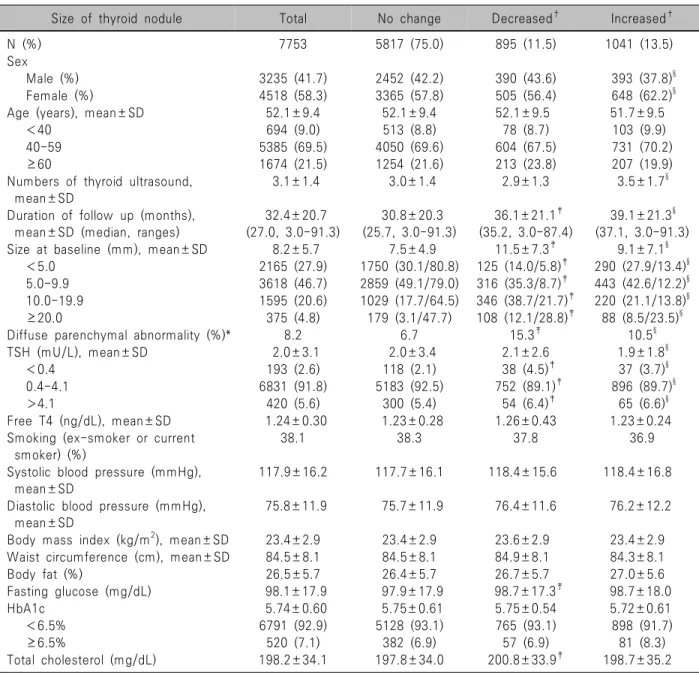
Table 1. Baseline characteristics of study subjects according to changes of nodule size
Size of thyroid nodule Total No change Decreased† Increased†
N (%) 7753 5817 (75.0) 895 (11.5) 1041 (13.5)
Sex
Male (%) 3235 (41.7) 2452 (42.2) 390 (43.6) 393 (37.8)§
Female (%) 4518 (58.3) 3365 (57.8) 505 (56.4) 648 (62.2)§
Age (years), mean±SD 52.1±9.4 52.1±9.4 52.1±9.5 51.7±9.5
<40 694 (9.0) 513 (8.8) 78 (8.7) 103 (9.9)
40-59 5385 (69.5) 4050 (69.6) 604 (67.5) 731 (70.2)
≥60 1674 (21.5) 1254 (21.6) 213 (23.8) 207 (19.9)
Numbers of thyroid ultrasound, mean±SD
3.1±1.4 3.0±1.4 2.9±1.3 3.5±1.7§
Duration of follow up (months), mean±SD (median, ranges)
32.4±20.7 (27.0, 3.0-91.3)
30.8±20.3 (25.7, 3.0-91.3)
36.1±21.1‡ (35.2, 3.0-87.4)
39.1±21.3§ (37.1, 3.0-91.3)
Size at baseline (mm), mean±SD 8.2±5.7 7.5±4.9 11.5±7.3‡ 9.1±7.1§
<5.0 2165 (27.9) 1750 (30.1/80.8) 125 (14.0/5.8)‡ 290 (27.9/13.4)§ 5.0-9.9 3618 (46.7) 2859 (49.1/79.0) 316 (35.3/8.7)‡ 443 (42.6/12.2)§ 10.0-19.9 1595 (20.6) 1029 (17.7/64.5) 346 (38.7/21.7)‡ 220 (21.1/13.8)§
≥20.0 375 (4.8) 179 (3.1/47.7) 108 (12.1/28.8)‡ 88 (8.5/23.5)§
Diffuse parenchymal abnormality (%)* 8.2 6.7 15.3‡ 10.5§
TSH (mU/L), mean±SD 2.0±3.1 2.0±3.4 2.1±2.6 1.9±1.8§
<0.4 193 (2.6) 118 (2.1) 38 (4.5)‡ 37 (3.7)§
0.4-4.1 6831 (91.8) 5183 (92.5) 752 (89.1)‡ 896 (89.7)§
>4.1 420 (5.6) 300 (5.4) 54 (6.4)‡ 65 (6.6)§
Free T4 (ng/dL), mean±SD 1.24±0.30 1.23±0.28 1.26±0.43 1.23±0.24
Smoking (ex-smoker or current smoker) (%)
38.1 38.3 37.8 36.9
Systolic blood pressure (mmHg), mean±SD
117.9±16.2 117.7±16.1 118.4±15.6 118.4±16.8
Diastolic blood pressure (mmHg), mean±SD
75.8±11.9 75.7±11.9 76.4±11.6 76.2±12.2
Body mass index (kg/m2), mean±SD 23.4±2.9 23.4±2.9 23.6±2.9 23.4±2.9
Waist circumference (cm), mean±SD 84.5±8.1 84.5±8.1 84.9±8.1 84.3±8.1
Body fat (%) 26.5±5.7 26.4±5.7 26.7±5.7 27.0±5.6
Fasting glucose (mg/dL) 98.1±17.9 97.9±17.9 98.7±17.3‡ 98.7±18.0
HbA1c 5.74±0.60 5.75±0.61 5.75±0.54 5.72±0.61
<6.5% 6791 (92.9) 5128 (93.1) 765 (93.1) 898 (91.7)
≥6.5% 520 (7.1) 382 (6.9) 57 (6.9) 81 (8.3)
Total cholesterol (mg/dL) 198.2±34.1 197.8±34.0 200.8±33.9‡ 198.7±35.2
*Diffuse parenchymal abnormality defined as heterogenous echogenicity in sonography.
†Significant changes of nodule were defined when the nodules increased or decreased at least 3 mm from their initial size during follow-up period.
‡No change vs. decreased.
§No change vs. increased.
SD: standard deviation
except more female percentage was shown in in- creased group (57.8% vs. 62.2%). Significant differ- ence was observed in follow-up duration, baseline size, rate of diffuse parenchymal abnormality and rate of abnormal TSH in both increased and decreased group. As expectedly, both groups showed longer du- ration of follow-up, larger size and more rate of diffuse
parenchymal abnormality and abnormal TSH than no change group (Table 1).
Both changes in nodular size were observed more frequently in large-sized nodules, especially, the de- creasing rate was significantly increased in nodules larger than 1 cm was more (21.7% in 10.0-19.9 mm sized nodules, 28.8% in nodules sized 2 cm or more)
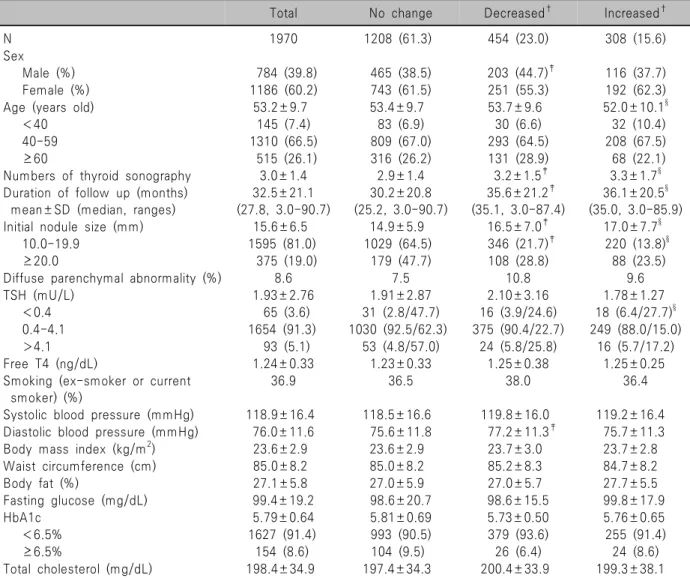
Table 2. Baseline characteristics of study subjects according to changes of nodule size in thyroid nodules 1 cm
Total No change Decreased† Increased†
N 1970 1208 (61.3) 454 (23.0) 308 (15.6)
Sex
Male (%) 784 (39.8) 465 (38.5) 203 (44.7)‡ 116 (37.7)
Female (%) 1186 (60.2) 743 (61.5) 251 (55.3) 192 (62.3)
Age (years old) 53.2±9.7 53.4±9.7 53.7±9.6 52.0±10.1§
<40 145 (7.4) 83 (6.9) 30 (6.6) 32 (10.4)
40-59 1310 (66.5) 809 (67.0) 293 (64.5) 208 (67.5)
≥60 515 (26.1) 316 (26.2) 131 (28.9) 68 (22.1)
Numbers of thyroid sonography 3.0±1.4 2.9±1.4 3.2±1.5‡ 3.3±1.7§
Duration of follow up (months) mean±SD (median, ranges)
32.5±21.1 (27.8, 3.0-90.7)
30.2±20.8 (25.2, 3.0-90.7)
35.6±21.2‡ (35.1, 3.0-87.4)
36.1±20.5§ (35.0, 3.0-85.9)
Initial nodule size (mm) 15.6±6.5 14.9±5.9 16.5±7.0‡ 17.0±7.7§
10.0-19.9 1595 (81.0) 1029 (64.5) 346 (21.7)‡ 220 (13.8)§
≥20.0 375 (19.0) 179 (47.7) 108 (28.8) 88 (23.5)
Diffuse parenchymal abnormality (%) 8.6 7.5 10.8 9.6
TSH (mU/L) 1.93±2.76 1.91±2.87 2.10±3.16 1.78±1.27
<0.4 65 (3.6) 31 (2.8/47.7) 16 (3.9/24.6) 18 (6.4/27.7)§
0.4-4.1 1654 (91.3) 1030 (92.5/62.3) 375 (90.4/22.7) 249 (88.0/15.0)
>4.1 93 (5.1) 53 (4.8/57.0) 24 (5.8/25.8) 16 (5.7/17.2)
Free T4 (ng/dL) 1.24±0.33 1.23±0.33 1.25±0.38 1.25±0.25
Smoking (ex-smoker or current smoker) (%)
36.9 36.5 38.0 36.4
Systolic blood pressure (mmHg) 118.9±16.4 118.5±16.6 119.8±16.0 119.2±16.4 Diastolic blood pressure (mmHg) 76.0±11.6 75.6±11.8 77.2±11.3‡ 75.7±11.3
Body mass index (kg/m2) 23.6±2.9 23.6±2.9 23.7±3.0 23.7±2.8
Waist circumference (cm) 85.0±8.2 85.0±8.2 85.2±8.3 84.7±8.2
Body fat (%) 27.1±5.8 27.0±5.9 27.0±5.7 27.7±5.5
Fasting glucose (mg/dL) 99.4±19.2 98.6±20.7 98.6±15.5 99.8±17.9
HbA1c 5.79±0.64 5.81±0.69 5.73±0.50 5.76±0.65
<6.5% 1627 (91.4) 993 (90.5) 379 (93.6) 255 (91.4)
≥6.5% 154 (8.6) 104 (9.5) 26 (6.4) 24 (8.6)
Total cholesterol (mg/dL) 198.4±34.9 197.4±34.3 200.4±33.9 199.3±38.1
*Diffuse parenchymal abnormality defined as heterogenous echogenicity in sonography.
†Significant changes of nodule were defined when the nodules increased or decreased at least 3 mm from theirinitial size during follow-up period.
‡No change vs. decreased.
§No change vs. increased.
SD: standard deviation
than smaller sized group (5.8 and 8.7% in nodules sized <0.5 and 5.0-9.9 mm), on the other hand, the increasing rate of nodules appeared to be significantly higher in nodules sized 2 cm or more (23.5% vs.
12.2-13.8%, p<0.05).
Interestingly, both decreasing (15.3% vs. 6.7% of no change group, p<0.001) and increasing (10.5% vs.
6.7% of no change group, p<0.001) rate was elevated with the presence of thyroiditis, and the difference was larger in decreasing group. The changes of nod- ular size are also more common among subjects
showing abnormal TSH levels, whether it is decreased or elevated, than those with normal TSH levels and it was more obvious in subjects with TSH levels less than 0.4 mU/L. However, free T4 levels were not dif- ferent among the groups.
In metabolic parameters, decreased group showed higher fasting glucose and cholesterol level than no change group although the differences of those pa- rameters were only minimal. Smoking status or blood pressure was also similar among the groups.
Because the nodules larger than 1 cm are now rec-
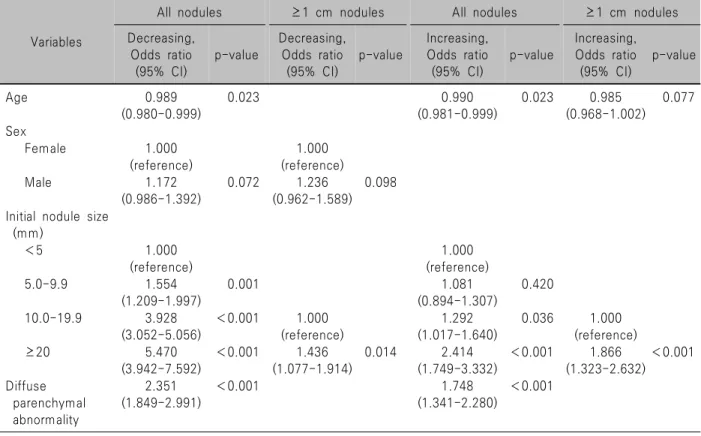
Table 3. Risk factors for changing thyroid nodules by cox proportional hazard model using backward elimination method
Variables
All nodules ≥1 cm nodules All nodules ≥1 cm nodules Decreasing,
Odds ratio (95% CI)
p-value
Decreasing, Odds ratio
(95% CI)
p-value
Increasing, Odds ratio
(95% CI)
p-value
Increasing, Odds ratio
(95% CI)
p-value
Age 0.989
(0.980-0.999)
0.023 0.990
(0.981-0.999)
0.023 0.985 (0.968-1.002)
0.077
Sex
Female 1.000
(reference)
1.000 (reference)
Male 1.172
(0.986-1.392)
0.072 1.236 (0.962-1.589)
0.098
Initial nodule size (mm)
<5 1.000
(reference)
1.000 (reference) 5.0-9.9 1.554
(1.209-1.997)
0.001 1.081
(0.894-1.307)
0.420
10.0-19.9 3.928 (3.052-5.056)
<0.001 1.000 (reference)
1.292 (1.017-1.640)
0.036 1.000 (reference)
≥20 5.470
(3.942-7.592)
<0.001 1.436 (1.077-1.914)
0.014 2.414
(1.749-3.332)
<0.001 1.866 (1.323-2.632)
<0.001
Diffuse parenchymal abnormality
2.351 (1.849-2.991)
<0.001 1.748
(1.341-2.280)
<0.001
CI: confidence interval
ommended for the further evaluation,23) we did same analysis for larger nodules larger than 1 cm (Table 2).
In most parameters, the difference of characteristics was similar to the results of all sized nodules in Table 1, however the statistical significance was diminished in some parameters; rate of diffuse parenchymal ab- normality was not shown significant difference and abnormal TSH level was different only in increased group. Interestingly, age was younger in increased group, and although there was no statistical sig- nificance, the proportion of size-decreased nodules was lower (20.7% in age less than 40 years group vs.
22.4% in 40-59 years old group or 25.4% in age 60 years or more group, p=0.543) and that of size-in- creased nodules was higher (22.1% in age less than 40 years group vs. 15.9% in 40-59 years old group or 13.2% in age 60 years or more group, p=0.060) in younger age group. Male sex was significantly higher in decreased group. Duration of follow-up was still longer, and size of nodule was larger in both de- creased and increased group.
Predictive Factors Associated with Size Changes of Thyroid Nodules
To know predictive factors associated with size changes of thyroid nodule, we evaluated the effects of several variables by Cox proportional hazards re- gression analysis. As shown Table 3, the significant risk factors related to the reduction of the size of thy- roid nodule were young age, male sex, larger initial nodule size, and thyroiditis. In contrast, regarding the increase in the size of the thyroid nodule, young age, larger initial nodule size and diffuse parenchymal ab- normality were significant risk factors. We did same analysis for 1 cm or more thyroid nodules, and as a result, the factors associated with reduction still male sex and larger size. In addition, young age and large initial nodule size were still identified as risk factors for size increase in nodules larger than 1 cm. When analyzing thyroid nodules sized 1 cm or more, the ef- fect of diffuse parenchymal abnormality on size in- crease was not statistically significant.
Discussion
In this study, 13.4% of thyroid nodules were in- creased in size and 11.5% were decreased during me- dian 27.0 (3.0-91.3) months of follow-up. Young age, male sex, larger initial nodule size and diffuse paren- chymal abnormality were related to the decreased size of nodues. Young age, larger nodule size and diffuse parenchymal abnormality also affect the increasing of thyroid nodules. However, the effect of diffuse paren- chymal abnormality for size change was not observed in larger nodules sized 1 cm or more. Metabolic factors such as fasting blood glucose, cholesterol, and BMI did not affect the change in nodule size.
The increasing rate of thyroid nodule was previously reported from 4.0 to 61.2%10,11,15,24,25)
and decreasing rate was from 13.1 to 33.1%10,11,25) according to vari- ous criteria or duration of follow-up in each study.
These criteria of size change of those previous studies were as follows: more than 15% or 30% change in volume,10,15,24) 50%11,15) or 3 mm of increase15) in nod- ule maximal diameter or a 20% increase ≥2 nodule diameters with a minimum increase of 2 mm.25) In our study, we defined significant change when maximal diameter increased or decreased 3 mm or more,21) and this criterion includes more patients compared to the criterion in which the maximum diameter changes by 50% or more, and fewer patients than the criterion in which the calculated volume changes by 15% or more.15) Based on these results, we applied a criterion for a change of at least 3 mm in diameter. Alexander et al.15) reported 26% increasing rate when they used same criteria to our study in maximal diameter of ≥3 mm during mean 20 months of follow-up. This study was conducted in United states and this is an area with sufficient iodine.
Iodine deficiency is the most important etiologic factor for goiter development and hypothyroidism,26) while contrary result is also exist that insufficient io- dine supply induced goiter.12) For growth of thyroid nodule, Quadbeck et al.10) reported 61.2% of the nod- ule increased ≥30% in volume during 5-year fol- low-up in iodine deficient area. Relatively small pro-
portion (13.5%) of thyroid nodules were increased in our study during similar duration of follow up. Similary, the cumulative incidence of nodular goiter was sig- nificantly smaller in iodine excessive area than mildly deficient area (0.8% vs. 5.0%) in recent study.13) In other words, our results suggest that where there is sufficient iodine, such as in South Korea, the likelihood of a change in the size of the nodule is lower than where it lacks iodine. Those results support the etio- logic relation of iodine status. It has been suggested that sufficient iodine supply could inhibit the increased secretion of TSH,27) and indeed, suppression of TSH with levothyroxine therapy could effectively prevente the increases of nodule size in long-term prospective study.28) However, in our study, when TSH was higher than normal (>4.1 mU/L), there was a tendency that a size change occurred, but it was confirmed in the Cox proportional hazard analysis that it was not a risk factor for size change of thyroid nodule.
About risk factors associated with thyroid nodule growth, several sonographic characteristics or clinical factors have been suggested in previous studies.
Longer duration of follow-up and lower cystic compo- nent was significant predictors of nodule growth (volume change ≥15%) in a multivariate analysis.15) Hypoechoic nodule type was a statistically significant predictor of nodule growth (volume change ≥15%) in other study.11) In recent prospective study, the pres- ence of multiple nodules, larger volume of main nod- ule (>0.2 ml) and male gender were associated with nodule growth, whereas old age (≥60 years) was as- sociated with lower risk of growth.25) All of these re- sults are those from iodine deficient area. In our re- sults, larger size of thyorid nodule and young age were also significant risk factors for nodule growth, sug- gesting that these risk factors would be similar re- gardless of iodine-intake status.
Interestingly, in our study, thyroiditis, or parencymal change, was identified as a risk factor for size change of thyroid nodule. However, when we analyzed only the nodules with size of 1 cm or more, the effects of diffuse parenchymal abnormality disappeared. These results are likely to be caused by difficulty in dis- tinguishing focal thyriditis from small hypoechoic thy-
roid nodules with ultrasonography.29) Therefore, it is possible that diffuse parenchymal abnormality which was mistaken for a small thyroid nodule may changed over time. Therefore, when we find a nodule less than 1 cm in size, it is necessary to determine the fol- low-up schedule considering that diffuse parenchymal abnormality and small thyroid nodules are difficult to differentiate.
Another interesting point of our result is that pre- vious studies have published several data on elevated blood glucose and increased thyroid volume and nod- ule prevalence,16,17) and our results show no associa- tion between increased nodule size and elevated blood glucose.
This study has some limitations. First, cytologic confirmation (fine-needle aspiration) was not per- formed in our heathcare institutes, so we could not confirm whether any cytologic exammination was per- formed or what was the cytologic result after the exammination. However, we excluded subjects who underwent surgery for thyroid. The subjects who had nodules with indetermiate or maligant features on so- nographic findings were routinely recommended fine needle aspiration during the follow-up, so, most nod- ules included in our study are possibly benign. A sec- ond potential limitation is a lack of other sonographic characteristics in the variables. Due to its retrospective nature, there was no unifed criteria for description of sonographic findings. So we could not include sono- graphic findings to the variables. Also due to interob- server variabltiy, we could not subdivied cystic com- ponent of thyroid nodules. In addition, although there is a high possibility of affecting the size change of the nodule depending on the ratio of the cystic portion in the nodule or the presence or absence of the cystic portion, it is difficult to analyze in our study, so a pro- spective study is needed in the future. Lastly, we compared only the largest nodules detected at initial exammination, so it is hard to tell exact change of the other thyroid nodules in process of time. Although these limitation, our study might provide very mean- ingful information because iodine intake is known to be a major environmental factor for thyroid nodular disease and there is scanty data about the changes
of thyorid nodule in iodine sufficient condition.
In conclusion, 11.5–13.5% of benign thyroid nodules were increased or decreased during median 27 months of follow-up in iodine sufficient condition.
Young age, larger initial size and diffuse parenchymal abnormality were common predictive factors affecting both the increase and decrease of thyroid nodules.
Acknowledgments
This study was supported by National Evidence- based Healthcare Collaborating Agency, NECA (NA13- 003).
Conflicts of Interest
No potential conflict of interest relevant to this ar- ticle was reported.
Orcid
Hwa Young Ahn: https://orcid.org/0000-0002-2737-6759 Kyung Won Kim: https://orcid.org/0000-0002-8046-0239 Hoon Sung Choi: https://orcid.org/0000-0002-7202-7777 Jae Hoon Moon: https://orcid.org/0000-0001-6327-0575 Ka Hee Yi: https://orcid.org/0000-0002-1999-9841 Min Kyung Hyun: https://orcid.org/0000-0003-0212-8633 Min Joo Kang: https://orcid.org/0000-0003-1658-3389 Jung Im Shim: https://orcid.org/0000-0003-1463-8649 Ja Youn Lee: https://orcid.org/0000-0002-0810-327X Do Joon Park: https://orcid.org/0000-0001-9630-3839 Young Joo Park: https://orcid.org/0000-0002-3671-6364
References
1) Ezzat S, Sarti DA, Cain DR, Braunstein GD. Thyroid incidentalomas. Prevalence by palpation and ultrasonography.
Arch Intern Med 1994;154(16):1838-40.
2) Brander A, Viikinkoski P, Nickels J, Kivisaari L. Thyroid gland: US screening in a random adult population. Radiology 1991;181(3):683-7.
3) Tan GH, Gharib H. Thyroid incidentalomas: management approaches to nonpalpable nodules discovered incidentally on thyroid imaging. Ann Intern Med 1997;126(3):226-31.
4) Werk EE Jr, Vernon BM, Gonzalez JJ, Ungaro PC, McCoy RC. Cancer in thyroid nodules. A community hospital survey.
Arch Intern Med 1984;144(3):474-6.
5) Papini E, Guglielmi R, Bianchini A, Crescenzi A, Taccogna S, Nardi F, et al. Risk of malignancy in nonpalpable thyroid nodules: predictive value of ultrasound and color-Doppler features. J Clin Endocrinol Metab 2002;87(5):1941-6.
6) Moumen M, Mehhane M, Kadiri B, Mawfik H, el Fares F.
Compressive goiters. Apropos of 80 cases. J Chir (Paris) 1989;
126(10):521-6.
7) Arora N, Scognamiglio T, Zhu B, Fahey TJ 3rd. Do benign thyroid nodules have malignant potential? An evidence-based review. World J Surg 2008;32(7):1237-46.
8) Haugen BR, Alexander EK, Bible KC, Doherty GM, Mandel SJ, Nikiforov YE, et al. 2015 American Thyroid Association management guidelines for adult patients with thyroid nodules and differentiated thyroid cancer: the American Thyroid Association guidelines task force on thyroid nodules and differentiated thyroid cancer. Thyroid 2016;26(1):1-133.
9) Lee KH, Lee EK, Kang HC, Ko Y, Kim SW, Kim IJ, et al. 2016 revised Korean Thyroid Association management guidelines for patients with thyroid nodules and thyroid cancer.
Int J Thyroidol 2016;9(2):59-126.
10) Quadbeck B, Pruellage J, Roggenbuck U, Hirche H, Janssen OE, Mann K, et al. Long-term follow-up of thyroid nodule growth. Exp Clin Endocrinol Diabetes 2002;110(7):348-54.
11) Erdogan MF, Gursoy A, Erdogan G. Natural course of benign thyroid nodules in a moderately iodine-deficient area. Clin Endocrinol (Oxf) 2006;65(6):767-71.
12) Delange F. The disorders induced by iodine deficiency. Thyroid 1994;4(1):107-28.
13) Yu X, Fan C, Shan Z, Teng X, Guan H, Li Y, et al. A five-year follow-up study of goiter and thyroid nodules in three regions with different iodine intakes in China. J Endocrinol Invest 2008;31(3):243-50.
14) Lim DJ, Kim JY, Baek KH, Kim MK, Park WC, Lee JM, et al. Natural course of cytologically benign thyroid nodules:
observation of ultrasonographic changes. Endocrinol Metab (Seoul) 2013;28(2):110-8.
15) Alexander EK, Hurwitz S, Heering JP, Benson CB, Frates MC, Doubilet PM, et al. Natural history of benign solid and cystic thyroid nodules. Ann Intern Med 2003;138(4):315-8.
16) Anil C, Akkurt A, Ayturk S, Kut A, Gursoy A. Impaired glucose metabolism is a risk factor for increased thyroid volume and nodule prevalence in a mild-to-moderate iodine deficient area. Metabolism 2013;62(7):970-5.
17) Ayturk S, Gursoy A, Kut A, Anil C, Nar A, Tutuncu NB.
Metabolic syndrome and its components are associated with increased thyroid volume and nodule prevalence in a mild-to- moderate iodine-deficient area. Eur J Endocrinol 2009;161(4):
599-605.
18) Blanc E, Ponce C, Brodschi D, Nepote A, Barreto A, Schnitman M, et al. Association between worse metabolic control and increased thyroid volume and nodular disease in elderly adults with metabolic syndrome. Metab Syndr Relat Disord 2015;13(5):221-6.
19) Kim JY, Moon SJ, Kim KR, Sohn CY, Oh JJ. Dietary iodine intake and urinary iodine excretion in normal Korean adults.
Yonsei Med J 1998;39(4):355-62.
20) Kim TH, Kim KW, Ahn HY, Choi HS, Won H, Choi Y, et al. Effect of seasonal changes on the transition between subclinical hypothyroid and euthyroid status. J Clin Endocrinol Metab 2013;98(8):3420-9.
21) Ito Y, Miyauchi A, Inoue H, Fukushima M, Kihara M, Higashiyama T, et al. An observational trial for papillary thyroid microcarcinoma in Japanese patients. World J Surg 2010;34(1):28-35.
22) Pedersen OM, Aardal NP, Larssen TB, Varhaug JE, Myking O, Vik-Mo H. The value of ultrasonography in predicting autoimmune thyroid disease. Thyroid 2000;10(3):251-9.
23) American Thyroid Association (ATA) Guidelines Taskforce on Thyroid Nodules and Differentiated Thyroid Cancer;
Cooper DS, Doherty GM, Haugen BR, Kloos RT, Lee SL, et al. Revised American Thyroid Association management guidelines for patients with thyroid nodules and differentiated thyroid cancer. Thyroid 2009;19(11):1167-214.
24) Rago T, Chiovato L, Aghini-Lombardi F, Grasso L, Pinchera A, Vitti P. Non-palpable thyroid nodules in a borderline iodine-sufficient area: detection by ultrasonography and follow-up. J Endocrinol Invest 2001;24(10):770-6.
25) Durante C, Costante G, Lucisano G, Bruno R, Meringolo D, Paciaroni A, et al. The natural history of benign thyroid nodules.
JAMA 2015;313(9):926-35.
26) Braverman LE, Cooper DS, Werner SC, Ingbar SH. Werner
& Ingbar's the thyroid : a fundamental and clinical text. 10th ed. Philadelphia: Wolters Kluwer/Lippincott Williams & Wilkins Health; 2013. p.224-6.
27) Medeiros-Neto G. TSH secretion and regulation in endemic goiter and endemic cretinism. Prog Clin Biol Res 1983;116:
119-30.
28) Papini E, Petrucci L, Guglielmi R, Panunzi C, Rinaldi R, Bacci V, et al. Long-term changes in nodular goiter: a 5-year prospective randomized trial of levothyroxine suppressive therapy for benign cold thyroid nodules. J Clin Endocrinol Metab 1998;83(3):780-3.
29) Hwang S, Shin DY, Kim EK, Yang WI, Byun JW, Lee SJ, et al. Focal lymphocytic thyroiditis nodules share the features of papillary thyroid cancer on ultrasound. Yonsei Med J 2015;56(5):1338-44.