The Risk for Insulin Resistance according to the Degree of Non- Alcoholic Fatty Liver Disease in Korean Men
Insulin resistance (IR) plays a significant role in the development and progression of non- alcoholic fatty liver disease (NAFLD). However, the natural course of insulin sensitivity under NAFLD remained unclear. Accordingly, this study was designed to investigate the effect of NAFLD on insulin resistance. A total of 20,628 Korean men without homeostasis model assessment of insulin resistance (HOMA-IR < 2.7) were followed-up for 5 years.
They were serially checked for HOMA-IR to monitor the development of IR (HOMA-IR
≥ 2.7). The incidence rate of IR increased according to the degree of NAFLD (normal:
11.6%, mild: 28.8%, moderate to severe: 40.5%, P < 0.001). Cox proportional hazards model showed that HRs (95% CI) for IR increased proportionally to the degree of NAFLD (mild: 1.19 [1.02-1.39], moderate to severe: 1.32 [1.08-1.57]). IR was more potentially associated with the more progressive NAFLD than normal and milder state. In addition, NAFLD was the independent risk factor of the development of IR. These results suggest the potential availability of NAFLD as a predictor of IR.
Keywords: Non-Alcoholic Fatty Liver Disease; Insulin Resistance; HOMA-IR; HOMA-β Jae-Hong Ryoo,1* Hyun Pyo Hong,2*
Sung Keun Park,3 Woo Taek Ham,4 and Ju Youn Chung5
1Department of Preventive Medicine, School of Medicine, Kyung Hee University, Seoul, Korea;
2Department of Radiology, Kangbuk Samsung Hospital, Sungkyunkwan University School of Medicine, Seoul, Korea; 3Total Healthcare Center, Kangbuk Samsung Hospital, Sungkyunkwan University School of Medicine, Seoul, Korea;
4Department of Physical Education, Graduate School, Sangji University, Wonju, Korea;
5Department of Industrial Design, Chonbuk National University, College of Arts, Jeonju, Korea
* Jae-Hong Ryoo and Hyun Pyo Hong equally contributed to this study, and should be considered as first authors.
Received: 19 May 2016 Accepted: 17 July 2016 Address for Correspondence:
Sung Keun Park, MD
Total Healthcare Center, Kangbuk Samsung Hospital, Sungkyunkwan University School of Medicine, 29 Saemunan-ro, Jongno-gu, Seoul 03181, Korea E-mail: [email protected]
http://dx.doi.org/10.3346/jkms.2016.31.11.1761 • J Korean Med Sci 2016; 31: 1761-1767
INTRODUCTION
Nonalcoholic fatty liver disease (NAFLD) is getting great con- cern in the clinical field of metabolism as well as hepatology.
Out of various metabolic diseases, cardiovascular disease, type 2 diabetes, and metabolic syndrome were known to have a strong association with NAFLD (1-3). As a pathophysiologic mechanism of theses metabolic diseases, the role of insulin re- sistance (IR) was definitely established in disease occurrence and progression (4). IR also has a pivotal role in the develop- ment of NAFLD (5,6). IR accelerates the release of free fatty acid (FFA) from adipose tissue and their influx into liver, which is one of the accepted theories for the mechanism of NAFLD (7).
However, reverse relationship between NAFLD and IR has not been clarified yet. For instance, several questions can be raised.
“What is the effect of NAFLD on the development of IR?” or
“Was insulin sensitivity actually aggravated under NAFLD with the passage of time?” Although there have been some studies that showed the effect of NAFLD on IR, they were not enough to answer these questions clearly because of their limitations
such as small sample size or cross-sectional design (8,9). Espe- cially, considering that many cases of NAFLD are diagnosed in non-diabetic and non-insulin intolerance state, it is necessary for clinical studies to investigate the effect of NAFLD on insulin sensitivity. These studies may be helpful to set the clinical gui- deline for the NAFLD patients without currently serious meta- bolic diseases related with IR. Thus, this study was conducted to examine the clinical association between NAFLD and the development of insulin resistance.
MATERIALS AND METHODS Study design
A prospective cohort study was conducted to examine the as- sociation between NAFLD and the development of IR in Kore- an men participating in a medical health check-up program at Total Healthcare Center of Kangbuk Samsung Hospital, Sung- kyunkwan University, Seoul, Korea. Interpretation for medical health check-up was described in our other manuscript in de- tail (10).
Study population
A total of 46,693 men who had examined the abdominal ultra- sonography (US) for a medical check-up at Kangbuk Samsung Total Healthcare Center in 2005 participated in this study. Among the 46,693 participants, 19,662 men were excluded based on the following exclusion criteria that might influence insulin re- sistance or ultrasonography (US) findings of the liver as a result of other liver disease. Participants with presence of IR were also excluded from initial examination. IR was evaluated by homeo- stasis model assessment of insulin resistance (HOMA-IR), and 10,949 had a baseline IR (HOMA-IR ≥ 2.7) at initial examina- tions. Because some participants had more than one exclusion criteria, the total number of men eligible for the study was 27,031.
Additionally, 6,403 participants were excluded for follow-up loss from 2006 to 2010. Accordingly, 20,628 participants were included in the final analysis and were observed for the devel- opment of insulin resistance (Fig. 1). The total follow-up period was 73,311.2 person year and average follow-up period was 3.55 (standard deviation [SD], 1.48) person year.
Clinical and laboratory measurements
Study data included a medical history, a physical examination, information provided by a questionnaire, anthropometric mea- surements and laboratory measurements. All medical histories including drug prescription were assessed by examining physi- cians. All participants were asked to respond to a questionnaire on health-related behavior. Questions about alcohol intake in- cluded the frequency of alcohol consumption per week and the usual amount per day (≥ 20 g/day). We considered persons re- porting that they smoked at that time to be current smokers. In addition, the participants were asked about their weekly fre-
quency of physical activity, such as jogging, bicycling, and swim- ming that lasted long enough to produce perspiration (≥ 1 time/
week).
Diabetes mellitus was defined as fasting serum glucose high- er than 126 mg/dL or current medication of blood glucose-low- ering agents. Hypertension was defined as the current medica- tion of antihypertensive drug or blood pressure (BP) ≥ 140/90 mmHg at initial examinations.
HOMA-IR was calculated by (fasting serum insulin [μU/mL]
× fasting serum glucose [mmol/L])/22.5 (11). The development of IR was assessed from the annual records of all participants, and defined as HOMA-IR value ≥ 2.7 by referring previous stu- dies (10,12,13). The procedures for anthropometric and bioche- mical measurements from blood samples were described in detail elsewhere (10).
The diagnosis of fatty liver and its degree were based on the results of abdominal US with a 3.5-MHz transducer (Logic Q700 MR, GE, Milwaukee, WI, USA). Abdominal US were carried out by eleven experienced radiologists who were unaware of the aims of the study and blind to the laboratory values. Images were captured in a standard fashion, with the patient in the supine position, with the right arm raised above the head.
The methodology of ultrasonographically diagnosing liver disease was previously described in our other study (14).
The criteria of chronic liver disease are as follows (15,16):
Findings meet one of following criteria.
1) Coarse or highly non-homogenous liver parenchymal echotexture
2) Irregular or nodular liver surface (inferior margin of right lobe)
3) Blunted or rounded liver edge
4) Enlarged liver size (> 15 cm in mid-clavicular line) or shrun- ken liver size (< 10 cm in mid-clavicular line)
5) Enlarged spleen size (> 13 cm)
The degree of hepatic fatty infiltration was evaluated by quan- titative grading system conventionally used in radiologic field (17-19) as follows:
Normal (grade 0): Hepatic parenchymal echogenicity is usu- ally equal to that of the renal cortex.
Mild fatty liver (grade 1): diffuse slight increase in fine echoes in the hepatic parenchyma with normal visualization of the dia- phragm and intrahepatic vessel borders.
Moderate fatty liver (grade 2): moderate diffuse increase in fine echoes with slightly impaired visualization of the intrahe- patic vessels and diaphragm.
Severe fatty liver (grade 3): marked increase in fine echoes with poor or no visualization of the intrahepatic vessel borders, diaphragm and posterior portion of the right lobe of the liver.
To assess the intra- and inter-observer reliability of ultrasound diagnosis of fatty liver, a random sample of 200 stored ultraso- nographic images was re-read at least two weeks apart by the Fig. 1. Flow chart of enrolled study population.
Initial participants screened in 2005 (n = 46,693)
Initial cohort in 2005 (n = 27,031)
Final sample size (n = 20,628)
Exclusion criteria in 2005 (n = 19,662) Baseline insulin resistance
(HOMA-IR > 2.7) (n = 10,949) Baseline diabetes mellitus (n = 2,288) Past history of malignancy (n = 238) Alcohol intake ≥ 20 g/week (n = 6,369) γ-glutamyltransferase > 100 (n = 2,922) Alanine aminotransferase > 100 (n = 651) HBV + HCV serologic marker positive (n = 2,295) Chronic liver disease (n = 553) Past history of cardiovascular disease (n = 322) No information of insulin resistance (n = 622)
Follow-up loss between 2006 and 2010 (n = 6,403)
eleven radiologists. All radiologists were blinded to clinical in- formation. The inter-observer reliability and intra-observer reli- ability for fatty liver diagnosis were substantial (kappa static of 0.74) and excellent (kappa static of 0.94), respectively.
The presence of metabolic syndrome (MetS) was made ac- cording to the joint interim statement of the International Dia- betes Federation Task Force on Epidemiology and Prevention (20). Waist circumference (WC) change was calculated as fol- lows: WC change = (WC at censoring time-WC at baseline)/fol- low-up period (person year).
Statistical analysis
Data were expressed as means (standard deviation) or medians (interquartile range) for continuous variables and percentages of the number for categorical variables.
The one-way ANOVA and χ2-test were used to analyze the
statistical differences among the characteristics of the study participants at the time of enrollment in relation to the NAFLD categories. Categories of the NAFLD comprised the following:
normal, mild, moderate and severe. Moderate (n = 533, 2.58%) and severe NAFLD (n = 6, 0.03%) was combined into moderate to severe NAFLD category for analyses, owing to the small num- ber of severe NAFLD. The distributions of continuous variables were evaluated, and log transformations were used in the anal- ysis as required. For incident insulin resistance cases, the time of insulin resistance occurrence was assumed to be the mid- point between the visit at which insulin resistance was first di- agnosed and the baseline visit (2005). The person years were calculated as the sum of follow-up times from the baseline until an assumed time of insulin resistance development or until the final examination of each individual. We used Cox proportional hazards models to estimate adjusted hazard ratios (HRs) and Table 1. Baseline characteristics of participants according to NAFLD categories (n = 20,628)
Characteristics Overall
NAFLD Normal
(n = 14,758) Mild
(n = 5,331) Moderate to severe
(n = 539) P for trend*
Total, person-year 73,311.2 53,976.9 17,654.1 1,680.2 -
Average, person-year 3.55 (1.48) 3.66 (1.43) 3.31 (1.55) 3.12 (1.57) < 0.001
Age, yr 42.7 (7.2) 42.6 (7.3) 43.1 (7.0) 41.7 (6.2) 0.007
WC, cm 82.3 (7.0) 80.7 (6.6) 86.4 (6.0) 90.0 (6.5) < 0.001
WC change during follow-up, cm 0.19 (−0.80-1.23) 0.26 (−0.70-1.24) 0.05 (−1.07-1.20) −0.32 (−1.52-1.01) 0.530
BMI, kg/m2 23.7 (2.5) 23.1 (2.3) 25.2 (2.1) 26.7 (2.3) < 0.001
Systolic BP, mmHg 113.2 (13.5) 112.3 (13.4) 115.3 (13.5) 118.2 (14.0) < 0.001
Diastolic BP, mmHg 76.3 (9.1) 75.6 (9.0) 78.0 (9.3) 78.6 (9.3) < 0.001
Total cholesterol, mg/dL 191.9 (31.5) 187.8 (30.5) 201.7 (31.6) 205.2 (32.4) < 0.001
Triglyceride, mg/dL 116 (85-161) 105 (79-142) 150 (111-203) 169 (126-229) < 0.001
HDL-cholesterol, mg/dL 50.3 (10.1) 51.7 (10.4) 46.9 (8.4) 45.1 (7.4) < 0.001
LDL-cholesterol, mg/dL 113.3 (26.5) 110.0 (25.7) 121.3 (26.7) 124.4 (27.2) < 0.001
Fasting serum glucose, mg/dL 94.1 (7.6) 93.6 (7.5) 95.1 (7.7) 95.6 (8.2) < 0.001
HOMA-IR 1.74 (1.39-2.11) 1.64 (1.32-2.00) 1.98 (1.63-2.31) 2.15 (1.81-2.44) < 0.001
Insulin, μU/mL 7.5 (2.0) 7.2 (1.9) 8.3 (1.9) 8.9 (1.8) < 0.001
Serum creatinine, mg/dL 1.13 (0.15) 1.12 (0.17) 1.14 (0.10) 1.14 (0.10) 0.005
eGFR, mL/min per 1.73 m2 80.5 (10.0) 81.0 (10.3) 79.3 (9.7) 79.6 (9.5) 0.001
AST, U/L 22 (19-27) 22 (19-25) 24 (21-29) 30 (25-36) < 0.001
ALT, U/L 23 (18-30) 21 (16-26) 30 (23-39) 46 (34-61) < 0.001
GGT, U/L 25 (18-38) 22 (16-33) 33 (23-47) 40 (29-58) < 0.001
MetS, % 8.7 5.2 17.6 25.2 < 0.001
Blood pressure ≥ 130/85 mmHg, % 22.7 20.1 28.8 34.3 < 0.001
Fasting serum glucose ≥ 100 mg/dL, % 21.5 19.7 26.0 26.0 < 0.001
Triglyceride ≥ 150 mg/dL, % 30.1 21.8 50.1 59.7 < 0.001
HDL-cholesterol < 40 mg/dL, % 12.8 10.2 18.9 23.2 < 0.001
WC ≥ 90 cm, % 13.7 8.1 27.9 44.4 < 0.001
Family history of diabetes, % 29.0 27.1 33.1 35.7 < 0.001
Antihypertensive medication, % 4.5 3.9 6.0 6.3 < 0.001
Medication for lipid-lowering agents, % 5.4 3.8 9.1 11.5 < 0.001
Current smoker, % 39.5 39.0 40.8 39.7 0.042
Regular exercise, % 16.0 17.3 13.2 8.8 < 0.001
Hypertension, % 14.3 12.4 18.9 21.5 < 0.001
Development of insulin resistance, % 16.8 11.6 28.8 40.5 < 0.001
Data are means (standard deviation), medians (interquartile range), or percentages.
NAFLD = non-alcoholic fatty liver disease.
*P value by ANOVA-test for continuous variables and χ2 test for categorical variables.
95% confidence intervals (CI) for incident insulin resistance comparing the mild and moderate to severe NAFLD categories vs. the normal group. In the multivariate models, we included variables that might confound the relationship between NAFLD and insulin resistance, which include age, WC, WC change dur- ing follow-up, LDL-cholesterol, eGFR, baseline HOMA-IR, anti- hypertensive medication, medication for lipid-lowering agents, MetS, individual MetS components, family history of diabetes, recent smoking status, proper exercise and hypertension.
For the linear trends of risk, the number of NAFLD categories was used as a continuous variable and tested on each model.
To use the Cox proportional hazards models, we checked the validity of the proportional hazards assumption. The assump- tion was assessed by log-minus-log-survival function and found to be graphically unviolated. P values < 0.05 were considered to be statistically significant. Statistical analyses were performed PASW Statistics 18 (SPSS Inc., Chicago, IL, USA).
Ethics statement
This cohort study was approved by the international review board of Kangbuk Samsung Hospital (Seoul, Korea) (IRB num- ber: KBC13141). The informed consent requirement was ex- empted because we only retrospectively accessed a de-identi- fied database for analytical purposes.
RESULTS
During 73,311.2 person-years of follow-up, 3,471 (16.8%) inci- dent cases of IR developed between 2006 and 2010.
Compared with analytic cohort (n = 20,628), 6,403 partici- pants not included in analytic cohort were 2.6 years older (45.3 vs. 42.7), and had a less favorable baseline clinical characteristic in systolic and diastolic BP, fasting serum glucose, insulin, eGFR, GGT, MetS, BP ≥ 130/85 mmHg, fasting serum glucose ≥ 100 mg/dL, WC ≥ 90 cm, antihypertensive medication, current smoking status, proper exercise and hypertension (Supplemen- tary Table 1).
The baseline characteristics of the study participants in rela- tion to the NAFLD categories are presented in Table 1. At base- line, the mean (SD) age, WC and BMI of study participants were 42.7 (7.2) years, 82.3 (7.0) and 23.7 (2.5) kg/m2, respectively. There were clear dose response relationships between all of the listed variables and NAFLD categories except for WC change during follow-up.
In contrast to participants without incident IR, those with in- cident IR were slightly older (43.8 vs. 42.5) and more likely to have the NAFLD. As expected, all clinical variables showed sta- tistically significant differences between two groups except for current smoking status (Supplementary Table 2).
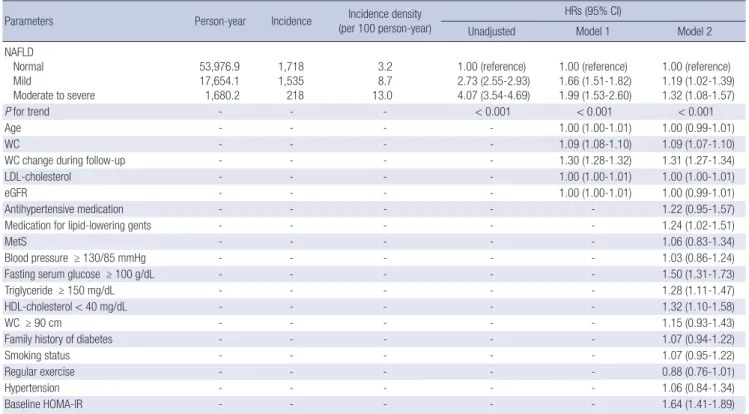
Table 2 shows the HRs and 95% CI for IR (HOMA-IR ≥ 2.7)
Table 2. Hazard ratios (HRs) and 95% confidence intervals (CI) for the incidence of insulin resistance according to NAFLD categories (insulin resistance: HOMA-IR ≥ 2.7)
Parameters Person-year Incidence Incidence density
(per 100 person-year)
HRs (95% CI)
Unadjusted Model 1 Model 2
NAFLD Normal Mild
Moderate to severe
53,976.9 17,654.1 1,680.2
1,718 1,535 218
3.2 8.7 13.0
1.00 (reference) 2.73 (2.55-2.93) 4.07 (3.54-4.69)
1.00 (reference) 1.66 (1.51-1.82) 1.99 (1.53-2.60)
1.00 (reference) 1.19 (1.02-1.39) 1.32 (1.08-1.57)
P for trend - - - < 0.001 < 0.001 < 0.001
Age - - - - 1.00 (1.00-1.01) 1.00 (0.99-1.01)
WC - - - - 1.09 (1.08-1.10) 1.09 (1.07-1.10)
WC change during follow-up - - - - 1.30 (1.28-1.32) 1.31 (1.27-1.34)
LDL-cholesterol - - - - 1.00 (1.00-1.01) 1.00 (1.00-1.01)
eGFR - - - - 1.00 (1.00-1.01) 1.00 (0.99-1.01)
Antihypertensive medication - - - - - 1.22 (0.95-1.57)
Medication for lipid-lowering gents - - - - - 1.24 (1.02-1.51)
MetS - - - - - 1.06 (0.83-1.34)
Blood pressure ≥ 130/85 mmHg - - - - - 1.03 (0.86-1.24)
Fasting serum glucose ≥ 100 g/dL - - - - - 1.50 (1.31-1.73)
Triglyceride ≥ 150 mg/dL - - - - - 1.28 (1.11-1.47)
HDL-cholesterol < 40 mg/dL - - - - - 1.32 (1.10-1.58)
WC ≥ 90 cm - - - - - 1.15 (0.93-1.43)
Family history of diabetes - - - - - 1.07 (0.94-1.22)
Smoking status - - - - - 1.07 (0.95-1.22)
Regular exercise - - - - - 0.88 (0.76-1.01)
Hypertension - - - - - 1.06 (0.84-1.34)
Baseline HOMA-IR - - - - - 1.64 (1.41-1.89)
Model 1 was adjusted for age, WC, WC change during follow-up, LDL-cholesterol and eGFR; Model 2 was adjusted for model 1 plus baseline HOMA-IR, antihypertensive medi- cation, medication for lipid-lowering agents, MetS, individual MetS components, family history of diabetes, recent smoking status, regular exercise and hypertension.
NAFLD = non-alcoholic fatty liver disease.
according to the NAFLD categories. In unadjusted model, when HRs of normal group for IR was set as reference, HRs of NAFLD groups increased according to the degree of NAFLD (mild group:
2.73 [2.55-2.93] and moderate to severe group: 4.07 [3.54-4.69]) (P for trend < 0.001). These associations were attenuated, but still remained statistically significant, even after further adjust- ing for covariates in model 1 and 2. In model 2, the adjusted HRs and 95% CI for IR were 1.19 (1.02-1.39) and 1.32 (1.08-1.57), re- spectively (P for trend < 0.001).
DISCUSSION
Our study showed a strong association between the degree of NAFLD and the subsequent development of IR. In addition, this association was independent of other metabolic conditions such as age, WC, WC change during follow-up, LDL-cholester- ol, eGFR, antihypertensive medication, medication for lipid- lowering agents, MetS, individual MetS components, family history of diabetes, recent smoking status, proper exercise and hypertension. These findings are the most noticeable points of the study corresponding to our study aim. This study was de- signed to investigate the effect of NAFLD on insulin sensitivity, in the background that these studies must be helpful to research the prognosis of NAFLD. As mentioned above, there have been studies to show the clinical associations between NAFLD and various metabolic diseases such as type 2 diabetes, cardiovas- cular diseases, and MetS (1-3). We also found that the risk of type 2 diabetes independently increase under NAFLD in previ- ous study (21). In that study, incidence rate and HRs of type 2 diabetes were significantly associated with the degree of NAFLD.
Nevertheless, it is not easy to suggest the definite etiologic mech- anisms for these associations. Although IR has been demon- strated as one of significant mechanisms, the theory for the ef- fect of NAFLD on IR was not fully established yet. Accordingly, our study findings may be helpful to understand the pathophys- iologic mechanism of metabolic diseases related to NAFLD. In this sense, our study suggests that NAFLD can be the cause of metabolic diseases over simple comorbidity.
There were several studies that showed the effect of NAFLD on IR. Sinn et al. (8) showed the significant association between NAFLD and IR. Their study demonstrated that NAFLD could be an independent predictor for identifying patients with IR in non-obese, non-diabetic, middle-aged Asian adults (8). In ad- dition, Musso et al. (9) reported that NAFLD had the better di- agnostic accuracy for IR than MetS did in 197 non-diabetic, non-obese Caucasians. Nevertheless, both studies were not enough to show the causal relation between NAFLD and IR, because of their limitations such as cross-sectional design or small sample size. However, our study was so large scale pro- spective cohort study with 20,628 participants as to be better for elucidating the association between NAFLD and IR.
As mechanisms of our findings, we can suggest some theo- ries concerning the effects of NAFLD on glucose metabolism.
NAFLD is characterized as the histologic findings of damaged hepatocyte resembling alcoholic hepatitis, fibrosis, and fat infil- tration (5,22). Especially, fatty liver infiltration and hepatocyte injury are main features of NAFLD, which can disturb the he- patic glucose metabolism and insulin clearance. Impaired he- patic glucose metabolism and insulin clearance are likely to lead the hyperglycemia and hyperinsulinemia (7). As well known, hyperglycemia and hyperinsulinemia are directly related to IR as main features.
Another is the “lipotoxic” hypothesis. The influx of free fatty acid from the excessive adipose tissue to the peripheral tissues would induce the IR especially, when they infiltrate into liver (7,23). In short, while IR is predominant cause of NAFLD, de- veloped NAFLD can reversely aggravate IR.
Physical inactivity should be considered as one of major cau- ses for accentuated IR. Our study showed that the rate of regu- lar exercise was inversely related to the degree of NAFLD. This finding agrees well with previous finding that physical inactivity increases the intrahepatic fat content (24). Accordingly, decrea- sed physical activity which induced baseline NAFLD might con- tribute to the development of IR.
When interpreting our results, some limitations should be considered. First, the presence of NAFLD was assessed by US instead of pathologic method. Although US is regarded reason- able and accurate, it cannot identify fatty infiltration of the liver below the threshold of 30% (25). Therefore, there is possibility of discrepancy between ultrasonographic finding and real NA- FLD. However, it was inappropriate to perform invasive test in a population-based epidemiological study (26). In addition, US is a widely used and acceptable modality for diagnosis of NAFLD with high sensitivity (82%-94%) and specificity (66%-95%) (27,28).
Most of all, all examinations were carried out by experienced radiologists using widely established methods and criteria. Thus, despite of this limitation, US might be more clinically reason- able modality to diagnose NAFLD in this study.
Second, our study population was only limited to Korean men.
Thus, the results of this study cannot be necessarily extrapolated to women and other ethnic groups and further studies are needed.
Third is the controversy as to the clinical acceptability for cut off value of IR. In this study, we adopted HOMA-IR ≥ 2.7 into indicator of IR. Although HOMA-IR has been widely used as re- liable indicator of IR, the definite cut off value is in debate. Addi- tionally, several studies for Asians adopted cut-offs less than our cut-off in defining insulin resistance (29,30). However, HOMA- IR was accepted as a reproducible and reliable tool in the as- sessment of IR alternative to glucose clamp or other sophisti- cated techniques in epidemiologic settings (31). Several studies also demonstrated the clinical adequacy of HOMA-IR ≥ 2.7 as a marker of IR (10,12,13). Accordingly, considering the predictive
role of HOMA-IR, it is probable that NAFLD affected the devel- opment of IR. Additionally, since we were concerned about the impending risk for insulin resistance in study population with HOMA-IR a bit less than 2.7, we included baseline HOMA-IR in adjusting covariates. We could see the maintained statistical significance even after adjusting for baseline HOM-IR, which suggests the clinical significance of our cut-off, HOMA-IR ≥ 2.7 in determining insulin resistance. Nonetheless, we recognize that the debate for cut-off of HOMA-IR attenuates the general- izability of our finding.
In conclusion, our findings, which were obtained from a large cohort, showed that insulin sensitivity was more potentially ag- gravated under NAFLD. In addition, the risk of IR increased ac- cording to the degree of NAFLD independent of other metabol- ic conditions. Considering the effect of IR on metabolic diseas- es, our study may be helpful to understand the clinical associa- tion between NAFLD and metabolic diseases.
ACKNOWLEDGMENT
This study was based on medical data collected and arranged by Kangbuk Samsung Cohort Study (KSCS). Therefore, this study could be done by virtue of the labor of all staffs working in KSCS.
Especially, we highly appreciate two staffs working in the gas- troenterology division of Kangbuk Samsung Total Healthcare center (Hee Seon Kim and Yun Young Lee). Their technological and statistical assistance largely contributed in making our study.
DISCLOSURE
The authors have no potential conflicts of interest to disclose.
AUTHOR CONTRIBUTION
Study design and coordination: Park SK. Data acquisition: Ryoo JH, Hong HP. Writing the manuscript: Ryoo JH, Hong HP. Data interpretation: Park SK. Reviewing and editing manuscript: Park SK, Ham WT, Chung JY. Final approval of manuscript: all authors.
ORCID
Jae-Hong Ryoo http://orcid.org/0000-0002-5232-1426 Hyun Pyo Hong http://orcid.org/0000-0003-1451-3141 Sung Keun Park http://orcid.org/0000-0003-4703-9917 Woo Taek Ham http://orcid.org/0000-0003-3212-1627
REFERENCES
1. Ruhl CE, Everhart JE. Determinants of the association of overweight with elevated serum alanine aminotransferase activity in the United States.
Gastroenterology 2003; 124: 71-9.
2. Pagano G, Pacini G, Musso G, Gambino R, Mecca F, Depetris N, Cassader M, David E, Cavallo-Perin P, Rizzetto M. Nonalcoholic steatohepatitis, in- sulin resistance, and metabolic syndrome: further evidence for an etio- logic association. Hepatology 2002; 35: 367-72.
3. Sanyal AJ, Campbell-Sargent C, Mirshahi F, Rizzo WB, Contos MJ, Sterling RK, Luketic VA, Shiffman ML, Clore JN. Nonalcoholic steatohepatitis: as- sociation of insulin resistance and mitochondrial abnormalities. Gastro- enterology 2001; 120: 1183-92.
4. Grundy SM, Cleeman JI, Daniels SR, Donato KA, Eckel RH, Franklin BA, Gordon DJ, Krauss RM, Savage PJ, Smith SC Jr, et al. Diagnosis and man- agement of the metabolic syndrome: an American Heart Association/
National Heart, Lung, and Blood Institute scientific statement. Circula- tion 2005; 112: 2735-52.
5. Angulo P. Nonalcoholic fatty liver disease. N Engl J Med 2002; 346: 1221- 31.
6. Salamone F, Bugianesi E. Nonalcoholic fatty liver disease: the hepatic trig- ger of the metabolic syndrome. J Hepatol 2010; 53: 1146-7.
7. Lewis GF, Carpentier A, Adeli K, Giacca A. Disordered fat storage and mo- bilization in the pathogenesis of insulin resistance and type 2 diabetes.
Endocr Rev 2002; 23: 201-29.
8. Sinn DH, Gwak GY, Park HN, Kim JE, Min YW, Kim KM, Kim YJ, Choi MS, Lee JH, Koh KC, et al. Ultrasonographically detected non-alcoholic fatty liver disease is an independent predictor for identifying patients with in- sulin resistance in non-obese, non-diabetic middle-aged Asian adults.
Am J Gastroenterol 2012; 107: 561-7.
9. Musso G, Gambino R, Bo S, Uberti B, Biroli G, Pagano G, Cassader M.
Should nonalcoholic fatty liver disease be included in the definition of metabolic syndrome? A cross-sectional comparison with Adult treat- ment panel III criteria in nonobese nondiabetic subjects. Diabetes Care 2008; 31: 562-8.
10. Park SK, Choi WJ, Oh CM, Kim MG, Ham WT, Choi JM, Ryoo JH. Clinical significance of serum ferritin level as an independent predictor of insulin resistance in Korean men. Diabetes Res Clin Pract 2015; 107: 187-93.
11. Matthews DR, Hosker JP, Rudenski AS, Naylor BA, Treacher DF, Turner RC. Homeostasis model assessment: insulin resistance and beta-cell func- tion from fasting plasma glucose and insulin concentrations in man. Dia- betologia 1985; 28: 412-9.
12. Geloneze B, Vasques AC, Stabe CF, Pareja JC, Rosado LE, Queiroz EC, Tambascia MA; BRAMS Investigators. HOMA1-IR and HOMA2-IR in- dexes in identifying insulin resistance and metabolic syndrome: Brazilian Metabolic Syndrome Study (BRAMS). Arq Bras Endocrinol Metabol 2009;
53: 281-7.
13. Topsakal S, Yerlikaya E, Akin F, Kaptanoglu B, Erürker T. Relation with HOMA-IR and thyroid hormones in obese Turkish women with meta- bolic syndrome. Eat Weight Disord 2012; 17: e57-61.
14. Park SK, Ryoo JH, Choi JM, Seo MW, Park CM. The risk of abdominal obe- sity according to the degree of non-alcoholic fatty liver disease in Korean men. J Korean Med Sci 2016; 31: 410-6.
15. Nishiura T, Watanabe H, Ito M, Matsuoka Y, Yano K, Daikoku M, Yatsu- hashi H, Dohmen K, Ishibashi H. Ultrasound evaluation of the fibrosis stage in chronic liver disease by the simultaneous use of low and high frequency probes. Br J Radiol 2005; 78: 189-97.
16. Hung CH, Lu SN, Wang JH, Lee CM, Chen TM, Tung HD, Chen CH, Huang WS, Changchien CS. Correlation between ultrasonographic and patho- logic diagnoses of hepatitis B and C virus-related cirrhosis. J Gastroenter-
ol 2003; 38: 153-7.
17. Saadeh S, Younossi ZM, Remer EM, Gramlich T, Ong JP, Hurley M, Mul- len KD, Cooper JN, Sheridan MJ. The utility of radiological imaging in non- alcoholic fatty liver disease. Gastroenterology 2002; 123: 745-50.
18. Mottin CC, Moretto M, Padoin AV, Swarowsky AM, Toneto MG, Glock L, Repetto G. The role of ultrasound in the diagnosis of hepatic steatosis in morbidly obese patients. Obes Surg 2004; 14: 635-7.
19. Hernaez R, Lazo M, Bonekamp S, Kamel I, Brancati FL, Guallar E, Clark JM. Diagnostic accuracy and reliability of ultrasonography for the detec- tion of fatty liver: a meta-analysis. Hepatology 2011; 54: 1082-90.
20. Alberti KG, Eckel RH, Grundy SM, Zimmet PZ, Cleeman JI, Donato KA, Fruchart JC, James WP, Loria CM, Smith SC Jr, et al. Harmonizing the met- abolic syndrome: a joint interim statement of the International Diabetes Federation Task Force on Epidemiology and Prevention; National Heart, Lung, and Blood Institute; American Heart Association; World Heart Fed- eration; International Atherosclerosis Society; and International Associa- tion for the Study of Obesity. Circulation 2009; 120: 1640-5.
21. Park SK, Seo MH, Shin HC, Ryoo JH. Clinical availability of nonalcoholic fatty liver disease as an early predictor of type 2 diabetes mellitus in Ko- rean men: 5-year prospective cohort study. Hepatology 2013; 57: 1378- 83.
22. Neuschwander-Tetri BA, Caldwell SH. Nonalcoholic steatohepatitis: sum- mary of an AASLD single topic conference. Hepatology 2003; 37: 1202-19.
23. Tushuizen ME, Bunck MC, Pouwels PJ, Bontemps S, van Waesberghe JH, Schindhelm RK, Mari A, Heine RJ, Diamant M. Pancreatic fat content and beta-cell function in men with and without type 2 diabetes. Diabetes Care 2007; 30: 2916-21.
24. Perseghin G, Lattuada G, De Cobelli F, Ragogna F, Ntali G, Esposito A, Bel-
loni E, Canu T, Terruzzi I, Scifo P, et al. Habitual physical activity is associ- ated with intrahepatic fat content in humans. Diabetes Care 2007; 30:
683-8.
25. Bedogni G, Miglioli L, Masutti F, Tiribelli C, Marchesini G, Bellentani S.
Prevalence of and risk factors for nonalcoholic fatty liver disease: the Dio- nysos nutrition and liver study. Hepatology 2005; 42: 44-52.
26. Joy D, Thava VR, Scott BB. Diagnosis of fatty liver disease: is biopsy neces- sary? Eur J Gastroenterol Hepatol 2003; 15: 539-43.
27. Mathiesen UL, Franzén LE, Aselius H, Resjö M, Jacobsson L, Foberg U, Frydén A, Bodemar G. Increased liver echogenicity at ultrasound exami- nation reflects degree of steatosis but not of fibrosis in asymptomatic pa- tients with mild/moderate abnormalities of liver transaminases. Dig Liv- er Dis 2002; 34: 516-22.
28. Graif M, Yanuka M, Baraz M, Blank A, Moshkovitz M, Kessler A, Gilat T, Weiss J, Walach E, Amazeen P, et al. Quantitative estimation of attenua- tion in ultrasound video images: correlation with histology in diffuse liver disease. Invest Radiol 2000; 35: 319-24.
29. Ryu S, Sung KC, Chang Y, Lee WY, Rhee EJ. Spectrum of insulin sensitivity in the Korean population. Metabolism 2005; 54: 1644-51.
30. Lee S, Choi S, Kim HJ, Chung YS, Lee KW, Lee HC, Huh KB, Kim DJ. Cut- off values of surrogate measures of insulin resistance for metabolic syn- drome in Korean non-diabetic adults. J Korean Med Sci 2006; 21: 695- 700.
31. Bonora E, Formentini G, Calcaterra F, Lombardi S, Marini F, Zenari L, Sag- giani F, Poli M, Perbellini S, Raffaelli A, et al. HOMA-estimated insulin re- sistance is an independent predictor of cardiovascular disease in type 2 diabetic subjects: prospective data from the Verona diabetes complica- tions study. Diabetes Care 2002; 25: 1135-41.
Supplementary Table 1. Comparison between exclusion from analysis and inclusion in analysis
Characteristics
Exclusion from analysis
(n = 6,403)
Inclusion in analysis
(n = 20,628) P value*
Age, yr 45.3 (10.2) 42.7 (7.2) < 0.001
WC, cm 82.5 (7.3) 82.3 (7.0) 0.208
BMI, kg/m2 23.7 (2.6) 23.7 (2.5) 0.943
Systolic BP, mmHg 114.4 (14.4) 113.3 (13.5) < 0.001 Diastolic BP, mmHg 77.2 (9.4) 76.3 (9.1) < 0.001 Total cholesterol, mg/dL 192.5 (32.2) 191.9 (31.5) 0.211 Triglyceride, mg/dL 132.6 (75.1) 133.0 (72.3) 0.670 HDL-cholesterol, mg/dL 50.5 (10.1) 50.3 (10.1) 0.144 LDL-cholesterol, mg/dL 113.8 (27.1) 113.3 (26.5) 0.165 Fasting serum glucose, mg/dL 94.5 (8.1) 94.1 (7.6) < 0.001
HOMA-IR 1.74 (0.48) 1.75 (0.47) 0.163
Insulin, μU/mL 7.5 (2.0) 7.6 (2.0) 0.004
Serum creatinine, mg/dL 1.13 (0.15) 1.13 (0.15) 0.421 eGFR, mL/min per 1.73 m2 79.3 (10.6) 80.5 (10.0) < 0.001
AST, U/L 23.7 (7.8) 23.5 (7.0) 0.058
ALT, U/L 25.6 (12.4) 25.8 (12.6) 0.253
GGT, U/L 29.8 (17.9) 30.3 (17.8) 0.043
MetS, % 10.9 8.7 < 0.001
Blood pressure ≥ 130/85 mmHg, % 27.2 22.7 < 0.001 Fasting serum glucose ≥ 100 mg/dL, % 24.2 21.5 < 0.001
Triglyceride ≥ 150 mg/dL, % 30.4 30.1 0.664
HDL-cholesterol < 40 mg/dL, % 12.5 12.8 0.559
WC ≥ 90 cm, % 15.8 13.7 < 0.001
Family history of diabetes, % 29.1 29.0 0.918
Antihypertensive medication, % 6.1 4.5 < 0.001
Medication for lipid-lowering agents, % 5.3 5.4 0.811
Current smoker, % 41.3 39.5 0.011
Regular exercise, % 18.0 16.0 < 0.001
Hypertension, % 18.6 14.3 < 0.001
Data are expressed as means (standard deviation) or percentages.
*P value by t-test for continuous variables and χ2 test for categorical variables.
Supplementary Table 2. Comparison between participants with and without incident insulin resistance
Characteristics
Without inci- dent insulin resistance (n = 17,157)
With incident insulin resis-
tance (n = 3,471)
P value*
Age, yr 42.5 (7.3) 43.8 (6.9) < 0.001
WC, cm 81.5 (6.8) 85.5 (6.6) < 0.001
BMI, kg/m2 23.5 (2.4) 25.0 (2.4) < 0.001
Systolic BP, mmHg 112.8 (13.3) 115.3 (14.4) < 0.001 Diastolic BP, mmHg 75.9 (9.0) 78.2 (9.6) < 0.001 Total cholesterol, mg/dL 190.5 (31.2) 198.5 (31.9) < 0.001 Triglyceride, mg/dL 128.0 (68.6) 158.0 (83.7) < 0.001 HDL-cholesterol, mg/dL 50.8 (10.3) 47.7 (9.0) < 0.001 LDL-cholesterol, mg/dL 112.2 (26.3) 118.6 (27.0) < 0.001 Fasting serum glucose, mg/dL 93.6 (7.4) 96.4 (8.2) < 0.001
HOMA-IR 1.70 (0.46) 2.01 (0.43) < 0.001
Insulin, μU/mL 7.4 (1.9) 8.5 (1.8) < 0.001
Serum creatinine, mg/dL 1.13 (0.16) 1.14 (0.12) < 0.001 eGFR, mL/min per 1.73 m2 80.8 (9.9) 79.0 (9.9) < 0.001
AST, U/L 23.2 (6.8) 25.2 (8.0) < 0.001
ALT, U/L 24.8 (11.7) 31.2 (15.1) < 0.001
GGT, U/L 28.9 (17.0) 37.0 (19.9) < 0.001
MetS, % 6.4 17.1 < 0.001
Blood pressure ≥ 130/85 mmHg, % 21.3 29.9 < 0.001 Fasting serum glucose ≥ 100 mg/dL, % 19.2 32.8 < 0.001
Triglyceride ≥ 150 mg/dL, % 27.2 44.1 < 0.001
HDL-cholesterol < 40 mg/dL, % 11.7 18.1 < 0.001
WC ≥ 90 cm, % 10.8 24.5 < 0.001
Family history of diabetes, % 28.5 30.9 0.050
Antihypertensive medication, % 3.9 7.5 < 0.001
Medication for lipid-lowering agents, % 4.6 9.3 < 0.001
Current smoker, % 39.4 39.9 0.583
Regular exercise, % 15.7 17.6 0.006
Hypertension, % 13.1 20.3 < 0.001
NAFLD Normal, % Mild, %
Moderate to severe, %
76.0 22.1 1.9
49.5 44.2 6.3
< 0.001
Data are expressed as means (standard deviation) or percentages.
*P value by t-test for continuous variables and χ2 test for categorical variables.