Vol. 69, No. 6, June 2019, pp. 596∼600 http://dx.doi.org/10.3938/NPSM.69.596
X-ray Photoemission Spectroscopy Study of the Metal-Insulator Transition in Ni(S,Se)
2Jinwon Jeong · Da-Hee Jeong · Han-Jin Noh
∗Department of Physics, Chonnam National University, Gwangju 61186, Korea (Received 22 April 2019 : revised 14 May 2019 : accepted 21 May 2019)
The electronic structure of pyrite NiS2−xSexhas been studied for various Se compositions (x) by using X-ray photoemission spectroscopy (XPS). The Ni 2p XPS spectra show a weak dependence on x in the spectral weight ratio of the satellite to the main peak and in the main-to-satellite peak distance, but they show a noticeable difference in the asymmetry of the 2p3/2 main peaks. This result indicates that the key electronic structure parameters hardly vary across the metal-insulator transition, but that the screening strengths of the conduction electrons do change much. This apparent contradiction can be reconciled with the percolation scenario proposed in our previous X-ray absorption study.
PACS numbers: 71.30.+h, 72.80.Ga, 79.60.-i
Keywords: Metal-insulator transition, Conductivity, X-ray photoemission spectroscopy, Percolation
I. Introduction
The microscopic origin of the metal-insulator transi- tion (MIT) in nickel dichalcogenide Ni(S,Se)2with pyrite structure is a long standing issue in condensed matter physics [1–3]. At the beginning, NiS2−xSexwas regarded as a prototypical band-width controlled system. Se sub- stitution (x) in S-site of NiS2seems to induce an increase of bands width through enhanced overlapping between Ni 3d and ligand p orbitals. It also decreases the charge transfer energies from ligand p to Ni 3d states. In view of the Zaanen-Sawatzky-Allen (ZSA) scheme, these changes are expected to drive a gap closing of the charge transfer insulator NiS2 [4]. One noticeable feature here is that this solid-solution does not show a first-order structural distortion so nothing hinders isolating the correlation ef- fects in the MIT [2,5].
Apparently this issue looks simple and clean, but there are several subtle and complicated problems. While 70∼300 MeV activation energy in insulating NiS2 has been reported in the transport or optical measurements
∗E-mail: [email protected]
[6,7], a clear Fermi edge always appears in the conduc- tion/valence bands photoemission spectra (PES) regard- less of their Se concentration [8,9]. Ni 2p core level PES or X-ray absorption spectroscopy (XAS) studies also have failed to catch clear evidence for an electronic structure change across the MIT. Inconsistency resides also on theoretical predictions. Conventional band cal- culations have failed to reproduce the insulating phase [8,10]. Due to these difficulties, the microscopic origin of the MIT in NiS2−xSexremains unclear in spite of the accumulated data in a long term.
A few noticeable progresses on this issue has made with a help of newly developed methods both in theory and in experiment. Several theoretical groups have re- ported that the insulating phase of NiS2 is successfully reproduced in their ab initio band calculations combined with the dynamic mean field theory (DMFT) [11,12]. In particular, Kune˘s et al. firstly noticed that the S-S dimer in NiS2−xSex is the key factor to control the gap size [11]. In experimental side, an angle-resolved photoemis- sion spectroscopic (ARPES) measurement revealed that the spectral weight transfer of a coherent quasiparticle peak to incoherent dispersionless part indicates the in- crease of the electron correlation that drives the Mott
This is an Open Access article distributed under the terms of the Creative Commons Attribution Non-Commercial License (http://creativecommons.org/licenses/by-nc/3.0) which permits unrestricted non-commercial use, distribution, and reproduction in any medium, provided the original work is properly cited.
transition [13]. An XAS study also successfully observed a clear electronic structure change across the MIT, but interestingly enough, the change does not depend on the Se concentration x, but depends only on the phase of the samples [14].
In this paper, we present details of Ni 2p XPS spec- tra on our single crystalline NiS2−xSex as a function of the Se concentration. Even though there are a few XPS studies on this system, either poly crystalline samples or only single crystalline end members NiS2/NiSe2 were exploited, and no systematic study on a full series of single crystalline Ni(S,Se)2 has been reported yet [15].
Our measurements revealed that there is a distinct dif- ference in spectral asymmetry between metallic phase and insulating one in the Ni 2p photoemission spectra.
We also analyzed the spectra using configurational in- teraction cluster model (CICM) calculations and esti- mated the key electronic structure parameters such as p-d charge transfer energy ∆ and the d-p hybridization strength Vpdσ. These values are consistent with the pre- viously reported values in the XAS study [14], support- ing the percolation scenario where a global connection of Ni[(S,Se)2]6 octahedra with Se-Se dimers plays a key role for the gap closing.
II. Methods
High quality single crystalline NiS2−xSex (x=0.0, 0.3, 0.5, 0.6, and 2.0) were synthesized by a Cl2 vapor trans- port method as described in our previous XAS study [14].
The single phase of our samples was checked by X-ray diffraction. The metal-insulator transition as a function of Se concentration (x) was also checked by measuring resistivity vs. temperature curves (Fig. 1 in Ref. 14), showing very consistent with literature. The x-ray pho- toemisson spectroscopic experiments were performed in an ultra high vacuum chamber using a Scienta SES100 electron spectrometer and a Thermo Scientific XR3 twin anode X-ray source. Fresh sample surfaces were obtained by scraping in situ with a diamond file at the pressure of ∼5×10⁻¹⁰ Torr. The XPS spectra were acquired at room temperature using Al-Kα (¯hω = 1486.6 eV) with a pass energy of 50 eV in the spectrometer. The measured points are marked as solid diamond (♦) in the tempera- ture vs. Se phase diagram of Fig. 1.
Fig. 1. (Color online) T vs.x phase diagram of NiS2−xSex
(Ref. 17). The blue line is metal-insulator phase bound- ary, and the red curve is paramagnetic-antiferromagnetic phase boundary, which make four kinds of phase i.e.
paramagnetic insulator (PI), antiferromagnetic insula- tor (AFI), paramagnetic metal (PM), and antiferromag- netic metal (AFM), (Inset) Crystal structure of pyrite Ni(S,Se)2. The S(Se)-S(Se) dimer is highlighted in red color.
In pyrite nickel dichalcogenide (space group P a3), Ni[(S,Se)2]6 octahedra are linked with each others as shown in the right inset of Fig.1. Six S/Se ligands form an octahedron and one Ni cation is located at the cen- ter of the octahedron. Due to the relatively low electron affinity of the chalcogen ions, each ligand at the corners of the octahedron has a strong σ-bonding with another ligand, forming a dimer of (S,Se)22−. Divalent cation Ni2+ is under the crystal electric field of Oh symmetry, which induces a splitting of five 3d orbitals into triply degenerate t2g and doubly degenerate eg states. The obtained XPS spectra were analyzed within the frame- work of the CICM [16]. The configurational interaction is characterized by the on-site d-d Coulomb repulsion (U ≡ E(dn+1) + E(dn−1)− 2E(dn)), the ligand p to Ni 3d charge transfer energy (∆≡ E(dn+1L)− E(dn), L a ligand hole), and the hybridization strength between Ni 3d and ligand p states (V ≡ ⟨d|H|p⟩), which can be ex- pressed with the Slater-Koster overlap integrals accord- ing to the point group symmetry of the cluster. For the photoemitted final state, the average Coulomb attrac- tion between a 2p core hole and a 3d electron is set to 1.2U . In this work, U was set to 5.0 eV, Vpd to 1.35 eV, and ∆ was used as a fitting parameter. The initial/final states are spanned over |d8⟩ ⊕ |d9L⟩ ⊕ |d10L2⟩ / |cd8⟩
⊕ |cd9L⟩ ⊕ |cd10L2⟩ configurations, respectively. Here,
Fig. 2. (Color online) Ni 2p X-ray photoemission spectra of NiS2−xSex(x=0, 0.3, 0.5, 0.6, 2.0).
c denotes a Ni 2p core hole. In the CICM, we did not take the full multiplets of each configurational state but take only the center of weight of the multiplets into ac- count. The distribution of the multiplets was simulated by a broadening of the configurational states.
III. Results and Discussion
Figure 2 shows a full list of Ni 2p XPS spectra in NiS2−xSex (x=0, 0.3, 0.5, 0.6, 2.0). Each spectrum has two spin-orbit split structures 2p3/2and 2p1/2, and each structure has one sharp peak (main line) and one broad peak (satellite) with ∼6 eV distance. The experimental Ni 2p3/2 spectra were decomposed with four Voight pro- files and Shirley background [18]. Three Voight profiles
(blue curves, m1-m3) are used for the main line and one (red curve, s1) for the satellite. The main lines and the satellites in 2p3/2 structure are not a single state, but a mixture of multiplets resulting from the interaction be- tween a J=3/2 core hole and J=2∼4 d8 electrons spin- orbital states with the configurational interaction states [15]. Thus, those four Voight profiles are just minimal requirement to phenomenologically reproduce the exper- imental spectra, not the number of multiplet states. The decomposed profiles in the 2p1/2 region were calculated to have half weight to the 2p3/2 profiles, which can be justified by the ratio of the occupied electron numbers in each spin-orbit split states J=1/2 and 3/2. Following this procedure, we detected that there is a small devia- tion in the spectral weight of 2p1/2region. This deviation can be compensated with a single broad peak (green line) with∼10 eV full width at half maximum, but the origin is not clear. Based on the curve fittings, we estimate the spectral weight ratio of satellite to main line for each sample. It does not show a noticeable dependence on x, indicating that the many electron interaction parameters hardly vary with the Se concentration.
In Fig. 3, we show a CICM calculation for the Ni 2p XPS spectra of NiSe2and NiS2, respectively. As we show above, the Ni 2p spectra show a very weak dependence on Se concentration. In particular, the insulating phase spectra essentially make no difference. So, it is enough to apply the CICM to the end member spectra only. The model calculation basically explains the ∼6 eV satellite structure within a reasonable parameter space. In this work, we obtained U =5.0 , ∆=3∼4.0, and V =1.35 eV, respectively. However, the uncertainty of the parameter values is quite large, 0.5∼1 eV depending on parameter type. This is due to the simplicity of the cluster model and to the similarity of the XPS spectra in spite of the large Se concentration change. Although the model cal- culation has many limited features, we can find a param- eter set that shows increasing ∆ with decreasing x. This result indicates that the Zaanen-Sawatzky-Allen scheme for the metal-insulator transition works in some degree, but it is very limited [4].
Although the Ni 2p XPS spectra look very similar to each other, there is a noticeable difference in the line shape between the metallic phase and the insulating one.
To see the difference more clearly, we subtracted the
Fig. 3. (Color online) Calculated Ni 2p XPS based on the configurational interaction cluster model.
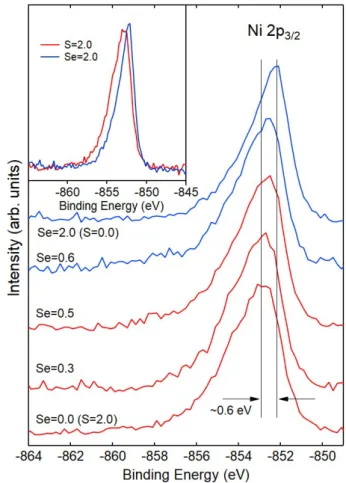
background and the satellite (s1in Fig.2) from each ex- perimental spectrum respectively, and plotted them to- gether in Fig.4. From insulating side (x=0.0) to metallic one (x=2.0), the peak position moves to lower binding energy side by∼0.6 eV. The line shape also changes more asymmetrically as shown in the inset of Fig. 4. Both of these changes are related to 2p core hole screening by conduction electrons. First, the peak position shift to lower kinetic energy (or higher binding energy) side re- sults from an kinetic energy loss by core hole attractions, which is relatively strong in poorly screened cases and is weak in well screened cases. When the system has a large amount of conduction electrons, they will screen the core hole well, so the peak of NiSe2 has the highest kinetic energy (or the lowest binding energy). Second, the core hole acts as a scatterer to the conduction elec- trons, making large number of electron-hole pairs near the Fermi energy. During this scattering process, an en- ergy is also transferred to the electron-hole pair from the
Fig. 4. (Color online) Satellite-removed experimental Ni 2p3/2 XPS of NiS2−xSex. (Inset) Overlapped spectra of NiSe2 (blue) and NiS2 (red) to contrast the asymmetry of each spectrum.
photoelectron [19,20]. This makes an additional spectral weight on the left side of the core spectrum, resulting to an asymmetric line shape.
Our XPS line shape analysis reveals that this system undergoes a metal-insulator transition as Se concentra- tion decreases to zero without a large change of the many electron interaction parameters. In particular, around the phase border line x ∼ 0.5, the spectra essentially remain the same. This raises a question what the mi- croscopic origin is in the MIT. On this issue, we have proposed a percolation scenario in which a global connec- tion of the Ni(S,Se)6octahedra with Se-Se dimers plays a key role to the gap closing [14]. All our spectroscopic data indicate that the many electron interaction param- eters undergo a negligible change across the phase border line, which is too small to explain the MIT in the ZSA scheme. At most, the difference of the charge transfer en- ergies ∆ (∼2 eV at most) between the end members falls
on a phase boundary of the MIT. Only the percolation scenario seems to reconcile this paradoxical result.
IV. Summary
The electronic structure of NiS2−xSexsystem has been studied for various Se compositions (x) by XPS. The Ni 2p XPS spectra show a negligible dependence on x in the spectral weight ratio of satellite to main peak and in main-to-satellite peak distance, but show a noticeable difference in asymmetry of the 2p3/2 main peaks. This result indicates that the key electronic structure parame- ters change too small to drive the metal-insulator transi- tion, but that the screening strength of conduction elec- trons does enough. This apparently contradictory result can be reconciled with the percolation scenario proposed in our previous X-ray absorption study.
ACKNOWLEDGEMENTS
This work was supported by the National Research Foundation (NRF) of Korea Grant funded by the Korean Government (Grant No. 2016R1D1A3B03934980).
REFERENCES
[1] R. J. Bouchard, J. L. Gillson and H. S. Jarrett, Mater. Res. Bull. 8, 489 (1973).
[2] H. S. Jarrett, R. J. Bouchard, J. L. Gillson, G. A.
Jones and S. M. Marcus et al., Mater. Res. Bull. 8, 877 (1973).
[3] J. A. Wilson, The Metallic and Nonmetallic States of Matter(Taylor and Francis, London, 1985), p. 215 [4] J. Zaanen, G. A. Sawatzky and J. W. Allen, Phys.
Rev. Lett. 55, 418 (1985).
[5] A. Husmann, D S. Jin, Y. V. Zastavker, T. F. Rosen- baum and X. Yao et al., Science 274, 1874 (1996).
[6] R. L. Kautz, M. S. Dresselhaus, D. Adler and A.
Linz, Phys. Rev. B 6, 2078 (1972).
[7] A. K. Mabatah, E. J. Yoffa, P. C. Eklund, M. S.
Dresselhaus and D. Adler, Phys. Rev. B 21, 1676 (1980).
[8] A. Y. Matsuura, Z. -X. Shen, D. S. Dessau, C. -H.
Park and T. Thio et al., Phys. Rev. B 53, R7584 (1996).
[9] K. Mamiya, T. Mizokawa, A. Fujimori, T. Miyadai and N. Chandrasekharan et al., Phys. Rev. B 58, 9611 (1998).
[10] A. Perucchi, C. Marini, M. Valentini, P. Postorino and R. Sopracase, et al., Phys. Rev. B 80, 073101 (2009).
[11] J. Kuneš, L. Baldassarre, B. Schächner, K. Rabia and C. A. Kuntscher et al., Phys. Rev. B 81, 035122 (2010).
[12] C. -Y. Moon, H. Kang, B. G. Jang and J. H. Shim, Phys. Rev. B 92, 235130 (2015).
[13] H. C. Xu, Y. Zhang, M. Xu, R. Peng and X. P. Shen et al., Phys. Rev. Lett. 112, 087603 (2014).
[14] J. Jeong, K. J. Park, E. -J. Cho, H. -J. Noh and S.
B. Kim, et al., J. Korean Phys. Soc. 72, 111 (2018).
[15] S. R. Krishnakumar, D. D. Sarma, Phys. Rev. B 68, 155110 (2003).
[16] J. Park, S. Ryu, M. -S. Han and S. -J. Oh, Phys.
Rev. B 37, 10867 (1988).
[17] G. Czjzek, J. Fink, H. Schmidt, G. Krill and M. F.
Lapierre et al., J. Magn. Magn. Mater. 3, 58 (1976).
[18] D. A. Shirley, Phys. Rev. B 5, 4709 (1972).
[19] G. D. Mahan, Phys. Rev. B 163, 612 (1967).
[20] P. Nozi`eres and C. T. De Dominicis, Phys. Rev.
178, 1097 (1969).