Pharmacological Unmasking Microarray Approach-Based
Discovery of Novel DNA Methylation Markers for Hepatocellular Carcinoma
DNA methylation is one of the main epigenetic mechanisms and hypermethylation of CpG islands at tumor suppressor genes switches off these genes. To find novel DNA methylation markers in hepatocellular carcinoma (HCC), we performed pharmacological unmasking (treatment with 5-aza-2´-deoxycytidine or trichostatin A) followed by microarray analysis in HCC cell lines. Of the 239 promoter CpG island loci hypermethylated in HCC cell lines (as revealed by methylation-specific PCR), 221 loci were found to be hypermethylated in HCC or nonneoplastic liver tissues. Thirty-three loci showed a 20% higher methylation frequency in tumors than in adjacent nonneoplastic tissues. Correlation of individual cancer-related methylation markers with clinicopathological features of HCC patients (n = 95) revealed that the number of hypermethylated genes in HCC tumors was higher in older than in younger patients. Univariate and multivariate survival analysis revealed that the HIST1H2AE methylation status is closely correlated with the patient’s overall survival (P = 0.022 and P = 0.010, respectively). In conclusion, we identified 221 novel DNA methylation markers for HCC. One promising prognostic marker, HIST1H2AE, should be further validated in the prognostication of HCC patients.
Key Words: CpG Islands; DNA Methylation; Carcinoma, Hepatocellular; Microarray;
Prognosis Namhee Jung1, Jae Kyung Won2,
Baek-Hui Kim3, Kyung Suk Suh4, Ja-June Jang2, and Gyeong Hoon Kang1,2
1Laboratory of Epigenetics, Cancer Research Institute, 2Departments of Pathology, 3General Surgery, Seoul National University College of Medicine, Seoul; 4Department of Pathology, Korea University School of Medicine, Seoul, Korea Received: 21 November 2011
Accepted: 23 February 2012 Address for Correspondence:
Gyeong Hoon Kang, MD
Department of Pathology, Seoul National University College of Medicine, 103 Daehak-ro, Jongno-gu, Seoul 110-799, Korea Tel: +82.2-740-8263, Fax: +82.2-743-5530
E-mail: [email protected]
This study was supported by a Mid-career Researcher Program through NRF grant funded by the Ministry of Education, Science and Technology (MEST) (2011-0015646) and a Priority Research Centers Program through the National Research Foundation of Korea (NRF) funded by MEST (2009-0093820).
http://dx.doi.org/10.3346/jkms.2012.27.6.594 • J Korean Med Sci 2012; 27: 594-604
INTRODUCTION
CpG islands are CpG dinucleotide-rich areas found within the promoter and 5´ exonic regions of about 60%-70% of the human genes (1, 2). Aberrant hypermethylation on promoter CpG island loci can lead to inactivation of genes that are actively expressed or increased silencing of genes that are inactive. While both ge- netic mutations and promoter CpG island hypermethylation changes are simultaneously found in human cancer cells, re- cent studies have demonstrated that the number of genes inac- tivated by promoter CpG island hypermethylation is four-times higher than the number of genes undergoing mutations in colorec- tal cancers (3, 4). Besides its importance as a gene inactivation mechanism, promoter CpG island hypermethylation is gaining attention as a potential tumor biomarker. In this respect, DNA methylation markers are being actively investigated to detect human cancers in blood, secretions, or exfoliated cytology spec- imens, and to predict the risk of cancer progression and devel- opment (5-9).
Primary liver cancer is the fifth most common cancer world- wide and the third most common cause of death by cancer (10,
11). The overall incidence and mortality of hepatocellular carci- noma (HCC) has been decreasing in areas with high incidence (12). However, both the incidence and mortality rates of HCC are increasing in Western countries (13). The development of HCC is the consequence of a multistep process that involves several morphologically recognizable lesions and accumula- tion of molecular changes at the genetic and epigenetic levels.
Several studies have reported HCC-associated genetic changes, including mutations in several tumor suppressor genes (TP53, p16, PTEN, IGF2R, and RB), oncogenes (c-MYC, c-MET, PIK3CA, and CTNNB1), and other cancer-associated genes (CDH1 and CCND1) (14, 15). Not only genetic changes but also epigenetic alterations underlie the evolution of HCC. Since hypermethyl- ation of the CDH1 promoter CpG island locus was reported in HCC (16), about 150 other genes have been found to be hyper- methylated in HCC in a cancer-specific manner (17-19). How- ever, more genes undergoing hypermethylation of promoter CpG island loci are likely to be identified in HCC. Schuebel and colleagues reported that about 400 genes actively expressed in normal colon epithelial cells are inactivated by promoter CpG island hypermethylation in colorectal cancers (3).
Of the increasingly higher number of genes being identified as undergoing promoter CpG island hypermethylation in HCC, only a few have clinical relevance and potential utility as bio- markers for prediction of recurrence or poor prognosis (20-23).
The primary aim of the present study is to discover novel can- cer-related DNA methylation markers for HCC. We performed a large-scale gene expression microarray analysis, which enables the simultaneous characterization of the transcription profile of tens of thousands of genes, on HCC cell lines treated with de- methylating agents. Of the genes up-regulated by treatment with demethylating agents, we selected those harboring CpG island loci in their promoter sequences. We then performed methyla- tion-specific PCR (MSP) to determine whether promoter CpG island loci of the candidate genes were hypermethylated in HCC and whether this modification was cancer-specific. We found 2 promising cancer-specific methylated genes (HIST1H2AE and EFEMP2) that are associated with poor prognosis in patients with HCC.
MATERIALS AND METHODS
Cell line culture and 5-aza-2´-deoxycytidine (AZA) treatment A total of 8 HCC cell lines (SNU398, SNU475, SNU739, SNU761, SNU878, SNU886, HepG2, and Huh7) were obtained from the Korean Cell Line Bank (Seoul, Korea). All cell lines were main- tained in RPMI-1640 medium with the exception of Huh7, which was maintained in Dulbecco’s modified Eagle’s medium (DMEM). HEPES buffer (25 mM), fetal bovine serum (FBS) (10%), penicillin (100 units/mL), and streptomycin (0.1 mg/mL) were added to the medium. We seeded 3 × 10⁵ cells (from each of the cell lines) per milliliter of culture medium and treated them 24 hr later with 5 μM AZA (Sigma Chemical Co., St. Louis, MO, USA) for 96 hr, during which period media and drugs were changed every 24 hr. AZA was dissolved in acetic acid and diluted to 10 mg/mL. Cells were incubated for 72 hr and then treated with trichostatin A (TSA; Sigma) at 300 nM for 24 hr. For co-treat- ment of cells with AZA and TSA, AZA (5 μM) was added initially for 72 hr, after which it was removed, and AZA (5 μM) and TSA (300 nM) were added for an additional 24 hr. As a negative con- trol, cell lines were treated with acetic acid in an equal volume of medium without the drug.
Patients and tissue specimens
Formalin-fixed, paraffin-embedded archival tissues from 95 HCC patients (mean age 55 yr; 75 males and 20 females) were retrieved from the files of the Department of Pathology, Seoul National University Hospital (Seoul, Korea). These patients had undergone curative surgery for HCC from 2001 to 2004 at the Seoul National University Hospital. The degree of fibrosis in non- neoplastic livers was graded according to the Ishak scoring sys- tem. A liver with a fibrosis staging score of 5 or 6 was considered
cirrhotic. For histological examination, tissue blocks containing tumors were selected and serially sectioned. Nonneoplastic liver tissues were obtained > 3 cm away from tumor regions and con- firmed to be tumor-free by microscopic examination. We re- viewed the electronic medical records of the patients to obtain clinicopathological information, including age, gender, Child- Pugh classification, and γ-glutamyltranspeptidase (GGT) and alpha-fetoprotein (AFP) levels. Fresh-frozen tissue samples of HCC and adjacent nonneoplastic liver were obtained from HCC patients (n = 10) who underwent curative resection for HCC at the Seoul National University Hospital in 2008.
Microarray
Illumina’s whole-genome expression arrays (Sentrix Human- Ref-8 Expression BeadChip; Illumina, Inc., San Diego, CA, USA) were used to analyze the RNA expression profiles of 5 HCC cell lines (SNU 398, SNU 761, SNU 878, HepG2, and Huh7) before and after treatment with AZA (5 μM) or TSA (300 nM).
Methylation-specific PCR (MSP)
For methylation analysis, 2 μg of genomic DNA obtained from HCC cell lines and tissue samples was modified using the EZ DNA MethylationTM Kit (Zymo Research, Orange, CA, USA) ac- cording to the manufacturer’s protocol. The specific primers for bisulfite modified DNA were designed using MSPPrimer (http:
//www.mspprimer.org). For genes whose primer sequences could not be obtained by using the MSPPrimer software, MSP primers were designed using MethPrimer (http://www.urogene.
org/methprimer). MSP primer sequences are available on re- quest. MSP was performed as previously described (24).
Reverse transcription (RT)-PCR
We isolated total RNA from 8 HCC cell lines by using the RNeasy Mini Kit (Qiagen, Valencia, CA, USA) according to the manu- facturer’s protocol. A total of 5 μg of RNA was reverse-transcribed using Superscript III (Invitrogen, Carlsbad, CA, USA). Semi-quan- titative real-time PCR was performed with 10 ng of cDNA in a 7300 Real-Time PCR System (Applied Biosystems, Foster City, CA, USA) by using the SYBR® Green PCR Master Mix (Applied Biosystems). Gene expression levels were normalized to the ex- pression of GAPDH. Oligonucleotide sequences of primers and PCR conditions are available on request.
Statistics
Associations between clinicopathological features and hyper- methylated gene markers were analyzed using SPSS 13.0 for Win- dows. P values were based on Fisher’s exact test or Pearson’s chi-squared test. Survival was measured from the surgical resec- tion day until death or the last clinical review before August 31, 2007. Overall survival was estimated by the method of the Ka- plan-Meier log-rank test, and Cox proportional hazard analysis
was used to estimate multivariate relationships between several clinicopathological and hypermethylated gene markers. P < 0.05 was considered significant.
Ethics statement
This study was approved by the institutional review board of the Seoul National University Hospital (Approval No., C-1007-209- 325). Written informed consent was exempted considering the retrospective nature of the study and minimal harm to the pa- tients.
RESULTS
Pharmacological unmasking and microarray analysis in HCC cell lines
The expression profiles of 5 HCC cell lines (SNU398, SNU761, SNU878, HepG2, and Huh7) were obtained before and after treatment with either AZA or TSA by using a microarray plat- form (Fig. 1). To identify genes undergoing hypermethylation- dependent expression changes, we determined the expression fold changes of individual genes between mock-treated and TSA- or AZA-treated cells, and plotted TSA- and AZA-related fold changes on the x- and y-axis, respectively (Fig. 2). The DNA demethylating agent (AZA) induces reexpression of densely hypermethylated and transcriptionally inactive genes, whereas the class I and II histone deacetylase inhibitor (TSA) does not induce reexpression (25, 26). Of the genes that did not show an
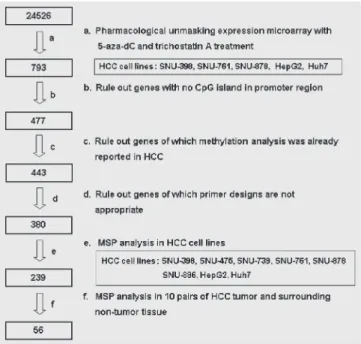
Fig. 1. Flow chart for selection of candidate genes. Screening of candidate tumor suppressor genes (TSGs) was performed in 5 hepatocellular carcinoma (HCC) cell lines treated with 5 µM 5-aza-2´-deoxycytidine (AZA) or 300 nM trichostatin A (TSA) by using a 24,526-oligonucleotide mRNA microarray. We obtained 793 candidates whose gene expression did not increase with TSA treatment (< 1.4-fold) but increased more than 2-fold after AZA treatment. We excluded genes that do not harbor CpG is- lands in their promoters or whose methylation status in HCC tumors had already been reported in the literature. We further excluded genes for which adequate oligonucle- otide primers could not be designed by using the MSPprimer or MethPrimer software programs. As a result, we selected 380 genes to be examined for their methylation status in HCC cell lines by using methylation-specific PCR (MSP).
AZA
TSA SNU-398
0 2 4 6 8 10 12 14 14
12 10 8 6 4 2 0
AZA
TSA HepG2
0 2 4 6 8 10 12 14 14
12 10 8 6 4 2 0
AZA
TSA SNU-761
0 2 4 6 8 10 12 14 14
12 10 8 6 4 2 0
AZA
TSA SNU-878
0 2 4 6 8 10 12 14 14
12 10 8 6 4 2 0
AZA
TSA Huh7
0 2 4 6 8 10 12 14 14
12 10 8 6 4 2
0 Fig. 2. Hypermethylation-dependent expression changes. Gene
expression changes for the indicated cells treated with trichostatin A (TSA) (x-axis) or 5-aza-2´-deoxycytidine (AZA) (y-axis) are plot- ted by log-fold change, and individual genes are shown in circles.
increase in expression with TSA treatment (< 1.4-fold), subsets of genes displayed a peak of AZA-induced gene expression (> 2- fold). We considered the genes showing both < 1.4-fold expres- sion with TSA treatment and > 2-fold expression with AZA treat- ment as candidate genes that might be inactivated by hyper- methylation. In at least one of 5 cell lines, 793 genes were found to meet the selection criteria. Of these, genes that have no CpG islands in their promoters and proximal transcriptional start sites (TSS) as well as those genes whose methylation status in HCC had already been reported, were excluded from subsequent analysis (Fig. 1).
DNA methylation status of candidate genes in HCC cell lines To identify whether the candidate genes (n = 443) are methyl-
ated in their promoter CpG island loci, we tried to design MSP primers by using the MSPprimer or MethPrimer software pro- grams and successfully designed optimal primers for 380 genes.
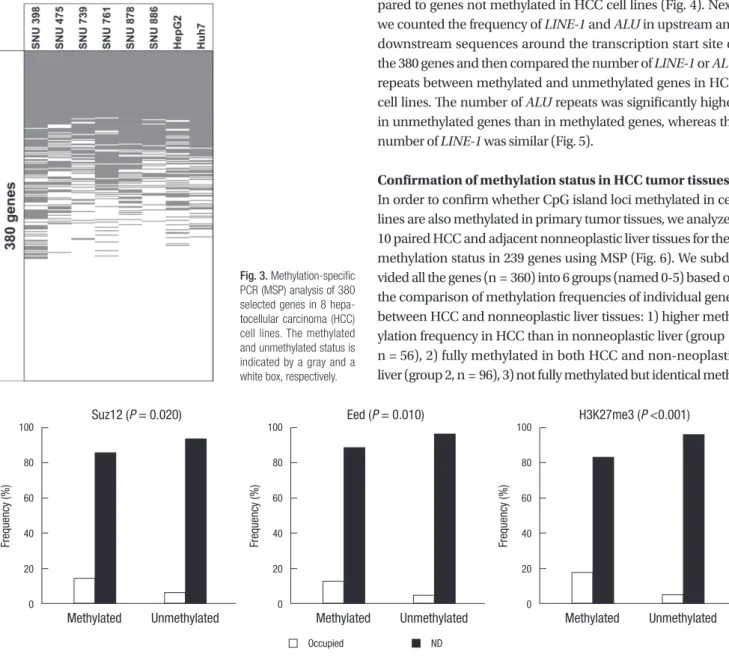
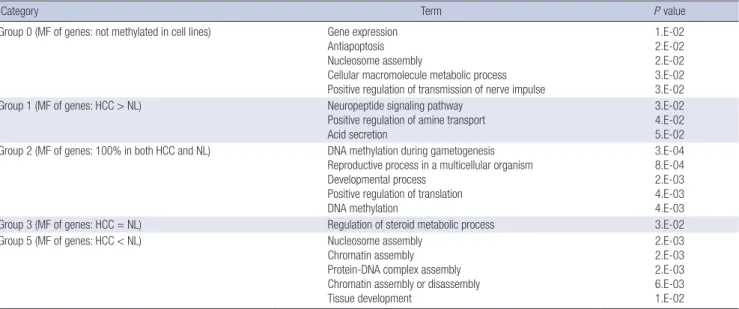
We analyzed the methylation status of these 380 genes in 8 HCC cell lines (SNU398, SNU475, SNU739, SNU761, SNU878, SNU886, HepG2, and Huh7) using MSP and found that 239 of 380 genes were methylated in one or more cell lines (Fig. 3), and that 167 genes were methylated in at least four cell lines. To identify the factors that might influence in their predisposition to DNA meth- ylation, we compared the occupancy rate of Polycomb proteins (EED2 and SUZ12) and the frequency of the H3K27me3 modi- fication between methylated genes and unmethylated genes in HCC cell lines by using the occupancy maps published for em- bryonic stem cells (27). Genes methylated in HCC cell lines had a higher frequency of SUZ12, EED, and H3K27me3 targets com- pared to genes not methylated in HCC cell lines (Fig. 4). Next, we counted the frequency of LINE-1 and ALU in upstream and downstream sequences around the transcription start site of the 380 genes and then compared the number of LINE-1 or ALU repeats between methylated and unmethylated genes in HCC cell lines. The number of ALU repeats was significantly higher in unmethylated genes than in methylated genes, whereas the number of LINE-1 was similar (Fig. 5).
Confirmation of methylation status in HCC tumor tissues In order to confirm whether CpG island loci methylated in cell lines are also methylated in primary tumor tissues, we analyzed 10 paired HCC and adjacent nonneoplastic liver tissues for their methylation status in 239 genes using MSP (Fig. 6). We subdi- vided all the genes (n = 360) into 6 groups (named 0-5) based on the comparison of methylation frequencies of individual genes between HCC and nonneoplastic liver tissues: 1) higher meth- ylation frequency in HCC than in nonneoplastic liver (group 1, n = 56), 2) fully methylated in both HCC and non-neoplastic liver (group 2, n = 96), 3) not fully methylated but identical meth- Fig. 3. Methylation-specific
PCR (MSP) analysis of 380 selected genes in 8 hepa- tocellular carcinoma (HCC) cell lines. The methylated and unmethylated status is indicated by a gray and a white box, respectively.
Fig. 4. Frequency of H3K27me3 modification and occupancy rate of SUZ12 and EED in methylated (n = 239) and unmethylated genes (n = 141) in human embryonic stem cells. The chi-squared test was conducted to analyze the significance of the association.
Occupied ND
Frequency (%)
Methylated
Suz12 (P = 0.020)
Unmethylated
100
80
60
40
20
0
Frequency (%)
Methylated
H3K27me3 (P <0.001)
Unmethylated
100
80
60
40
20
0
Frequency (%)
Methylated
Eed (P = 0.010)
Unmethylated
100
80
60
40
20
0
ylation frequencies in HCC and non-neoplastic liver (group 3, n = 17), 4) genes not methylated in HCC or non-neoplastic liver (group 4, n = 18), 5) genes less frequently methylated in HCC than in non-neoplastic livers (group 5, n = 52), and 6) unmeth- ylated genes in HCC cell lines (group 0, n = 141) (Fig. 6). To iden- tify key biological functions associated with a list of genes within each group, we performed functional annotation analysis using the DAVID tool (http://david.abcc.ncifcrf.gov/) (Table 1). Group 1 genes showed a significant association with the neuropeptide
signaling pathway, positive regulation of amine transport, and acid secretion, whereas group 5 genes exhibited a significant association with nucleosome assembly, chromatin assembly, protein-DNA complex assembly, chromatin assembly or disas- sembly, and tissue development.
Correlation of promoter CpG island hypermethylation with down-regulation of gene expression
To ensure that the microarray data represent real changes in ex-
Methylated Unmethylated
Fig. 5. Comparison of ALU and LINE-1 repeats between methylated and unmethyl- ated genes. For ALU counting, the promoter sequence of a specific gene was divided into 20 bins of 1-kb sequence each (10 bins upstream and 10 bins downstream of each gene transcription start site), and the presence of ALU was annotated for each bin. We counted bins containing ALU within a 1-kb sequence. For LINE-1 counting, the promoter sequence of a specific gene was divided into 7 bins of 1-kb sequence each (2 bins upstream and 5 bins downstream of each gene transcription site), and the presence of LINE-1 was annotated for each bin. Bins containing LINE-1 within a 1-kb sequence were counted. Student’s t-test was performed to determine the sta- tistical significance of the difference of means between 2 groups.
(P = 0.018)
(P = 0.254) 15
10
5
0 ALU LINE-1
Fig. 6. Methylation-specific PCR (MSP) analysis of 239 genes in 10 pairs of tumor and surrounding nontumor tissue. The methylated and unmethylated status is indicat- ed by a gray and a white box, respectively. Genes were divided into subgroups based on the methylation pattern in hepatocellular carcinoma (HCC) tumors and surrounding nonneoplastic liver tissues (see main text).
Table 1. Functional annotation analysis of classified genes. Gene ontology of hepatocellular carcinoma (HCC) tumors, surrounding nontumor tissues, and cell lines based on their DNA methylation patterns
Category Term P value
Group 0 (MF of genes: not methylated in cell lines) Gene expression Antiapoptosis Nucleosome assembly
Cellular macromolecule metabolic process Positive regulation of transmission of nerve impulse
1.E-02 2.E-02 2.E-02 3.E-02 3.E-02 Group 1 (MF of genes: HCC > NL) Neuropeptide signaling pathway
Positive regulation of amine transport Acid secretion
3.E-02 4.E-02 5.E-02 Group 2 (MF of genes: 100% in both HCC and NL) DNA methylation during gametogenesis
Reproductive process in a multicellular organism Developmental process
Positive regulation of translation DNA methylation
3.E-04 8.E-04 2.E-03 4.E-03 4.E-03
Group 3 (MF of genes: HCC = NL) Regulation of steroid metabolic process 3.E-02
Group 5 (MF of genes: HCC < NL) Nucleosome assembly
Chromatin assembly Protein-DNA complex assembly Chromatin assembly or disassembly Tissue development
2.E-03 2.E-03 2.E-03 6.E-03 1.E-02 Group 4: genes did not show any significant association with specific biologic functions. MF, methylation frequency; HCC, hepatocellular carcinoma; NL, normal liver.
Fig. 8. Methylation frequencies of 33 DNA methylation markers in HCC cell lines (n = 8) and tissue samples (10 paired HCC and non-neoplastic liver tissue samples). Methyla- tion frequencies of these DNA methylation markers in HCC tissue samples were higher than those of non-neoplastic liver tissue samples: the differences were 20% or more.
100
80
60
40
20
0
Methylation frequency (%)
RNASE4 ST14
CYB5R2 CRABP2
PPP1R14A
C1orf59 INA
DUOXA1
MAP6D1 NPB
RNF135
SERP2 CAMKV
NETO2 MT1E
SPINT1 HSPA 12B
EFEMP2 ZNF586
RASGRP2 ECEL1
ZNF342
Cell line HCC tissue Adjacent liver tissue
HIST1H2 ULBP1
TP53I13 LBH COL9A2
DHDH OXTR
WNT1
ALDH16A1
TUBB2B SERPINE2
Fig. 9. Methylation frequencies of 33 DNA methylation markers in hepatocellular carcinoma (HCC) tissue samples (n = 95). DNA methylation markers were distributed along the x-axis according to the decreasing order of methylation frequency.
100
80
60
40
20
0
Methylation frequency (%)
RNASE4
CAMKV
ULBP1 CRABP2
PPP1R14A ECEL1
RNF135 DUOXA1
MAP6D1
SERP2 NETO2
C1orf59 INA
RASGRP2 HSPA12B
DHDH COL9A2ST14
ZNF586 CTB5R2
TP53I13 HIST1H2AE
EFEMP2 LBH MT1E NPB
WNT1
SPINT1
ZNF342 ALDH16A1
OXTR
TUBB2B SERPINE2 Fig. 7. Effect of 5-aza-2´-deoxycytidine (AZA) and trichostatin A (TSA) on gene expression. RNA was isolated from hepatocellular carcinoma (HCC) cell lines left untreated or treated with AZA, TSA, or a combination of AZA and TSA. mRNA was reverse-transcribed, and gene expression was quantitated by real-time PCR and normalized to GAPDH ex- pression.
CRABP2_SNU-398 24
18 12 6 0
Acetic
acid TSA AZA AZA +
TSA
EFEMP2_SNU-475 0.4
0.3 0.2 0.1 0.0
Acetic
acid TSA AZA AZA +
TSA
HIST1H2AE_SNU-886 1.6
1.2 0.8 0.4 0.0
Acetic
acid TSA AZA AZA +
TSA
INA_SNU-475 0.00024
0.00018 0.00012 0.00006 0.0000
Acetic
acid TSA AZA AZA +
TSA NETO2_SNU-739
0.03
0.02
0.01
0.00 Acetic
acid TSA AZA AZA +
TSA
RASGRP2_SNU-475 1.6
1.2 0.8 0.4 0.0
Acetic
acid TSA AZA AZA +
TSA
TP53I13_SNU-398 0.0008
0.0006 0.0004 0.0002 0
Acetic
acid TSA AZA AZA +
TSA
Table 2. Correlation of promoter hypermethylated genes with clinical parameters Parameter RNASE4 DUOXA1 CRABP2 NETO2 CAMKV MAP6D1 ECEL1 INA PPP1R14A C1orf59 ULBP1 SERP2 RNF135 RASGRP2 HSPA12B DHDH COL9A2 ST14 ZNF586 CYB5R2 TP53I13 HIST1H2AE EFEMP2 LBH ALDH16A1 MT1E WNT1 SPINT1 OXTR NPB ZNF342 SERPINE2 TUBB2B
Age (yr) <55 (n=47) ≥55 (n=48) P value
43 47 0.20
40 42 0.73
31 35 0.46
23 38 0.00
28 32 0.47
21 35 0.01
22 28 0.26
25 24 0.76
23 26 0.61
14 29 0.00
12 23 0.02
14 20 0.23
13 20 0.15
16 13 0.46
12 13 0.86
4 19 0.00
7 15 0.06
9 12 0.49
9 11 0.65
4 14 0.01
9 8 0.75
6 10 0.29
6 9 0.42
5 10 0.17
7 7 0.97
9 5 0.23
4 10 0.09
2 10 0.02
3 8 0.12
6 4 0.52
1 8 0.03
1 6 0.11
3 4 0.72 Gender M (n=75) F (n=20) P value
71 19 1.0
64 18 0.73
52 14 0.95
50 11 0.33
49 11 0.39
45 11 0.69
37 13 0.21
39 10 0.87
36 13 0.18
33 10 0.63
25 10 0.17
25 9 0.33
26 7 0.98
21 8 0.30
15 10 0.01
19 4 0.77
19 3 0.39
17 4 1.0
15 5 0.76
15 3 0.76
11 6 0.18
11 5 0.32
9 6 0.08
10 5 0.30
9 5 0.16
11 3 1.0
12 2 0.73
9 3 0.71
9 2 1.0
7 3 0.43
8 1 0.68
6 1 1.0
5 2 0.64 Tumor size <6 cm (n=45) ≥6 cm (n=48) P value
45 43 0.06
37 43 0.31
32 32 0.64
30 29 0.53
28 31 0.81
25 29 0.63
24 25 0.90
25 23 0.46
25 22 0.35
22 20 0.48
18 15 0.38
20 13 0.08
16 15 0.66
15 13 0.51
9 14 0.31
13 8 0.16
10 10 0.87
9 12 0.56
12 6 0.08
10 8 0.50
9 6 0.33
8 7 0.68
7 7 0.90
7 7 0.90
8 6 0.48
8 6 0.48
8 6 0.48
6 6 0.90
5 5 1.0
4 6 0.74
5 4 0.73
5 1 0.10
4 3 0.71 AFP <100 (n=48) ≥100 (n=43) P value
45 41 1.0
43 36 0.41
34 28 0.56
35 22 0.03
32 24 0.29
34 21 0.03
22 25 0.24
23 23 0.60
22 25 0.24
22 18 0.70
17 15 0.96
18 15 0.80
18 12 0.33
7 20 0.00
8 15 0.05
17 5 0.01
12 9 0.65
10 10 0.78
9 10 0.60
10 7 0.58
6 11 0.11
6 9 0.28
8 7 0.96
8 6 0.72
8 6 0.72
7 7 0.82
10 3 0.06
10 2 0.02
5 6 0.61
4 6 0.51
7 2 0.11
6 1 0.07
4 2 0.48 GGT <56 (n=48) ≥56 (n=47) P value
46 44 0.68
43 39 0.35
35 31 0.46
34 27 0.17
31 29 0.77
28 28 0.90
32 18 0.01
30 19 0.03
30 19 0.03
25 18 0.18
21 14 0.16
20 14 0.23
19 14 0.32
17 12 0.30
15 10 0.27
14 9 0.25
12 10 0.67
13 8 0.24
13 7 0.15
9 9 0.96
11 6 0.20
9 7 0.62
9 6 0.42
9 6 0.42
8 6 0.59
9 5 0.26
9 5 0.26
6 6 0.97
7 4 0.36
5 5 1.0
6 3 0.49
6 1 0.11
4 3 1.0 Child-Pugh classification A (n=86) B (n=9) P value
81 9 1.0
77 5 0.02
61 5 0.45
58 3 0.07
56 4 0.28
51 5 1.0
46 4 0.73
46 3 0.31
46 3 0.31
40 3 0.51
32 3 1.0
32 2 0.48
31 2 0.49
27 2 0.72
22 3 0.69
21 2 1.0
19 3 0.43
21 0 0.20
19 1 0.68
15 3 0.36
16 1 1.0
14 2 0.64
14 1 1.0
13 2 0.63
12 2 0.62
14 0 0.35
12 2 0.62
10 2 0.32
10 1 1.0
9 1 1.0
7 2 0.20
6 1 0.51
6 1 0.51 Background liver Cirrhotic (n=62) Noncirrhotic (n=33) P value
60 30 0.34
52 30 0.53
39 27 0.06
40 21 0.93
36 24 0.16
36 20 0.81
34 16 0.55
35 14 0.19
34 15 0.38
28 15 0.98
22 13 0.71
21 13 0.59
20 13 0.49
18 11 0.66
19 6 0.19
14 9 0.61
10 12 0.03
14 7 0.88
11 9 0.28
9 9 0.13
14 3 0.10
12 4 0.37
12 3 0.19
11 4 0.47
6 8 0.07
10 4 0.76
9 5 1.0
8 4 1.0
8 3 0.74
7 3 1.0
5 4 0.71
4 3 0.69
5 2 1.0 Histologic grade 1, 2 (n=52) 3, 4 (n=23) P value
49 25 0.55
44 21 1.0
35 13 0.19
35 10 0.02
36 12 0.07
32 12 0.26
29 9 0.10
26 9 0.25
26 9 0.25
23 6 0.09
21 6 0.16
22 6 0.12
18 5 0.19
13 9 0.32
14 3 0.14
13 2 0.12
14 2 0.06
10 6 0.63
9 8 0.15
10 3 0.53
7 5 0.51
8 2 0.48
9 2 0.49
9 1 0.15
8 2 0.48
7 3 1.0
7 1 0.26
6 2 1.0
5 2 1.0
6 3 1.0
4 0 0.30
2 1 1.0
4 0 0.30 Microscopic vascular invasion Absent (n=38) Present (n=55) P value
37 51 0.65
32 49 0.54
29 36 0.26
29 31 0.05
27 33 0.27
23 31 0.69
25 25 0.05
22 27 0.40
23 26 0.21
24 19 0.01
18 17 0.11
17 17 0.17
14 19 0.82
14 15 0.33
13 12 0.19
13 10 0.08
9 13 1.0
6 14 0.26
6 12 0.47
12 6 0.01
6 11 0.61
6 10 0.76
7 8 0.62
7 8 0.62
9 5 0.05
7 7 0.45
6 8 0.87
6 6 0.54
8 3 0.05
1 8 0.08
4 5 0.82
5 2 0.12
4 3 0.36 Frequency (%)958669646359535252453736353126242322211918171616151515131211977 AFP, alpha-fetoprotein; GGT, serum
γ -glutamyltransferase.
more frequently hypermethylated in tumors from patients old- er than 55 yr than in tumors from patients younger than 55 yr (P < 0.05 for all genes). HSPA12B was more frequently methyl- ated in tumors from female patients than in tumors from male patients (P = 0.008). RNASE4 was more frequently methylated in tumors smaller than 6 cm than in HCC tumors bigger than 6 cm (P = 0.018). The methylation frequencies of NETO2, DHDH, and SPINT1 were significantly higher in HCC cases with AFP production smaller than 100 ng/mL than in HCC cases with AFP production higher than 100 ng/mL, whereas the methylation frequency of RASGRP2 and HSPA12B was significantly lower in HCCs with low AFP production (< 100 ng/mL). INA, PPP1R14A, and ECEL1 were more frequently methylated in HCC patients with low serum GGT levels (< 56 ng/mL) than in HCC patients with high serum GGT levels (≥ 56 ng/mL) (P < 0.05 for all genes).
The methylation frequencies of C1orf59, OXTR, and CYB5R2 were significantly lower in HCC tumors with microscopic vein invasion than in HCCs without microscopic vein invasion (P <
0.05 for all genes).
Correlation of DNA methylation markers with clinical outcome
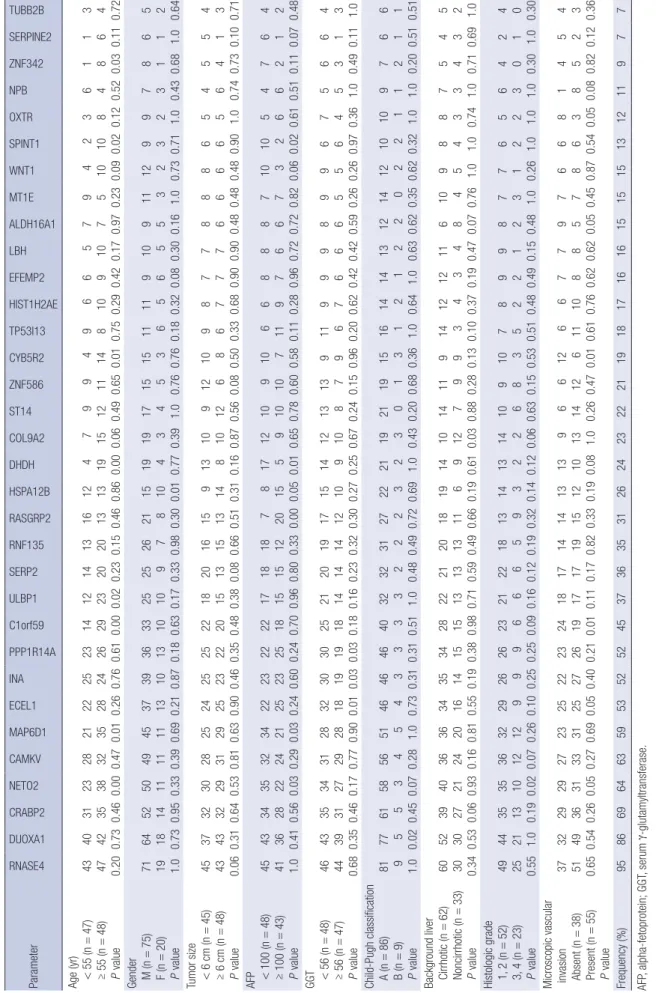
Correlation of DNA methylation markers with patient survival was analyzed in 90 patients. Five patients were excluded because of follow-up loss. Of the 33 CpG loci, HIST1H2AE and EFEMP2 exhibited an association between gene hypermethylation and poor prognosis (P = 0.022 and P = 0.081, respectively, by Kaplan- Meir log-rank test) (Fig. 10, Table 3). Among several other clini- copathological factors, tumor size, serum GGT levels, and mi- croscopic vascular invasion showed prognostic significance.
Taking into account these 3 clinicopathological factors, HIST- 1H2AE and EFEMP2 were included into a multivariate analysis
Fig. 10. Kaplan-Meier survival curves of 90 hepatocellular carcinoma (HCC) patients. Correlation of (A) HIST1H2AE, and (B) EFEMP2 methylation status with overall survival.
Cumulative survival Cumulative survival
Survival time (months) Survival time (months)
HIST1H2AE (P = 0.022)
Unmethylated
Unmethylated
Methylated
Methylated
EFEMP2 (P = 0.080)
0 20 40 60 80 100 0 20 40 60 80 100
1.0
0.8
0.6
0.4
0.2
0.0
1.0
0.8
0.6
0.4
0.2
0.0
A B
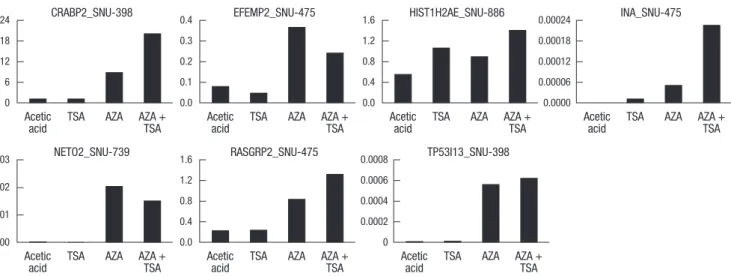
pression, we selected 7 genes (CRABP2, EFEMP2, HIST1H2AE, INA, NETO2, RASGRP2, and TP53I13) and analyzed their ex- pression changes in HCC cell lines treated with AZA, TSA, or a combination of AZA and TSA using semi-quantitative real-time PCR (Fig. 7). Treatment with AZA alone resulted in induction of mRNA expression of these 7 genes. In some cases, the effect of combined AZA and TSA treatment was stronger than that of AZA or TSA alone. These data implicate that histone deacetylation may also be involved in the inhibition of gene transcription by DNA methylation.
Correlation of DNA methylation markers with clinicopathological features of HCC
Genes with methylation frequencies higher in HCC than in non- neoplastic liver tissues are more likely to play an important role in hepatocarcinogenesis. To identify a possible correlation of gene hypermethylation with clinicopathological features of HCC patients, we selected 33 genes showing a methylation difference higher than 19% between HCC and nonneoplastic liver sam- ples (Fig. 8) and analyzed their methylation statuses in another set of HCC tissue samples (n = 95) by MSP. Hypermethylation was detected in 1 or more genes in all HCC samples. RNASE4 showed the highest methylation frequency (90%), followed by DUOXA1 (82%), CRABP2 (66%), and NETO2 (61%) (Fig. 9). The methylation status of the DNA methylation markers was corre- lated with clinicopathological features such as age, gender, tu- mor size, AFP and GGT levels, microscopic vascular invasion, and clinical outcome. The results of these association studies are summarized in Table 2. The number of methylated genes was significantly higher in older (≥ 55 yr) than in younger pa- tients (11.7 vs 8.8, P = 0.030 by Student’s t-test). NETO2, DHDH, MAP6D1, C1orf59, CYB5R2, ULBP1, SPINT1, and ZNF342 were
to identify independent predictors of overall survival (Table 4).
Multivariate analysis by using the COX proportional hazards model revealed that HIST1H2AE (P = 0.010) and EFEMP2 (P = 0.020) methylation status are significant variables affecting the overall survival of HCC patients. The methylation status of these two genes suggested about 2.6-fold increased risk as compared to patients who had these genes unmethylated.
DISCUSSION
In this study, we conducted a genome-wide microarray expres- sion screening in 5 HCC cell lines treated with AZA or TSA and characterized a set of methylation-regulated genes. We were able to identify 221 novel DNA methylation markers in HCC. At the same time, we observed that a significant number of genes up- regulated after AZA treatment, were actually not methylated in HCC cell lines and primary HCC tissue samples. While the mech-
anisms by which AZA reactivates expression of unmethylated genes has not been elucidated yet, several possibilities exist.
First, the up-regulation of unmethylated genes might be second- ary to AZA-induced expression of upstream genes that encode transcription factors and are inactivated by promoter CpG island hypermethylation, Second, the expression of these genes might be regulated by the methylation status of CpG island shores rather than promoter CpG islands (28). Lastly, AZA might induce deg- radation of retinoblastoma protein (pRb) through the MDM2- dependent proteasome pathway. Because loss of pRb protein in- duces a significant decrease in recruitment of G9a and SUV39H1 to histones around the promoter of target genes and thus re- duced H3K9 di- and tri-methylation, pRb degradation might result in re-expression of several silenced genes (Dr. Wei-Guo Zhu, personal communication).
In the present study, of the 380 genes containing CpG island loci in their promoter sequences and for which MSP oligonu- cleotide primers could be designed, 239 genes were found to be methylated in at least 1 HCC cell line. The remaining genes were found to be unmethylated in all HCC cell lines. The causes of selective predisposition to methylation are at present unclear.
However, genome architecture has been recently proposed to strongly correlate with predisposition to DNA methylation. Spe- cifically, genes with low frequency of retrotransposons (ALU and LINE-1) near the transcription start site or regulated by Poly- comb-group protein binding are more prone to DNA methyla- tion (29, 30). When we matched these data with ours, we also could observe that ALU and Polycomb-group proteins were sig- nificantly correlated with methylated status, whereas LINE-1 was not.
We analyzed 95 HCC samples for their methylation status in 33 CpG island loci and found that HCC tumors from older pa- tients harbored more methylated genes than HCC tumors from younger patients. In addition, we found that 2 DNA methylation markers (HIST1H2AE and EFEMP2) are closely associated with poor prognosis of HCC patients. HIST1H2AE is a member of the histone H2A family. Histones are responsible for nucleosome structure and their appropriate balance is required for the cor- rect assembly of chromatin as well as for proper cell division and growth (31, 32). H2a, one of the core histones, has nonalle- lic variants that are related by simple amino acid substitution (33). It is not clear whether these variants have functional signif- Table 3. Univariable analysis of clinicopathological characteristics with regard to sur-
vival of hepatocellular carcinoma (HCC) patients. The P value was determined by the Kaplan-Meier method
Characteristics No. of patients
3-yr survival rate (%)
5-yr survival rate (%)
P value Sex
M
F 71
19 56
45 43
45
0.782
Age (yr) < 55
≥ 55 44
46 41
66 33
53
0.014
Tumor size (cm) < 6
≥ 6 41
47 72
38 61
28
< 0.001
Background liver Cirrhosis
Chronic hepatitis 60
30 46
69 35
60
0.037
Child-Pugh score A
B C
81 9 0
57 27 -
47 14 -
0.136
GGT (IU/L) < 56 > 56
44 46
65 44
59 30
0.012
Microscopic invasion Absent Present
37 51
68 46
60 33
0.014
HIST1H2AE Unmethylated
Methylated 76
14 57
35 47
26
0.022
EFEMP2 Unmethylated
Methylated 77
13 58
31 45
31
0.080
Histologic grade (Edmondson-Steiner) 1, 2
3, 4 52
23 60
44 45
44
0.408
AFP (ng/mL) < 100
> 100 47
39 59
46 50
32
0.091
Table 4. Multivariate analysis of factors associated with poor survival in HCC patients
β SE Hazard ratio
(95% confidence interval) P value
Tumor size 0.913 0.359 2.491 (1.231-5.037) 0.011
GGT 0.746 0.328 2.109 (1.109-4.012) 0.023
Microscopic vascular
invasion 0.668 0.359 1.951 (0.966-3.941) 0.062 EFEMP2 methylation 0.962 0.413 2.618 (1.166-5.878) 0.020 HIST1H2AE methylation 0.982 0.380 2.670 (1.268-5.624) 0.010
icance and how the expression of individual histone genes is controlled. Among the 16 replication-dependent histone H2a genes, HIST1H2AE is included in the largest histone gene clus- ter (HIST1, including 55 histone genes) located on human chro- mosome 6 (34, 35). Previous studies have found that the expres- sion of histone H2a genes is related to histone gene clusters with different promoters and different transcription factor binding sites in mouse hepatoma cell lines. However, the structure in the promoters and transcription binding sites responsible for such differential expression has not been determined yet. On the other hand, it has been reported that the H2a genes are reg- ulated by histone H3K9 acetylation levels in the promoter re- gions (36). Similarly, we suggest that HIST1H2AE transcription might be influenced by histone acetylation based on the exper- imental results obtained by RT-PCR, using AZA-, TSA- or com- bined AZA/TSA-treated cell lines. The combinatory treatment showed to act synergistically in the reexpression of HIST1H2AE.
EFEMP2, also known as fibulin-4, is a novel extracellular ma- trix protein that belongs to the fibulin protein family (fibulin1-7).
EFEMP2 is involved in the stabilization and organization of the extracellular matrix. Moreover, missense mutations of EFEMP2 (G169A) cause human genetic disorders (37-39). However, the role of EFEMP2 in driving tumorigenesis is still unclear and re- quires further study. A recent study has reported limited EFEMP2 methylation in melanoma cell lines (40). In contrast, our data have demonstrated a correlation of its methylation status with poor survival of HCC patients.
In conclusion, we have identified 221 novel DNA methyla- tion markers for HCC by using a pharmacological unmasking microarray approach along with MSP. Of these, 55 DNA meth- ylation markers are more frequently methylated in HCC than in adjacent nonneoplastic liver tissues. The biological functions of these genes are associated with neuropeptide signaling pathways and positive regulation of amine transport. HIST1H2AE meth- ylation is strongly associated with poor prognosis of HCC pa- tients. A future independent study is required to validate HIST- 1H2AE methylation as a prognostic marker for HCC.
REFERENCES
1. Saxonov S, Berg P, Brutlag DL. A genome-wide analysis of CpG dinucle- otides in the human genome distinguishes two distinct classes of promot- ers. Proc Natl Acad Sci U S A 2006; 103: 1412-7.
2. Weber M, Hellmann I, Stadler MB, Ramos L, Pääbo S, Rebhan M, Schübeler D. Distribution, silencing potential and evolutionary impact of promoter DNA methylation in the human genome. Nat Genet 2007;
39: 457-66.
3. Schuebel KE, Chen W, Cope L, Glöckner SC, Suzuki H, Yi JM, Chan TA, Van Neste L, Van Criekinge W, van den Bosch S, et al. Comparing the DNA hypermethylome with gene mutations in human colorectal cancer.
PLoS Genet 2007; 3: 1709-23.
4. Wood LD, Parsons DW, Jones S, Lin J, Sjóblom T, Leary RJ, Shen D, Boca
SM, Barber T, Ptak J, et al. The genomic landscapes of human breast and colorectal cancers. Science 2007; 318: 1108-13.
5. Laird PW. The power and the promise of DNA methylation markers. Nat Rev Cancer 2003; 3: 253-66.
6. Maekita T, Nakazawa K, Mihara M, Nakajima T, Yanaoka K, Iguchi M, Arii K, Kaneda A, Tsukamoto T, Tatematsu M, et al. High levels of aber- rant DNA methylation in Helicobacter pylori-infected gastric mucosae and its possible association with gastric cancer risk. Clin Cancer Res 2006; 12: 989-95.
7. deVos T, Tetzner R, Model F, Weiss G, Schuster M, Distler J, Steiger KV, Grützmann R, Pilarsky C, Habermann JK, et al. Circulating methylated SEPT9 DNA in plasma is a biomarker for colorectal cancer. Clin Chem 2009; 55: 1337-46.
8. Tänzer M, Balluff B, Distler J, Hale K, Leodolter A, Röcken C, Molnar B, Schmid R, Lofton-Day C, Schuster T, et al. Performance of epigenetic markers SEPT9 and ALX4 in plasma for detection of colorectal precan- cerous lesions. PLoS One 2010; 5: e9061.
9. Herbst A, Rahmig K, Stieber P, Philipp A, Jung A, Ofner A, Crispin A, Neumann J, Lamerz R, Kolligs FT. Methylation of NEUROG1 in serum is a sensitive marker for the detection of early colorectal cancer. Am J Gas- troenterol 2011; 106: 1110-8.
10. Parkin DM. Global cancer statistics in the year 2000. Lancet Oncol 2001;
2: 533-43.
11. El-Serag HB, Rudolph KL. Hepatocellular carcinoma: epidemiology and molecular carcinogenesis. Gastroenterology 2007; 132: 2557-76.
12. Chang MH, You SL, Chen CJ, Liu CJ, Lee CM, Lin SM, Chu HC, Wu TC, Yang SS, Kuo HS, et al. Decreased incidence of hepatocellular carcinoma in hepatitis B vaccinees: a 20-year follow-up study. J Natl Cancer Inst 2009; 101: 1348-55.
13. Jemal A, Siegel R, Ward E, Hao Y, Xu J, Thun MJ. Cancer statistics, 2009.
CA Cancer J Clin 2009; 59: 225-49.
14. Herath NI, Leggett BA, MacDonald GA. Review of genetic and epigene- tic alterations in hepatocarcinogenesis. J Gastroenterol Hepatol 2006; 21:
15-21.
15. Villanueva A, Newell P, Chiang DY, Friedman SL, Llovet JM. Genomics and signaling pathways in hepatocellular carcinoma. Semin Liver Dis 2007; 27: 55-76.
16. Kanai Y, Ushijima S, Hui AM, Ochiai A, Tsuda H, Sakamoto M, Hirohashi S. The E-cadherin gene is silenced by CpG methylation in human hepa- tocellular carcinomas. Int J Cancer 1997; 71: 355-9.
17. Calvisi DF, Ladu S, Gorden A, Farina M, Lee JS, Conner EA, Schroeder I, Factor VM, Thorgeirsson SS. Mechanistic and prognostic significance of aberrant methylation in the molecular pathogenesis of human hepato- cellular carcinoma. J Clin Invest 2007; 117: 2713-22.
18. Nishida N, Nagasaka T, Nishimura T, Ikai I, Boland CR, Goel A. Aberrant methylation of multiple tumor suppressor genes in aging liver, chronic hepatitis, and hepatocellular carcinoma. Hepatology 2008; 47: 908-18.
19. Shin SH, Kim BH, Jang JJ, Suh KS, Kang GH. Identification of novel meth- ylation markers in hepatocellular carcinoma using a methylation array.
J Korean Med Sci 2010; 25: 1152-9.
20. Yuan Y, Wang J, Li J, Wang L, Li M, Yang Z, Zhang C, Dai JL. Frequent epigenetic inactivation of spleen tyrosine kinase gene in human hepato- cellular carcinoma. Clin Cancer Res 2006; 12: 6687-95.
21. Lu B, Ma Y, Wu G, Tong X, Guo H, Liang A, Cong W, Liu C, Wang H, Wu M, et al. Methylation of Tip30 promoter is associated with poor prognosis