Introduction
Cell therapy is a new advanced method for the treatment of many diseases. Both stem cells and differentiated cells seem appropriate candidates for cell therapy. Mesenchymal stem cells (MSCs) are a well-known candidate for cell ther- apy for several reasons, including ease of in vitro expansion, lack of immune response, and appropriateness for delivery of special proteins to the target tissue [1-3].
MSCs in adipose tissues, which are also called adipose-
derived stem cells (ASCs), are similar to bone marrow stem cells (BMSCs) [4, 5]. ASCs features are highly similar to those of MSCs in terms of morphology, division rate, and pluripotent capacity [6, 7]. Moreover, ASCs have several advantages over BMSCs, such as a higher ratio of isolation from adipose tissue which is almost 40 folds higher than that of BMSCs [8-10], possibility of autologous transplantation of ASCs to reduce the immune response and ethical problems regarding stem cell application [11], and easier isolation and in vitro expansion of ASCs [12]. Therefore, ASCs seem more appropriate and promising for effective cell therapy.
Deprenyl (Dep), an inhibitor of monoamine oxidase B (MAO-B) [13], has been used to treat Parkinson’s disease (PD) since the 1970s [14]. Dep is highly absorbed by the digestive system and passes through the blood-brain-barrier via the circulatory blood system and quickly penetrates the brain and spinal cord and inhibits the MAO-B [15], which in turn,
pISSN 2093-3665 eISSN 2093-3673
Corresponding author:
Maryam Haji Ghasem Kashani
Department of Cellular and Molecular Biology, School of Biology, Damg- han University, Damghan, Iran
E-mail: [email protected]
Expression of neurotrophic factor genes by human adipose stem cells post-induction by deprenyl
Arezoo Amiri, Maryam Haji Ghasem Kashani, Mohammad Taghi Ghorbanian
Department of Cellular and Molecular Biology, School of Biology, Damghan University, Damghan, Iran
Abstract: Human adipose stem cells (hASCs) were introduced as appropriate candidate due to advantages like ease of isolation, in vitro expansion and lack of immune response. Deprenyl (Dep) was used to induce bone marrow stem cells into neuron-like cells. We investigated the Dep effect on neurotrophin genes expression in hASCs and their differentiation into neuron-like cells. The cells were isolated from small pieces of abdominal adipose tissue and subjected to flow cytometry to confirm purification. The osteogenic and adipogenic differentiation were identified. The proliferation rate and neurotrophin genes expression of treated cells were evaluated by MTT, TH immunostaining and RT-PCR. hASCs had positive response to CD44, CD73, CD90, CD105 markers and negative response to CD34 and CD45 markers and differentiated into adipocytes and osteocytes. Exposure to 10–7 M of Dep for 24 hours caused a significant increase of viable cells and BDNF, NTF-3 genes expression as compared to cultured cells in serum free medium and had no effect on the expression of NGF and GDNF genes.
Based on our results, Dep is able to induce BDNF, NTF-3 and NTF-4 genes expression and neroun-like morphology in hASCs.
Key words: Human adipose tissue derived stem cells, Deprenyl, Neurotrophins, Polymerase chain reaction
Received November 12, 2019; 1st Revised January 7, 2020; 2nd Revised June 25, 2020; 3rd Revised October 16, 2020;
Accepted November 3, 2020
causes the inhibition of dopamine catabolism, alleviating the PD symptoms. Dep is also known as an anti-depressive [16], anti-apoptotic [17, 18], and anti-ageing medicine [19, 20]. Furthermore, Dep-induced neural-like morphology oc- curs by the induction of neurotrophic factor gene expression.
Neurotrophins (NTFs) are a group of small proteins neces- sary for the growth, survival, and differentiation of neurons both in the central nervous system and peripheral nervous system [21-23]. NTFs are also able to repair damaged neu- rons in vitro [24, 25].
NTFs are classified into three main groups: 1) neuro- trophin family, including the three subgroups of nerve growth factor (NGF) which promote myelination and differ- entiation of neurons [26, 27], neurotrophin-3 (NTF-3) which is necessary for neuronal survival [28], and brain-derived neurotrophic factor (BDNF) essential for neuron survival [29], 2) the ciliary neurotrophic factor (CNTF family), and 3) glial cell line-derived neurotrophic factor (GDNF) family [30]. Dep can induce neuronal morphology in embryonic stem cells (ESCs) [31]. It also induces the expression of adult neural markers, such as BDNF and NTF-3 in BMSCs [26].
Dep efficiently induced the expression of BDNF, NTF-3, and NGF in more than 82.5% of treated BMSCs [32]. It has been reported that the induction of neuron-like morphol- ogy in treated embryonic carcinoma stem cells by Dep takes place in a dose-dependent manner [33]. The expression of NGF, BDNF and GDNF factors were induced by Dep in cul- tured mouse astrocytes [32, 34, 35]. With this background in mind, we sought to study the effect of Dep on human adipose-derived stem cells (hASCs) in vitro to investigate the possibility of neurotrophic factor genes induction in hASCs and their differentiation into neuron-like cells for further cell therapy of neurodegenerative diseases.
Materials and Methods
Human adipose-derived stem cells isolation
To isolate hASCs, adipose tissue samples were collected from female patients undergoing liposuction (mean age 40±5 years, Velayat Hospital, Damghan, Iran) (IR.SBMU.RIGLD.
REC. 1395. 207). Informed consent was obtained from the participants and approval of the local Ethics Committee at Velayat Hospital (Damghan, Iran). The study was carried out following the guidelines of the Medical Ethics Committee, Ministry of Health of Iran.
Firstly, the samples were cut into very small pieces, and
then 0.2% collagenase (Gibco, 17100-017; Sigma-Aldrich, St.Louis, MO, USA) was added, and the solution was incu- bated at 37°C for 2 hours. To stop digestion, DMEM (Gibco, Invitrogen, Carlsbad, CA, USA) containing 10% fetal bovine serum (FBS) was added to the suspension and centrifuged at 1,200 rpm for 5 minutes at 37°C. Finally, the isolated cells were transferred and cultured in a 25 cm2 flask and incu- bated at 37°C in 5% CO2 for 72 hours. hASCs adhered to the bottom of the flask, while floating blood cells were washed away by changing the medium with a fresh one. Cells were passaged at about 70%–80% of confluency. Experimental groups were as follows: medium, cultured P4-cells in FBS free medium (Dulbecco’s modified minimum essential medium); Medium+FBS, cultured P4-cells in medium containing 10% FBS; Dep10–7+FBS, cultured P4-cells in me- dium+10% FBS containing 10–7 M Dep; and Dep 10–6–Dep 10–10, cultured cells in FBS free medium containing 10–6–10–10 M Dep.
Flow cytometry analysis
Passage 4 of the hASCs was trypsinized and then cen- trifuged at 2000 rpm for 3 minutes at room temperature, resuspended in FACS (phosphate-buffered saline [PBS], 2%
FBS) and incubated on ice for 10 minutes. Then, fluorescence antibodies against CD73-PE (BD Biosciences, San Jose, CA, USA), CD44-FITC (Immunostep), CD105-PE (Exbio/Czech), CD90-FITC (Exbio), CD45-FITC (BD Biosciences), and CD34-PE (Exbio) were added and incubated at 4°C for 30 minutes. After removing the non-conjugated antibodies by three washes, the cells were resuspended in PBS and subject- ed to flow cytometry (BD FACS Calibur; BD Biosciences).
Cell viability
In each group, cultured hASCs were stained by trypan blue and counted with a hemocytometer five times. Suspen- sion of the P4 of hADSCs was trypsinized, and trypan blue was added (10 µl/10 µl) and loaded on a hemocytometer with a pipette tip. Trypan blue penetrates the membranes of dead cells, coloring them blue, it is not absorbed by membranes of live cells, excluding live cells from staining. To perform the count, magnification was ×400, and cell concentration was calculated using the following formula:
Live cells/ml= live cells counted×dilution factor (2)×104/4 squares
hASCs induction to osteoblasts
Induction was performed according to the references [36, 37].
Isolated hASCs of P4 were cultured in 12-well plates, and the medium was replaced with osteogenesis differentiation medium (StemPro Osteogenesis Differentiation Kit, A10072- 01; Invitrogen). About 21 days later, the cells were stained with the Alizarin Red method. Briefly, cells were fixed in 4% formaldehyde for 1 hour at 4°C and then incubated with Alizarin Red for 2 minutes. Then, cells were washed with PBS and observed by an inverted microscope (E600-Eclipse Nikon; Nikon, Tokyo, Japan) equipped with a digital camera (DXM 1200 Camera Nikon Digital, Nikon).
hASCs induction to adipocytes
Based on the protocols [36, 37], the isolated hASCs of P4 were subcultured in 12-well plates containing adipogenesis differentiation medium (StemPro Adipogenesis Differentia- tion Kit, A10070-01; Invitrogen). After 21 days, the cells were fixed and stained with the Oil Red-O method. Briefly, cells were washed with PBS twice and then fixed in 4% formal- dehyde for 1 hour at 4°C. Then, the cells were washed with 70% ethanol for 10–15 minutes and then stained with Oil Red. Finally, cells were washed with 70% ethanol about three times, and microscopic observation was performed to check the results.
Tyrosine hydroxylase immunostaining
Treated cells were cultured on gelatinized coverslips and fixed in 4% paraformaldehyde for 20 minutes at 4ºC. They were then permeabilized in 0.1% Triton X-100 for 15 min- utes and blocked in 10% normal goat serum for 15 minutes.
The cells were incubated with primary antibody (Rabbit anti-tyrosine hydroxylase [TH], AB152, Chemicon, China) overnight at 4ºC. After washing in 0.01 M PBS, the cells were incubated with a secondary antibody (FITC-conjugated anti- rabbit) at 37ºC for 30 minutes. Immunopositive cells were examined using a fluorescent microscope (E600-Eclipse Nikon) equipped with a digital camera (DXM 1200 Camera Nikon Digital).
MTT assay for doubling time evaluation
MTT assay kit was purchased from Sigma (St. Louis, MO, USA) and used according to the standard protocol. The P4- cells were seeded at the density of 2×10⁴ cells/well in sterile 96-well plates containing 200 µl of DMEM+10% FBS. Cell division was evaluated in the presence of various concen-
trations of Dep (purchased from Zahravi Pharmaceutical Co., Tabriz, Iran) ranging from 10–6 to 10–10 M for 24 and 48 hours. Then, the supernatant was discarded and replaced with 100 µl fresh medium plus 10 µl MTT solution (5 mg/ml;
Sigma), and cells were incubated at 37°C for 4 hours. Finally, 85 µl of the medium was replaced with 50 µl of DMSO and incubated for more than 10 minutes. Optical density was measured by an ELISA reader (Biotek, Winooski, VT, USA) at 540 nm. The experiment was repeated five times for each group.
RT-PCR for neurotrophic factor genes expression Reverse transcription polymerase chain reaction (RT- PCR) was performed to evaluate the expression of GDNF, BDNF, NGF, NTF-3, and NTF-4 genes. Briefly, after treat- ment of hASCs with different concentrations of Dep from 10–6 to 10–8 M for 24 hours, total RNA extraction and cDNA synthesis were carried out. Then, synthetic cDNA was used for PCR. The primer sequences for each of the above fac- tors are listed in Table 1. PCR products were evaluated in 1.5% agarose gel and finally, the intensity of gene bands was checked by the Image J software (National Institute of Men- tal Health, Bethesda, MD, USA).
Statistical analysis
All the data is presented as mean±standard error of mean.
To analyze the data, one-way analysis of variance (ANOVA)
Table 1. Primer Sequences and Length of PCR Products of Neurotrophins Genes
Neurotrophic
factor Primer sequence Size (bp)
NGF 174
Forward 5´-ATACAGGCGGAACCACACTCAG-3´
Reverse 5´-GTCCACAGTAATGTTGCGGGTC-3´
BDNF 167
Forward 5´-AGAGGCTTGACATCATTGGCTG-3´
Reverse 5´-CAAAGGCACTTGACTACTGAGCATC-3´
NTF-3 222
Forward 5´-GGGAGATCAAAACGGGCAAC-3´
Reverse 5´-ACAAGGCACACACACAGGAC-3´
NTF-4 141
Forward 5´-CTGTGTGCGATGCAGTCAGT-3´
Reverse 5´-TGCAGCGGGTTTCAAAGAAGT-3´
GDNF 314
Forward 5´-CACCAGATAAACAAATGGCAGTGC-3´
Reverse 5´-CGACAGGTCATCATCAAAGGCG-3´
GAPDH 258
Forward 5´-GCTGGGGCTCATTTGCAGG-3´
Reverse 5´-CGGAGGGGCCATCCACAGT-3´
Fig. 1. Identity of isolated hASCs by flow cytometery. Isolated hASCs were treated with fluorescent antibodies against CD44, CD90, CD73, CD105, CD45, and CD34. The isolated hASCs highly expressed (about 99%) CD44, CD90, CD73, and CD105, but there was no expression of CD45 and CD34 markers. FITC, fluorescein isothiocyanate; FL2-H, fluorescence 2-height; hASCs, human adipose stem cells; PE, phycoerythrin.
Count
104 CD105
100 101 102 103 FL2-H-
3.13%
PE positive 96.9%
0
Count
104 CD90
100 101 102 103 FL1-H-
0.382%
FITC positive 99.6%
0
Count
104 CD44
100 101 102 103 FL1-H-
1.34%
FITC positive 98.7%
0
Count
104 CD73
100 101 102 103 FL2-H-
1.16%
PE positive 98.8%
0
Count
104 CD45
100 101 102 103 FL1-H-
98.1%
FITC positive 1.87%
0
Count
104 CD34
100 101 102 103 FL2-H-
97.6%
PE positive 2.37%
0
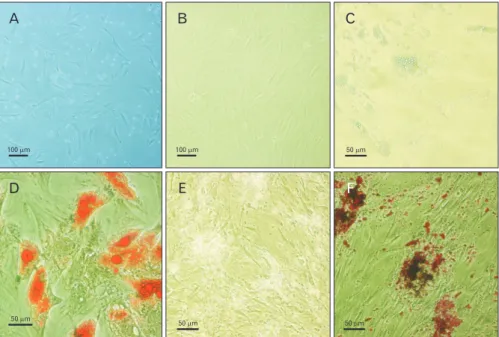
Fig. 2. hASCs isolation and differentiation into osteoblasts and adipocytes. (A) P1 of isolated hASC. There are stem cells and floating blood cells in culture. In P4, hASCs are the only cells in culture (B). Unstained hASCs differentiated into adipocytes (C), Oil Red staining of differentiated cells (D). Unstained hASCs differentiated into osteocytes (E), Alizarin staining of the cells after 21 days of induction proved their differentiation into osteoblasts (F). hASCs, human adipose stem cells.
100 m 100 m 50 m
50 m 50 m
50 m
A B C
D E F
was run using SPSS version 16 (SPSS Inc., Chicago, IL, USA).
P-value of less than 0.05 was considered statistically signifi- cant.
Results
Flow cytometry of hASCs
The identity of isolated hASCs was confirmed by the evaluation of surface markers expression. As the results showed, about 98% of the cells expressed all surface mark- ers (i.e., CD73, CD44, and CD105), except for CD90 that was expressed in approximately 99.6% of the isolated cells.
Moreover, more than 97% of the cells did not express CD34 and CD45 surface markers (Fig. 1). The separated hASCs by flow cytometry revealed the normal morphology of MSCs in culture conditions (Fig. 2A, B).
Induction of hASCs into osteoblasts and adipocytes The pluripotency of the isolated hASCs was evaluated by the differentiation of cells into osteoblasts and adipocytes.
The fourth passage of hASCs was cultured in a specified medium for three weeks. Adipogenic differentiation was confirmed by the formation of small lipid droplets formed
during the first week of treatment and stained with Oil Red (Fig. 2C, D). Osteogenic differentiation was confirmed by the production of calcium phosphate and mineralized extracel- lular matrix in induced cells, which were stained with Aliza- rin Red (Fig. 2E, F).
hASCs proliferation rate at different concentrations of deprenyl
Cell survival rate at different concentrations of Dep (from 10–6 to 10–10 M) for 24 and 48 hours was measured by the hemocytometer method. Exposure to 10–7 M of Dep for 24 hours caused a significant increase in viable cells compared with a similar concentration of incubated cells for 48 hours (Fig. 3). Treated cells for 48 hours showed a decline in cell viability by increasing the concentration of Dep (Fig. 3).
Therefore, Dep at a concentration of 10–7 M for 24 hours in- cubation was selected as the effective dosage and incubation time. There was no significant difference between the treated cells with 10–7 M Dep incubated for 24 hours in the absence and presence of serum (Fig. 3). Results of the dose-response studies of Dep showed an inverted U-shaped relationship be- tween different doses of Dep and optical density. Dep at the concentrations of 10–6 to10–8 M showed a significant increase in absorption compared to the Medium group, with the peak
Fig. 3. Evaluation of Dep toxicity for hASCs. Cells were treated with various concentrations of Dep for 24 and 48 hours. After staining with Trypan blue, the live cells were counted by a hemocytometer. There was a significant increase in the proliferation rate of cells treated with 10–7 M of Dep for 24 hours compared with the same group treated for 48 hours. No significant difference was seen at this concentration in the absence and presence of serum. Dep, deprenyl; Dep 10–7+FBS, cultured cells in medium+10% FBS containing 10–7 M Dep; Dep 10–6–Dep 10–10, cultured cells in medium containing 10–6–10–10 M Dep without serum; FBS, fetal bovine serum; Medium, cultured cells in serum-free medium. *P<0.05.
Medium Dep
10 +FBS
7
Dep 10
6
Dep 10
7
Dep 10
8
Dep 10
9
Dep 10
10
25
20
15
10
cellsAlived(10,000) 5
Deprenyl concentrations 0
*b
a *c d
24 hours 48 hours
d
*b
Medium Dep
10 +FBS
7
Dep 10
6
Dep 10
7
Dep 10
8
Dep 10
9
Dep 10
10
0.14 0.12 0.1 0.08 0.06 0.04 0.02
OD(540nm)
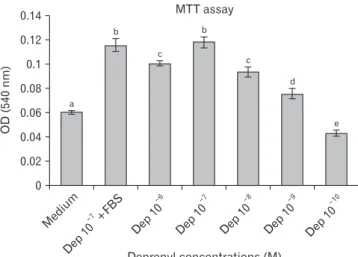
Deprenyl concentrations (M) MTT assay
0 a
b c
d
e b
c
Fig. 4. Evaluation of cell division rate by the MTT assay. To evaluate the division rate of hASCs, MTT assay was performed. hASCs division rate was increased dose dependently. Dep at the concentration of 10–7 M showed a significant increase in division rate as compared to various Dep concentrations and media. Absence and presence of serum did not have any effect at this dose. Dep, deprenyl; Dep 10–
7+FBS, cultured cells in medium+10% FBS containing 10–7 M Dep;
Dep 10–6–Dep 10–10, cultured cells in medium containing 10–6–10–10 M Dep without serum; FBS, fetal bovine serum; Medium, cultured cells in serum-free medium. *P<0.05.
of optical density in 10–7 M Dep.
In addition, co-treatment with 10–7 M Dep and FBS (Dep 10–7+FBS group) showed a significant increase in optical density compared to the Medium group. As there was no significant difference between the “Dep 10–7+FBS” and “Dep 10–7” groups, the proliferative role of Dep was corroborated.
Among all the treatments, the highest increase in optical density was observed in the “Medium+FBS” group. Compar- ing the “Medium+FBS” and “Dep10–7+FBS” groups with the
“Medium” group, we found that Dep had a high proliferation ability.
Evaluation of dividing rate of treated hASCs with different concentrations of deprenyl
hASCs division rate (population doubling time) was evaluated by the MTT assay. hASCs were treated with dif- ferent concentrations of Dep ranging from 10–10 to 10–6 M for 24 hours, and then optical density (540 nm) was measured.
Division rate of induced cells with 10–7 M Dep in serum-free medium was significantly increased as compared to the other doses and medium groups. The division rate in the presence and absence of serum for 10–7 M of Dep was almost identical (Fig. 4). Pretreatment with 10–7 M of Dep caused a significant decrease in the division rate compared to the Medium+FBS group.
Induction of hASCs to neuron
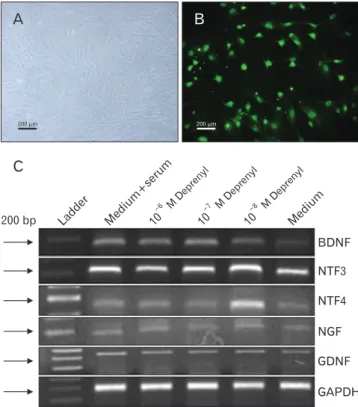
Based on Dep toxicity and MTT assay, 10–7 M of Dep for 24 hours exhibited optimal results for survival and prolif- eration rates of hASCs. Therefore, hASCs were treated with various concentrations of Dep spanning from 10–6 to 10–8 M for 24 hours in the absence of serum. The Dep-induced TH- positive cells in the form of neuron-like cells are shown in Fig. 5A, B. To evaluate the neurotrophin genes expression, RT-PCR was used, and the PCR products were put in 1.5%
agarose gel (Fig. 5C). The intensity of PCR bands for each gene was measured using the Image J software.
The graph obtained from the Image J software indicated a significant increase in BDNF and NTF-3 genes expression in Dep-induced cells, in comparison with cultured cells in the medium (Fig. 6). However, no significant difference was seen
Medium Medium+FBS
Dep 10
6
Dep 10
7
Dep 10
8
3.0 2.5 2.0 1.5 1.0 0.5
Ratioofgenesexpression/GAPDH
Deprenyl concentrations (M) Neurotrophin genes expression
0
*
&
BDNF NTF4/5 NGF NTF3 GDNF
Dep 10
+FBS
8
* *
* * *
*
*
&
#*
Fig. 6. Evaluation of neurotrophin genes expression in induced hASCs. The intensity of PCR product bands was assessed by the Image J software. The results showed a significant increase in BDNF, NTF-3 (all doses of Dep) and NTF-4 (Dep 10–8 M) genes expression as compared to medium, whereas no significant difference in NGF and GDNF genes expression was seen. Dep, deprenyl; FBS, fetal bovine serum; hASCs, human adipose stem cells; Medium, cultured cells in serum-free medium. *Significant increase versus the Medium group,
#Significant increase versus the Dep 10–6 and 10–7 groups, &Significant decrease versus the Dep 10–8 group.
200 m 200 m
C
A B
200 bp
BDNF NTF3 NTF4
NGF GDNF GAPDH
Ladder Medium+serum10 Medium
6 MDeprenyl 10
7 MDeprenyl 10
8 MDeprenyl
Fig. 5. TH immunostaining of differentiated hASCs. Differentiation of hASCs into neuron-like cells after treatment with 10–7 M of deprenyl for 24 hours (A), TH immunopositive cells were observed (B). The intensity of BDNF, NTF-3, and NTF-4 genes bands was higher after deprenyl treatment, whereas NGF and GDNF genes bands were identical with those of untreated cells. GAPDH gene was used as control (C). hASCs, human adipose stem cells; TH, tyrosine hydroxylase.
among various Dep concentrations (10–6–10–8 M).
The expression of NTF-4 gene was significantly increased in 10–8 M Dep-treated cells as compared to the 10–7 and 10–6 M Dep-treated cells. Dep did not have any effect on NGF gene expression, and finally, there was no significant dif- ference in GDNF gene expression among Dep-treated cells.
On the other hand, at all Dep concentrations, GDNF gene expression was almost similar to that in the control group.
Discussion
MSCs are the most appropriate candidates for cell thera- py. So far, BMSCs have been the subject of many studies for cell therapy. However, BMSCs have several drawbacks limit- ing their application, including quick in vitro senescence and the risk of tumorigenesis. hASCs are a kind of MSCs that represent all MSCs’ features [36, 37]. Although replacement of BMSCs with hASCs eliminate nearly all BMSCs disadvan- tages, the risk of tumorigenesis has remained unresolved so far [8, 10]. To resolve this issue, differentiated cells resulted from induced stem cells seem a better candidate than undif- ferentiated stem cells. In this study, we investigated neuro- trophic factor genes expression after the induction of hASCs by Dep and the possibility of hASCs differentiation into neu- ron-like cells for cell therapy of neurodegenerative diseases.
The results showed that the isolated hASCs were able to differentiate into both osteoblasts and adipocytes, proving their pluripotency. This finding is consistent with previous reports [36]. The accuracy of hASCs isolation was approved by flow cytometry, which showed that the purified hASCs expressed surface markers, such as CD73, CD44, and CD105 by about 90% and CD90 by about 99.6%, but they did not express CD45 and CD34 surface markers. These results were also in agreement with previous reports [37].
Neurotrophic factors are important for the growth, im- migration and differentiation of neurons. In this study, we induced NTFs expression by 10–7 M of Dep, which was the highest concentration of Dep with less toxicity for hASCs.
Treated hASCs with 10–7 M of Dep showed about a three- fold higher expression of BDNF and NTF-3 genes, but they did not show any differences in NTF-4 gene expression as compared to the control group. Consistent with this result, Esmaeili et al. [31] reported higher expression of BDNF and NTF-3 genes in mice ESCs following induction by Dep. Uti- lizing neural stem cells, Hassanzadeh et al. [35] obtained al- most similar results; the discrepancy between our results and
those of Hassanzadeh et al. [35] was in NGF induction and the amount of increase in NTFs expression. In both stud- ies, cells were treated with an identical concentration of Dep (10–7 M); however, NGF induction did not take place in our research. Furthermore, Hassanzadeh et al. [35] reported that the mRNA synthesis levels of BDNF, NGF, and NT-3 genes after Dep induction were increased more than three folds.
Using BMSCs, Ghorbanian et al. [32] also reported that Dep successfully induced BDNF, NGF, and NTF-3 genes.
They used Dep at the concentration of 10–8 M. In our study, even hASCs treated with 10–8 M of Dep did not express NGF;
consistent with this result, 10–8 M of Dep did not induce NGF expression in Hassanzadeh et al. [35] study. Inconsistent with Ghorbanian et al. [32] findings, we noted that despite high similarity of hASCs with BMCs, these two cell types are not identical in all features; this is in agreement with Strioga et al. [38] results. The discrepancies in findings of different studies can be attributed to cell line, species and dose differ- ences, which can also explain the inconsistencies of our re- sults with those of Abdanipour et al. [39]. They investigated rat adipose stem cells, while we utilized hASCs. Abdanipour et al. [39] reported higher NTF-4 gene expression and no ex- pression of BDNF gene following Dep treatment (10–9 mM).
In that study, BDNF gene expression in hASCs treated with Dep (10–7 M) increased, while treated cells with 10–8 M of Dep showed high expression of NTF-4 gene. Mizuta et al.
[34] treated mouse astrocytes by 2 mM of Dep and reported higher levels of BDNF, NGF, and GDNF genes expression.
Although BDNF expression was induced at all Dep concen- trations in our study, inconsistent with Mizuta et al. [34] re- sults, none of the Dep concentrations from 10–9 to 10–7 M was able to induce NGF and GDNF genes expression. Maruyama et al. [40] also pointed that Dep, unlike Rasagiline, failed to induce GDNF gene expression in treated glial cells. Dep is able to induce the expression of some of neurotrophic factor genes, such as BDNF, NTF-3, and NTF-4 in hASCs, which is inconsistent with the findings of some former studies.
In general, Dep seems an appropriate inducer factor at the concentration of 10–7 M to induce neurotrophin genes such as BDNF and NTF-3 in hASCs and differentiate them into neuron-like cells that are potentially appropriate candidates for the treatment of some neural disorders. Further studies are warranted to evaluate the effect of induced neuron-like cells in cell therapy of neurodegenerative diseases such as PD and Alzheimer’s disease.
ORCID
Arezoo Amiri: https://orcid.org/0000-0002-9730-681X Maryam Haji Ghasem Kashani:
https://orcid.org/0000-0001-8889-6427 Mohammad Taghi Ghorbanian:
https://orcid.org/0000-0001-8173-5508
Author Contributions
Conceptualization: MHGK. Data acquisition: AA. Data analysis or interpretation: MHGK, MTG. Drafting of the manuscript: AA, MHGK. Critical revision of the manuscript:
MHGK. Approval of the final version of the manuscript: all authors.
Conflicts of Interest
No potential conflict of interest relevant to this article was reported.
Acknowledgements
This work was conducted and funded by the Biology School of Damghan University, Damghan, Iran.
References
1. Ullah I, Subbarao RB, Rho GJ. Human mesenchymal stem cells- current trends and future prospective. Biosci Rep 2015;35:e00191.
2. Volkman R, Offen D. Concise review: mesenchymal stem cells in neurodegenerative diseases. Stem Cells 2017;35:1867-80.
3. Kariminekoo S, Movassaghpour A, Rahimzadeh A, Talebi M, Shamsasenjan K, Akbarzadeh A. Implications of mesenchymal stem cells in regenerative medicine. Artif Cells Nanomed Bio- technol 2016;44:749-57.
4. Frese L, Dijkman PE, Hoerstrup SP. Adipose tissue-derived stem cells in regenerative medicine. Transfus Med Hemother 2016;43:268-74.
5. De Francesco F, Ricci G, D’Andrea F, Nicoletti GF, Ferraro GA.
Human adipose stem cells: from bench to bedside. Tissue Eng Part B Rev 2015;21:572-84.
6. Baer PC. Adipose-derived mesenchymal stromal/stem cells: an update on their phenotype in vivo and in vitro. World J Stem Cells 2014;6:256-65.
7. Lindroos B, Suuronen R, Miettinen S. The potential of adi- pose stem cells in regenerative medicine. Stem Cell Rev Rep 2011;7:269-91.
8. Tabatabaei Qomi R, Sheykhhasan M. Adipose-derived stro-
mal cell in regenerative medicine: a review. World J Stem Cells 2017;9:107-17.
9. Burrow KL, Hoyland JA, Richardson SM. Human adipose- derived stem cells exhibit enhanced proliferative capacity and retain multipotency longer than donor-matched bone marrow mesenchymal stem cells during expansion in vitro. Stem Cells Int 2017;2017:2541275.
10. Ciuffi S, Zonefrati R, Brandi ML. Adipose stem cells for bone tissue repair. Clin Cases Miner Bone Metab 2017;14:217-26.
11. Morizono K, De Ugarte DA, Zhu M, Zuk P, Elbarbary A, Ashjian P, Benhaim P, Chen IS, Hedrick MH. Multilineage cells from adipose tissue as gene delivery vehicles. Hum Gene Ther 2003;14:59-66.
12. Han C, Zhang L, Song L, Liu Y, Zou W, Piao H, Liu J. Hu- man adipose-derived mesenchymal stem cells: a better cell source for nervous system regeneration. Chin Med J (Engl) 2014;127:329-37.
13. Ebadi M, Sharma S, Shavali S, El Refaey H. Neuroprotective ac- tions of selegiline. J Neurosci Res 2002;67:285-9.
14. Pálfi M, Szökó E, Kálmán M. [Molecular mechanisms of the neuroprotective effect of (-)-deprenyl]. Orv Hetil 2006;147:1251- 7. Hungarian.
15. Magyar K. The pharmacology of selegiline. Int Rev Neurobiol 2011;100:65-84.
16. Knoll J. Antiaging compounds: (-)deprenyl (selegeline) and (-)1-(benzofuran-2-yl)-2-propylaminopentane, [(-)BPAP], a selective highly potent enhancer of the impulse propagation mediated release of catecholamine and serotonin in the brain.
CNS Drug Rev 2001;7:317-45.
17. Naoi M, Maruyama W, Inaba-Hasegawa K. Revelation in the neuroprotective functions of rasagiline and selegiline: the in- duction of distinct genes by different mechanisms. Expert Rev Neurother 2013;13:671-84.
18. Magyar K, Szende B. (-)-Deprenyl, a selective MAO-B inhibitor, with apoptotic and anti-apoptotic properties. Neurotoxicology 2004;25:233-42.
19. Miklya I. The significance of selegiline/(-)-deprenyl after 50 years in research and therapy (1965-2015). Mol Psychiatry 2016;21:1499-503.
20. Kapoor VK, Dureja J, Chadha R. Synthetic drugs with anti- ageing effects. Drug Discov Today 2009;14:899-904.
21. Mitre M, Mariga A, Chao MV. Neurotrophin signalling: novel insights into mechanisms and pathophysiology. Clin Sci (Lond) 2017;131:13-23.
22. McAllister AK. Neurotrophins and neuronal differentiation in the central nervous system. Cell Mol Life Sci 2001;58:1054-60.
23. Reichardt LF. Neurotrophin-regulated signalling pathways.
Philos Trans R Soc Lond B Biol Sci 2006;361:1545-64.
24. Deister C, Schmidt CE. Optimizing neurotrophic factor com- binations for neurite outgrowth. J Neural Eng 2006;3:172-9.
25. Schmidt N, Schulze J, Warwas DP, Ehlert N, Lenarz T, War- necke A, Behrens P. Long-term delivery of brain-derived neu- rotrophic factor (BDNF) from nanoporous silica nanoparticles improves the survival of spiral ganglion neurons in vitro. PLoS
One 2018;13:e0194778.
26. Lindsay RM, Alderson RF, Friedman B, Hyman C, Ip NY, Furth ME, Maisonpierre PC, Squinto SP, Yancopoulos GD.
The neurotrophin family of NGF-related neurotrophic factors.
Restor Neurol Neurosci 1991;2:211-20.
27. Keefe KM, Sheikh IS, Smith GM. Targeting neurotrophins to specific populations of neurons: NGF, BDNF, and NT-3 and their relevance for treatment of spinal cord injury. Int J Mol Sci 2017;18:548.
28. Snider WD, Wright DE. Neurotrophins cause a new sensation.
Neuron 1996;16:229-32.
29. Henderson CE. Role of neurotrophic factors in neuronal devel- opment. Curr Opin Neurobiol 1996;6:64-70.
30. Ernsberger U. The role of GDNF family ligand signalling in the differentiation of sympathetic and dorsal root ganglion neu- rons. Cell Tissue Res 2008;333:353-71.
31. Esmaeili F, Tiraihi T, Movahedin M, Mowla SJ. Selegiline in- duces neuronal phenotype and neurotrophins expression in embryonic stem cells. Rejuvenation Res 2006;9:475-84.
32. Ghorbanian MT, Tiraihi T, Mesbah-Namin SA, Fathollahi Y.
Selegiline is an efficient and potent inducer for bone marrow stromal cell differentiation into neuronal phenotype. Neurol Res 2010;32:185-93.
33. Bakhshalizadeh S, Esmaeili F, Houshmand F, Shirzad H, Saedi M. Effects of selegiline, a monoamine oxidase B inhibitor, on differentiation of P19 embryonal carcinoma stem cells, into neuron-like cells. In Vitro Cell Dev Biol Anim 2011;47:550-7.
34. Mizuta I, Ohta M, Ohta K, Nishimura M, Mizuta E, Hayashi K, Kuno S. Selegiline and desmethylselegiline stimulate NGF,
BDNF, and GDNF synthesis in cultured mouse astrocytes. Bio- chem Biophys Res Commun 2000;279:751-5.
35. Hassanzadeh K, Nikzaban M, Moloudi MR, Izadpanah E. Ef- fect of selegiline on neural stem cells differentiation: a possible role for neurotrophic factors. Iran J Basic Med Sci 2015;18:549- 54.
36. Kornicka K, Marycz K, Tomaszewski KA, Marędziak M, Śmieszek A. The effect of age on osteogenic and adipogenic differentiation potential of human adipose derived stromal stem cells (hASCs) and the impact of stress factors in the course of the differentiation process. Oxid Med Cell Longev 2015;2015:309169.
37. Younesi E, Bayati V, Hashemitabar M, Azandeh SS, Bijannejad D, Bahreini A. Differentiation of adipose-derived stem cells into Schwann-like cells: fetal bovine serum or human serum?
Anat Cell Biol 2015;48:170-6.
38. Strioga M, Viswanathan S, Darinskas A, Slaby O, Michalek J.
Same or not the same? Comparison of adipose tissue-derived versus bone marrow-derived mesenchymal stem and stromal cells. Stem Cells Dev 2012;21:2724-52.
39. Abdanipour A, Tiraihi T, Delshad A. Trans-differentiation of the adipose tissue-derived stem cells into neuron-like cells expressing neurotrophins by selegiline. Iran Biomed J 2011;15:113-21.
40. Maruyama W, Naoi M. “70th Birthday Professor Riederer”
induction of glial cell line-derived and brain-derived neuro- trophic factors by rasagiline and (-)deprenyl: a way to a disease- modifying therapy? J Neural Transm (Vienna) 2013;120:83-9.