pISSN 1738-3544 eISSN 2288-1662
Relationships of the Vitamin D and Platelet Indices in Sjögren’s Syndrome
Nahide Ekici Günay 1 , İrfan Buğday 2 , Tayfun Akalın 3
1
Department of Clinical Biochemistry, University of Health Science, Kayseri City Training and Research Hospital, Turkey
2
Department of General Medicine, University of Health Science, Yeşilhisar State Hospital, Kayseri, Turkey
3
Department of General Medicine, Division of Rheumatology, University of Health Science, Kayseri City Training and Research Hospital, Turkey
Primer Sjögren’s Syndrome (pSS) is an autoimmune/inflammatory illness. The platelet indices (PIs) indicate the inflammatory response and activity/severity of many diseases. A vitamin D deficiency is accompanied by the increased tendency of autoimmune diseases. This study investigated whether the vitamin D levels are related to the altered platelet indices in pSS. A total of 261 individuals were included in this analytical cross-sectional study. The laboratory data of pSS patients were evaluated and the relationship between the PIs and vitamin D status was examined. According to these findings, in patients with pSS, the vitamin D levels were lower than the healthy control group ( P <0.05). The vitamin D levels were negatively associated with PDW ( P =0.012), but positively correlated with PCT ( P <0.001). The cut-off point was obtained with receiver operating characteristics (ROC) curves for PDW: 12.53 (AUC 0.921, sensitivity 90%, specificity 85%), for PCT; 0.29 (AUC 0.660, sensitivity 68%, specificity 55%). In multivariate linear regression analysis, the most significant parameters for the effects of PDW are the following:
vitamin D (=−0.373; t=−2.626; sig.=0.013) and plateletcrit (=−0.308; t=−2.13; sig.=0.040).
A vitamin D deficiency may be accompanied by changes in PIs in pSS. A higher PDW and lower PCT supports the underlying inflammation, which may be vitamin D related useful parameters to consider in approaching to pSS.
Key words: Plateletcrit, Platelet distribution width, Sjögren’s syndrome, Vitamin D
Corresponding author: Nahide Ekici Günay Department of Clinical Biochemistry, University of Health Science, Kayseri City Training and Research Hospital, Şeker Mah. Molu Cad.
38080, Turkey Tel: 90-352-315-77-00 Fax: 90-352-336-88-57 E-mail: [email protected]
This is an Open Access article distributed under the terms of the Creative Commons Attribution Non-Commercial License (http://creativecommons.org/licenses/by-nc/4.0) which permits unrestricted non-commercial use, distribution, and reproduction in any medium, provided the original work is properly cited.
Copyright © 2018 The Korean Society for Clinical Laboratory Science. All rights reserved.
Received: September 29, 2018 Revised 1
st: October 20, 2018 Revised 2
nd: October 31, 2018 Accepted: November 1, 2018
INTRODUCTION
Although the development and progression of pSS haven’t been fully elucidated, it is considered that interactions between immune, genetic and environmental factors play a role in the pSS. It is well-accepted that autoimmune diseases lead systemic inflammation [1]. In Turkey, pSS prevalence has been reported as 0.21∼0.35 to 0.72∼1.56, highlighting higher prevalence than those in SLE (0.04%) and RA (0.36%) in parallel to developed countries [2-5].
Studies on vitamin D levels in autoimmune disorders reported comprehensible results [6]. In recent years, it has been suggested that vitamin D is an important envir-
onmental factor that affects the prevalence of auto- immune syndromes via modulation of immune system.
Therefore, it has been suggested that vitamin D deficiency plays a role in the pathogenesis of systemic autoimmune diseases [7]. Both preclinical and clinical studies have provided evidence implying that vitamin D deficiency can cause an increase in the prevalence of systemic lupus erythematosus, asthma, rheumatoid arthritis, systemic vasculitis and antiphospholipid syndrome [8].
Platelet indices are markers that reflect systemic
inflammatory response and activity/severity in many
diseases. It has been shown that platelet indices have
diagnostic value in certain inflammatory and autoimmune
disease [9]. The leukopenia or lymphopenia are used to
describe disease activity in the Sjögren’s Syndrome Damage Index (SSDI) [10, 11]. However, any blood count parameters that can be used for patients without Sjögren’s Syndrome disease activity for co-diagnosis have not been proposed until now. To best of our knowledge, there is no study reporting relationship between vitamin D levels and platelet indices, namely, PDW, MPW, PCT and PLR, in the literature. From this point of view, it was aimed to evaluate plasma vitamin D levels and its relationship with platelet indices in association with Sjögren’s disease.
MATERIALS AND METHODS
1. Study design
This study was conducted at departments of clinical biochemistry and internal medicine, health science University, Kayseri City Training and Research Hospital (Turkey). The study was approved by Local Ethics Committee. The pSS diagnosis was made in department of rheumatology based on validated American-European Consensus Group Classification Criteria [12].
Originally, 289 patients were recruited to the study from rheumatology outpatient clinic between 2013 and 2016.
In all patients recruited, demographic and clinical characteristics including age, gender, joint involvement, sicca symptoms, fatigue, neuropathy and medication were recorded. The exclusion criteria included co-morbid systemic disorders including endocrine diseases, autoimmune disorders, malignancy, liver disease, and presence of non-autoimmune sicca symptoms alone. In addition, patients with primary platelet disorders (autoimmune or acquired thrombocytopenia) causing defective platelet indices were also excluded [13]. Moreover, patients received vitamin D supplement, steroids, anticoagulant or anti-platelet agents within prior 6 months were also excluded. The blood samples for vitamin D level measurements were drawn at maximum sun exposure period (from June to September) to account seasonal effects and standardization.
2. Laboratory evaluations
The blood samples were taken into EDTA tubes (Becton Dickinson, Franklin Lakes, NJ) for complete blood count (CBC) and vitamin D measurements. Vitamin D levels, C-reactive protein (CRP), erythrocyte sedimentation rate (ESR) and CBC parameters including platelet count (PLT), neutrophil count (N), lymphocyte count (L), mean platelet volume (MPV), platelet distribution width (PDW), plate- letecrit (PCT), and platelet-to-lymphocyte ratio (PLR) were measured simultaneously.
In the study group, parameters routinely used in the differential diagnosis of pSS and similar disorders such as serum anti-Sjögren’s syndrome antigen A (SS-A), anti- Sjögren’s syndrome antigen B (SS-B), rheumatoid factor (RF), antinuclear antibody (ANA), anti-double-stranded DNA (anti-dsDNA), ribonucleoprotein antibodies (RNP), anti-Jo-1, Smith antibodies (SM) and anti-sclerosis 70 (anti-Scl70) were recorded. In order to investigate potential relationships at different vitamin D status, patients with pSS were classified in to groups according to different serum vitamin D levels.
CBC was performed by using XN-9000 automated
analyzer (Sysmex Co., Kobe, Japan) via impedance and
platelet specific fluorescent staining method [14]. The
vitami D levels were measured by using Triple Quadrupole
LC-MS analyzer (Thermo Fisher Scientific, USA) via
Atmospheric Pressure Chemical Ionization (APCI)
method. During vitamin D assays, a hexadeuterium-
labeled internal standard (Chromsystem) a Mass Check
brand of control, a multi-level calibrator and a mobile
phase were used. Limit of detection and coefficient of
variation, are <3.75 ng/mL and <6% in LC-MS/MS
method, accepted as reference assay for vitamin D
measurements [15]. ESR was determined by using Micro
Test-1 (Alifax S.P.A, Padova, Italy) analyzer [16]. CRP and
RF levels were measured by using Dade Behring BNII
analyzer (Siemens Healthcare Diagnostics Inc., USA) via
nephelometric method [17]. ANA, SS-A, SS-B, Anti
Ds-DNA, Anti Jo-1, SM, Anti-Scl70 and RNP analyses were
performed by indirect immunofluorescence (IIF), ELISA
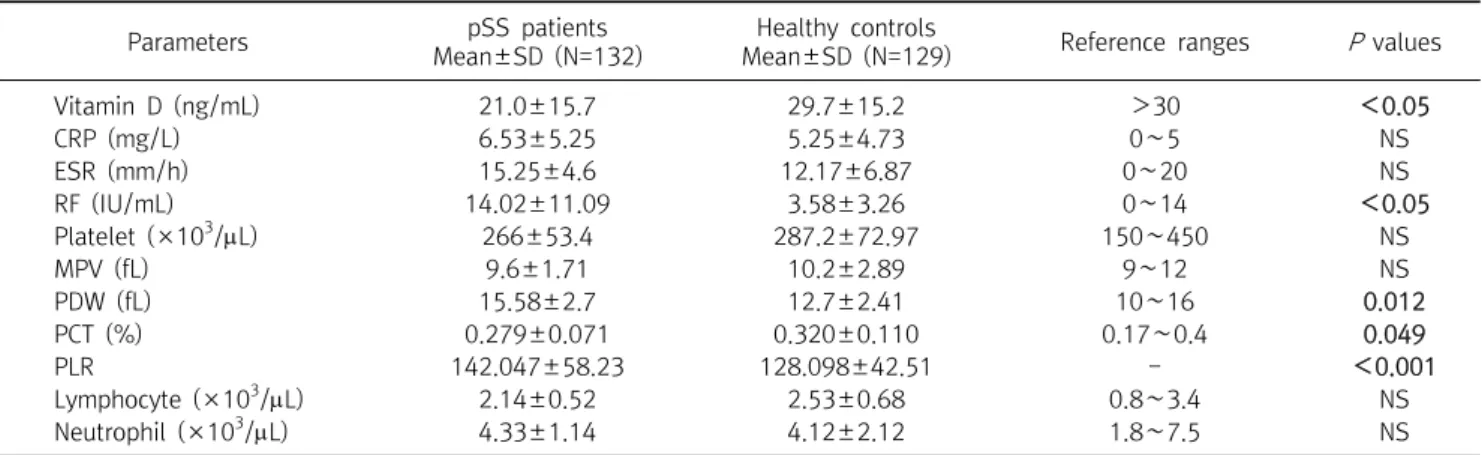
Table 1. The status of hematologic parameters by groups
Parameters pSS patients
Mean±SD (N=132)
Healthy controls
Mean±SD (N=129) Reference ranges P values
Vitamin D (ng/mL) 21.0±15.7 29.7±15.2 >30 <0.05
CRP (mg/L) 6.53±5.25 5.25±4.73 0∼5 NS
ESR (mm/h) 15.25±4.6 12.17±6.87 0∼20 NS
RF (IU/mL) 14.02±11.09 3.58±3.26 0∼14 <0.05
Platelet (×10
3/L) 266±53.4 287.2±72.97 150∼450 NS
MPV (fL) 9.6±1.71 10.2±2.89 9∼12 NS
PDW (fL) 15.58±2.7 12.7±2.41 10∼16 0.012
PCT (%) 0.279±0.071 0.320±0.110 0.17∼0.4 0.049
PLR 142.047±58.23 128.098±42.51 - <0.001
Lymphocyte (×10
3/L) 2.14±0.52 2.53±0.68 0.8∼3.4 NS
Neutrophil (×10
3/L) 4.33±1.14 4.12±2.12 1.8∼7.5 NS
Abbreviations: CRP, C-reactive protein; ESR, erythrocyte sedimentation rate; RF, Romatoid factor; MPV, mean platelet volume; PDW, Platelet distribution width; PCT, Plateletecrit; PLR, platelet-to-lymphocyte ratio; NS, no significance.
and flow cytometry [18].
3. Statistical analysis
The Shapiro Wilk test was used to evaluate normal distribution of data. Continuous variables were presented as Mean±SD. Paired t test was used to compare the continuous variables with normal distribution between matched data set. Pearson’s correlation coefficient test was used to measure the strength of a linear association between vitamin D related variables. ANOVA analysis was used to compare mean values among several groups. A P value <0.05 was considered as statistically significant. A conditional univariate and multivariate linear regression model was used to determine platelet distribution width, vitamin D and other platelet covariates associated with pSS. For PDW and PCT, receiver characteristic curve analysis (ROC) was performed to calculate the optimal cut-off values. Analyses were performed using commercial software (SPSS version 18.0, SPSS Inc., Chicago, IL, USA) The power analysis was performed (by http://clincalc.
com/stats/samplesize.aspx program) to determine sample size with sufficient statistical power to detect a treatment effect.
RESULTS
1. Characteristics of study and control groups
This analytical cross-sectional study included 132
patients with pSS (3 men, 129 women; mean age: 52 years, range: 40.7∼63.3 years) recruited from rheumatology outpatient clinic between 2013 and 2016 and 129 age- and gender-matched healthy controls (3 men, 126 women; mean age: 51.6 years; range: 39.8∼64.7 years. A total of twenty-eight patients were excluded from study due to these follow exclusion criteria: inability to obtain informed consent (N=3), incomplete laboratory data (N=13), malignancy (N=2), platelet disorder (N=1), other autoimmune disorder (N=6), use of anticoagulant or anti-platelet agents (N=3). The power analysis was performed to determine sample size that could provide 95% power at alpha level of 0.05 (http://biostat.mc.
vanderbilt.edu/twiki/bin/view/Main/ PowerSampleSize).
There was no significant difference in N, L, PLT, MPV and ESR values between study and control groups. The PDW was found to be significantly higher in study group than controls (15.58±2.7 fL vs. 12.7±2.41 fL) while no significant difference was found in PCT levels between study and control groups (0.279±0.071 vs.0.320±0.110).
No significant difference was detected in CPR levels between study and control groups while vitamin levels were significantly lower in patients with pSS than controls (21±15.7 ng/mL vs. 29.7±15.2 ng/mL; P<0.05). In addition, RF values were significantly higher in patients with pSS than controls (14.02±11.09 IU/mL vs.
3.58±3.26 IU/mL; P<0.05). RF was found to be negatively
correlated with vitamin D (P<0.001, r s =−0.681),
Table 4. Vitamin D correlations with some demographic and hematologic parameters of patients with primer Sjögren’s syndrome
Parameters Correlation
coefficient (rs) P value
SSDI −0.126* 0.047
Platelet(×10
3/L) 0.414 0.075
MPV(fL) 0.419 0.074
PDW(fL) −0.408* 0.012
PCT(%) 0.646** <0.001
PLR 0.103 0.103
Lymphocyte(×10
3/L) 0.045 0.617
Neutrophil(×10
3/L) −0.061 0.499
Monocyte 0.102 0.262
Eosinophils 0.015 0.869
Basophil −0.092 0.309
ESR 0.097 0.495
RF −0.681** 0.004
Eosinophils 0.015 0.869
**Correlation is significant at the 0.01 level (2-tailed),
*Correlation is significant at the 0.05 level (2-tailed).
Abbreviations: SSDI, Sjögren’s Syndrome Damage Index; MPV, Mean platelet volume; PDW, Platelet distribution width; PCT, Plateletecrit; PLR, platelet-to-lymphocyte ratio; ESR, erythrocyte sedimentation rate; RF, Romatoid factor.
Table 2. Clinical characteristics of patients with Sjögren’s syndrome Characteristics Mean (min-max or %)
Age (years) 52 (28∼72)
Gender (female) (N(%)) 129 (3)
Cigarette (yes/no) 29/103
Disease duration (months) 40 (38.6∼144.36) Duration of diagnosis (months) 15 (8.5∼50.19) Articular involvement (N(%)) 122 (93)
Sicca symptoms (N(%)) 124 (94)
Change in fatigue (N(%)) 72 (67) Neuropathy-lymphoma (N(%)) 1 (0.8) Symptoms on diagnosis
Sicca (N(%)) 118∼89 (75.4)
Joint (N(%)) 112∼85 (75.8)
Other (N(%)) 20 (15-75)
Treatment
Hdyroxychloroqine (N(%)) 118 (89) Hdyroxychloroqine (N(%)) 131 (79)
Methotrexate (N(%)) 3 (2.2)
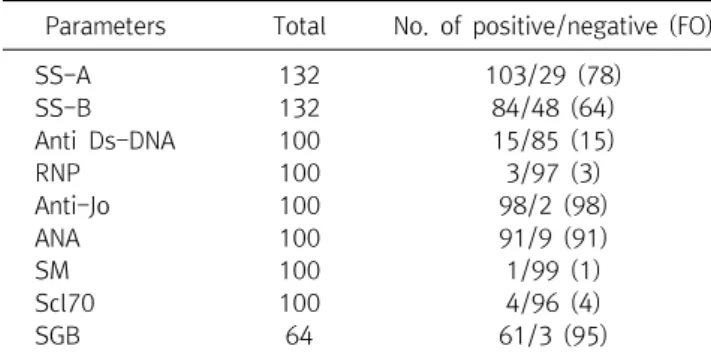
Table 3. Autoantibody profiling and frequency of autoantibodies in patients with pSS
Parameters Total No. of positive/negative (FO)
SS-A 132 103/29 (78)
SS-B 132 84/48 (64)
Anti Ds-DNA 100 15/85 (15)
RNP 100 3/97 (3)
Anti-Jo 100 98/2 (98)
ANA 100 91/9 (91)
SM 100 1/99 (1)
Scl70 100 4/96 (4)
SGB 64 61/3 (95)
Abbreviations: FO, Frequency of occurrence(%); SS-A, anti-Sjögren’s Syndrome antigen A; SS-B, anti-Sjögren’s Syndrome antigen B;
Anti Ds-DNA, Anti-double stranded DNA; RNP, Anti-RNP antibody;
Anti-Jo, antihistidyl ANA, antinuclear antibody; SM, Smith antigen;
Scl70, Anti-Scl70 antigen; SGB, salivary gland biopsy.
plateletecrit (P<0.001, r s =0.664) and platelet counts (P<
0.004, r s =0.600) in patients with pSS. No significant correlation was found between vitamin D levels and CRP or ESR in patients with pSS (Table 1).
2. Study group characteristics
In pSS group, only 3 patients were male. Mean age was 52±11.26 years in the study group. Disease duration was estimated as 40±21 months (median, min-max: 36.5∼
36.127). Mean time from diagnosis was found to be 19±18 months (median, min-max: 18.5∼19.70). In the study group, sicca symptoms were present in 94% whereas joint
involvement in 93% and fatigue in 67% (Table 2). Salivary gland biopsy was performed in 64 patients, revealing diagnostic findings in 61 patients; however, it was non-diagnostic in remaining 3 patients. When auto- antibody profile was considered, it was seen that SS-A and SS-B auto-antibodies were available in all patients.
Positive SS-A and SS-B results were found in 78% and 64%
of patients, respectively. Anti-DsDNA, RNP, anti-Jo, ANA, SM and Scl70 antibodies were found to be present in 15%, 3%, 98%, 91%, 1% and 4%, respectively (Table 3).
In correlation analyses, a significant, negative correlation was found between vitamin D and RF (r s =−0.681, P<
0.005) while a weak correlation was detected between low vitamin D levels and SSDI scores (r s =−0.126, P<0.05).
Further, the vitamin D correlations were revealed with some platelet indices in patients with pSS (for PDW, r s =
−0.408, P<0.01 and for PCT r s = 0.646, P<0.001; Table 4).
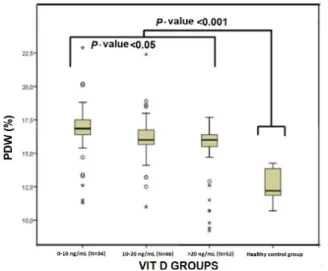
The patients with pSS were stratified into 3 groups
according to vitamin D levels: group I (severe deficiency)
(N=34), group II (deficiency) (N=46) and group III
(sufficient) (N=52). Mean vitamin D levels were 6.8±1.8
ng/mL, 16.3±1.7 ng/mL and 21±3.2 ng/mL in group I, II
Table 5. The status of hematologic parameters by groups
Parameters
Group I Vitamin D
<10 ng/mL Mean±SD
(N=34))
Group II Vitamin D 10∼20 ng/mL
Mean± SD (N=46)
Group III Vitamin D
>20 ng/mL Mean±SD
(N=52)
P values
Vitamin D (ng/mL) 6.81±1.8
a,b16.3±1.7
a,c21±3.2
b,c<0.001
PDW (fL) 17.48±1.74
a16.3±1.41 15.1±1.36
c0.024
PCT (%) 0.259±0.491 0.275±0.028 0.278±0.324 0.028
a
Shows the groups which differs according to the Group III.
b
Shows the groups which are different according to Group II.
c