Received:January 24, 2018, Revised:February 27, 2018, Accepted:February 28, 2018 Corresponding to:Sang-Won Lee http://orcid.org/orcid.org/0000-0002-8038-3341
Division of Rheumatology, Department of Internal Medicine, Yonsei University College of Medicine, 50-1 Yonsei-ro, Seodaemun-gu, Seoul 03722, Korea. E-mail:[email protected]
Copyright ⓒ 2018 by The Korean College of Rheumatology. All rights reserved.
This is a Open Access article, which permits unrestricted non-commerical use, distribution, and reproduction in any medium, provided the original work is properly cited.
Hemoglobin A1c, Not Glycated Albumin, Can Independently
Reflect the Ankylosing Spondylitis Disease Activity Score
Sejin Byun, Seung Min Jung, Jason Jungsik Song, Yong-Beom Park, Sang-Won Lee
Division of Rheumatology, Department of Internal Medicine, Yonsei University College of Medicine, Seoul, Korea
Objective. This study examined whether glycated hemoglobin (HbA1c) and glycated albumin (GA) are well correlated with the
Ankylosing Spondylitis Disease Activity Score (ASDAS)-erythrocyte sedimentation rate (ESR), and ASDAS-C-reactive protein (CRP) in AS patients without medical conditions affecting the glycated protein levels. Methods: The data of 76 patients with AS were analyzed. Univariate and multivariate analyses of the variables associated with ASDAS-ESR and ASDAS-CRP were per-formed using a linear regression test. The patients were divided into active and inactive AS groups based on an ASDAS-CRP of 2.1, and the variables between the two groups were compared. Results. ASDAS-ESR did not correlated with either HbA1c or GA. ASDAS-CRP was positively correlated with HbA1c (r=0.315, p=0.006) and the white blood cell (r=0.288, p=0.012), and inversely correlated with hemoglobin (r=−0.241, p=0.036) and serum albumin (r=−0.262, p=0.022), but not GA. Multivariate analysis revealed HbA1c and white blood cell to be significantly correlated with ASDAS-CRP (β=0.234, p=0.033 and β=0.265, p=0.017). The mean HbA1c, not GA, of the active group was significantly higher than that of the in-active group (p=0.020). In addition, the optimal cut-off value of HbA1c was set to 5.6, and the patients with HbA1c ≥5.6 were found to have a 3.3 times higher risk of active AS than those without. Conclusion. HbA1c was significantly correlated with ASDAS-CRP, and could be a useful marker to reflect ASDAS-CRP in AS patients without medical conditions affecting the gly-cated protein levels. (J Rheum Dis 2018;25:131-139)
Key Words. Ankylosing spondylitis, Glycated hemoglobin A, Glycosylated serum albumin
INTRODUCTION
Ankylosing spondylitis (AS) is a chronic inflammatory disease that has characteristics of both articular and ex-tra-articular manifestations ranging from inflammatory back pain to uveitis [1]. Before the era of biological dis-ease modifying anti-rheumatic drugs (bDMARDs), the primary goal of therapeutic strategies for AS were to re-duce pain and improve the daily activity through conven-tional synthetic DMARDs (csDMARDs). Despite the use of csDMARDs, however, the progression of AS could not easily delayed or modified at all [2]. Meanwhile, bDMARDs can directly quench the inflammatory response of AS, and in turn, it can minimize AS progression at earlier phase and prevent its systemic complications [3]. Thus, if we
can precisely assess the disease activity of AS and not miss the proper time to start bDMARDs, we may expect a good prognosis in AS patients.
However, since the entity of AS is mainly characterized by localized inflammation, especially confined to axial joints, there have been discrepancies between conven-tional inflammatory markers, including erythrocyte sed-imentation rate (ESR) or C-reactive protein (CRP) and the disease activity of AS in a considerable number of pa-tients [4]. In the clinical settings, Bath Ankylosing Spon-dylitis Disease Activity Index (BASDAI) is the most wide-ly used tool to assess the disease activity of AS for its convenience. But BASDAI has a limitation that it does not include physician’s assessment nor objective evidence of inflammation, because it consists of only patient-reported
items [5]. To complement it, a new composite index, Ankylosing Spondylitis Disease Activity Score (ASDAS), has been suggested. It adds objective laboratory findings including ESR and CRP to patient-reported items (ASDAS- ESR and ASDAS-CRP) [6]. However, so far, there has been no single serum marker to reflect the disease activity of AS.
Glycated proteins, which are produced through non-en-zymatic reaction between sugars and free amino groups of proteins, can be formed in diverse pathological or phys-iological conditions such as diabetes mellitus and inflam-mation [7,8]. Glycated hemoglobin (HbA1c) and glycated albumin (GA) are glycated proteins and they can identify plasma glucose concentration in different follow-up dura-tions [9,10]. Moreover, HbA1c and GA were recently re-ported that they could reflect and monitor the inflam-matory burdens [11,12]. But there has been no report re-garding the association of HbA1c and GA with the disease activity of AS yet. Hence, in this study, we investigated whether glycated proteins, HbA1c and GA, are adjunctive markers to be well correlated with ASDAS-ESR and ASDAS-CRP in AS patients, who had normal laboratory results including HbA1c, GA and fasting glucose, and who had no medical history of abnormal glucose metabo-lism and other medical conditions affecting glycated pro-tein levels.
MATERIALS AND METHODS
Patients
We consecutively enrolled 94 patients with AS in this study from March 2015 to October 2015 according to the inclusion criteria as follows: (i) patients who fulfilled modified New York criteria for AS [13], and who had been classified at the Division of Rheumatology, Yonsei Uni-versity College of Medicine, Severance Hospital; (ii) pa-tients who had no medical history which can influence on the turnover of albumin and red blood cell, including oth-er autoimmune diseases othoth-er than AS [12], diabetes mellitus [14], thyroid disease [15], nephrotic syndrome [16], chronic liver diseases [17], and haemolytic anaemia [18] identified by 10th revised international classification of diseases; (iii) patients who had never received medi-cations for those diseases searched by the Korean Drug Utilization Review system; (iv) patients who had no con-current infection and malignancy to enhance acute re-actants levels; (v) patients who gave informed consent to their participation; (vi) patients who took clinical
assess-ment by independent physician on the same day of labo-ratory tests; (vii) patients having labolabo-ratory results ful-filling the following criteria: fasting glucose <126 mg/dL, HbA1c <6.5%, platelet count >150,000/mm3, creatinine ≤1.3 mg/dL or estimated glomerular filtration rate by the Chronic Kidney Disease Epidemiology Collaboration >60 mL/min/1.73 m2, serum albumin ≥ 3.5 mg/dL, alkaline phosphatase ≤115 IU/L, aspartate aminotransferase ≤40 IU/L, alanine aminotransferase ≤ 40 IU/L. We excluded 7 of 94 patients due to medical con-ditions and 11 of the rest due to the laboratory results ex-ceeding normal values. Finally, we included 76 patients with AS in this study. Demographic features included age, gender, smoking history, body mass index (BMI), the fol-low-up duration and the use of glucocorticoid and anti-tu-mour necrosis factor agents. This study was approved by the Institutional Review Board of Severance Hospital (no. 4-2015-0802). Informed consent was obtained from all patients.
Laboratory tests and disease activity assessment
HbA1c levels were measured via automated COBAS INTEGRA 800 (Roche Diagnostics, Mannheim, Germany). GA levels were measured using a Hitachi 7600-120 auto-matic analyser (Hitachi, Tokyo, Japan) and an enzyauto-matic method and an albumin detection reagent (Lucica GA-L; Asahi Kasei Pharma Co., Tokyo, Japan). We selected items of laboratory tests, which are routinely performed at each regular visit, as described in Table 1. ASDAS-ESR and ASDAS-CRP were also obtained by the equations as below: 0.08×Back Pain+0.07×Duration of Morning Stiffness+0.11×Patient Global+0.09×Peripheral Pain/ Swelling+0.29× for ASDAS-ESR and 0.12×Back
Pain+0.06×Duration of Morning Stiffness+0.11×Patient Global+0.07× Peripheral Pain/Swelling+0.58×Ln (CRP+ 1) [6,19]. Also we assessed the disease activity of AS such as BASDAI [5], Bath Ankylosing Spondylitis Functional Index (BASFI) [20], and Bath Ankylosing Spondylitis Patient Global Score (BAS-G) [21].
Statistical analysis
All statistical analyses were conducted using the IBM SPSS package for Windows version 23.0 (IBM Co., Armonk, NY, USA). Continuous variables were expressed as median (interquartile range) or mean±standard deviation. Correlations between variables were determined by the Pearson rank test. Univariate analysis of the associ-ation of variables with ASDAS-ESR and ASDAS-CRP was
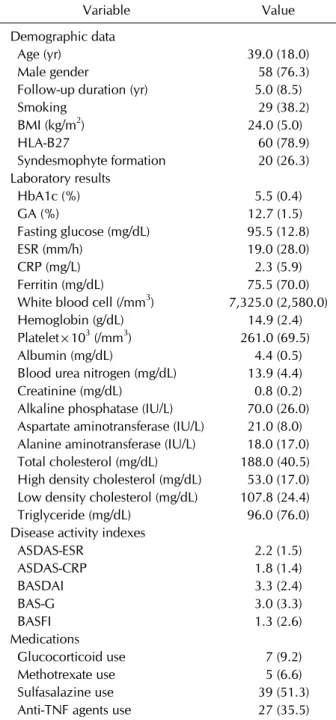
Table 1. Baseline characteristics of patients with ankylosing spondylitis (n=76) Variable Value Demographic data Age (yr) 39.0 (18.0) Male gender 58 (76.3) Follow-up duration (yr) 5.0 (8.5) Smoking 29 (38.2) BMI (kg/m2) 24.0 (5.0) HLA-B27 60 (78.9) Syndesmophyte formation 20 (26.3) Laboratory results HbA1c (%) 5.5 (0.4) GA (%) 12.7 (1.5) Fasting glucose (mg/dL) 95.5 (12.8) ESR (mm/h) 19.0 (28.0) CRP (mg/L) 2.3 (5.9) Ferritin (mg/dL) 75.5 (70.0) White blood cell (/mm3) 7,325.0 (2,580.0)
Hemoglobin (g/dL) 14.9 (2.4) Platelet×103 (/mm3) 261.0 (69.5)
Albumin (mg/dL) 4.4 (0.5) Blood urea nitrogen (mg/dL) 13.9 (4.4) Creatinine (mg/dL) 0.8 (0.2) Alkaline phosphatase (IU/L) 70.0 (26.0) Aspartate aminotransferase (IU/L) 21.0 (8.0) Alanine aminotransferase (IU/L) 18.0 (17.0) Total cholesterol (mg/dL) 188.0 (40.5) High density cholesterol (mg/dL) 53.0 (17.0) Low density cholesterol (mg/dL) 107.8 (24.4) Triglyceride (mg/dL) 96.0 (76.0) Disease activity indexes
ASDAS-ESR 2.2 (1.5) ASDAS-CRP 1.8 (1.4) BASDAI 3.3 (2.4) BAS-G 3.0 (3.3) BASFI 1.3 (2.6) Medications Glucocorticoid use 7 (9.2) Methotrexate use 5 (6.6) Sulfasalazine use 39 (51.3) Anti-TNF agents use 27 (35.5) Values are expressed as median (interquartile range, IQR) or number (%). BMI: body mass index, HLA: human leukocyte antigen, HbA1c: hemoglobin A1c, GA: glycated albumin, ESR: erythrocyte sedimentation rate, CRP: C-reactive protein, ASDAS: ankylosing spondylitis disease activity score, BASDAI: bath ankylosing spondylitis disease activity index, BAS-G: bath ankylosing spondylitis patient global score, BASFI: bath ankylosing spondylitis disease activity functional index, TNF: tumour necrosis factor.
performed using linear regression test. Standardized cor-relation coefficient was assessed by a multivariate linear regression test using variables with significant differ-ences on univariate analysis. The chi-square test and Fisher’s exact test were used for significant differences of categorical data between the two groups. We used Student’s t-test or Mann-Whitney U-test to compare continuous variables between the two groups. p-values less than 0.05 were considered statistically significant.
RESULTS
Baseline characteristics of patients with ankylosing
spondylitis
Baseline characteristics are summarized in Table 1. The median age of patients was 39.0 years old (58 men and 18 women), and the median follow-up duration was 8.1 years. Twenty nine of patients (38.2%) had smoking his-tory, and the median BMI was 24.0 kg/m2. Human leuko-cyte antigen B27 was detected in 60 patients (79.0%). The median HbA1c, GA and fasting glucose were 5.5%, 12.7% and 95.5 mg/dL, respectively. The median ESR and CRP were 19.0 mm/hour and 2.3 mg/L. The median ASDAS-ERS and ASDAS-CRP were 2.2 and 1.8, and the median BASDAI, BAS-G and BASFI were assessed as 3.3, 3.0 and 1.3, respectively. Seven patients had ever received glucocorticoid and 27 patients had done anti-tumor ne-crosis factor (TNF) agents.
Correlation of between glycated proteins and
dis-ease activity
We evaluated the correlation of HbA1c and GA with the disease activity indices of AS. HbA1c was remarkably cor-related with GA, fasting glucose and BMI (r=0.400, r=0.405 and r=0.227, p<0.005 for all). HbA1c showed significantly positive correlation with ASDAS-CRP (r= 0.315, p=0.006), but not ASDAS-ERS (r=0.220, p=0.560). Also, HbA1c was meaningfully correlated with BASDAI (r=0.226) and BAS-G (r=0.401), but not BASFI (r=0.124). On the other hands, GA exhibited no significant correla-tion with any disease activity index of AS (Supplementary Table 1).
Univariate and multivariate analyses of ASDAS-ESR
and other variables
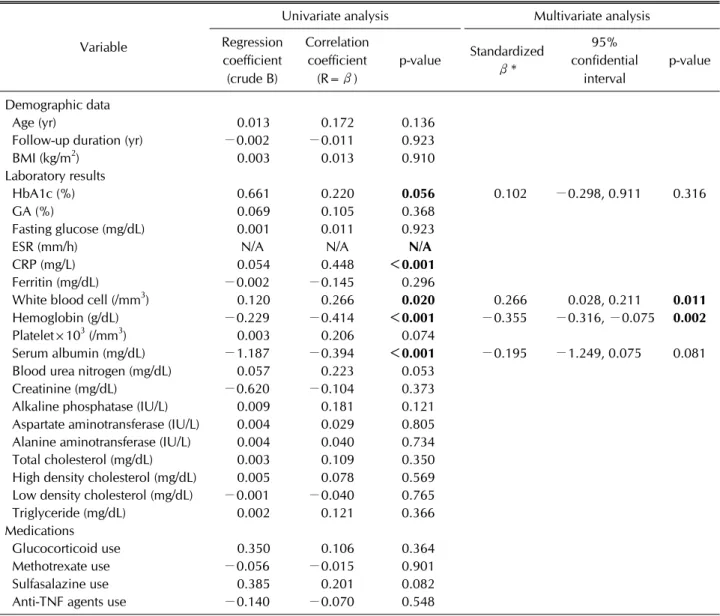
Univariate linear regression analysis revealed that ASDAS-ESR was positively correlated with white blood cell (r=0.266, p=0.020) and inversely correlated with
he-Table 2. Univariate and multivariate analysis of ASDAS-ESR and other variables
Variable
Univariate analysis Multivariate analysis Regression coefficient (crude B) Correlation coefficient (R=β) p-value Standardized β* 95% confidential interval p-value Demographic data Age (yr) 0.013 0.172 0.136 Follow-up duration (yr) −0.002 −0.011 0.923 BMI (kg/m2) 0.003 0.013 0.910
Laboratory results
HbA1c (%) 0.661 0.220 0.056 0.102 −0.298, 0.911 0.316 GA (%) 0.069 0.105 0.368
Fasting glucose (mg/dL) 0.001 0.011 0.923 ESR (mm/h) N/A N/A N/A
CRP (mg/L) 0.054 0.448 <0.001
Ferritin (mg/dL) −0.002 −0.145 0.296
White blood cell (/mm3) 0.120 0.266 0.020 0.266 0.028, 0.211 0.011
Hemoglobin (g/dL) −0.229 −0.414 <0.001 −0.355 −0.316, −0.075 0.002
Platelet×103 (/mm3) 0.003 0.206 0.074
Serum albumin (mg/dL) −1.187 −0.394 <0.001 −0.195 −1.249, 0.075 0.081 Blood urea nitrogen (mg/dL) 0.057 0.223 0.053
Creatinine (mg/dL) −0.620 −0.104 0.373 Alkaline phosphatase (IU/L) 0.009 0.181 0.121 Aspartate aminotransferase (IU/L) 0.004 0.029 0.805 Alanine aminotransferase (IU/L) 0.004 0.040 0.734 Total cholesterol (mg/dL) 0.003 0.109 0.350 High density cholesterol (mg/dL) 0.005 0.078 0.569 Low density cholesterol (mg/dL) −0.001 −0.040 0.765 Triglyceride (mg/dL) 0.002 0.121 0.366 Medications
Glucocorticoid use 0.350 0.106 0.364 Methotrexate use −0.056 −0.015 0.901 Sulfasalazine use 0.385 0.201 0.082 Anti-TNF agents use −0.140 −0.070 0.548
ASDAS: ankylosing spondylitis disease activity score, ESR: erythrocyte sedimentation rate, BMI: body mass index, HbA1c: hemoglobin A1c, GA: glycated albumin, CRP: C-reactive protein, TNF: tumour necrosis factor, N/A: not available. *CRP was not included in multivariate analysis, because CRP is a variable closely correlated with ESR (ASDAS-ESR) in inflammation in order not to confound the interpretation of statistical results.
moglobin (r=−0.414, p<0.001) and serum albumin (r= −0.394, p<0.001). ASDAS-ESR showed a tendency to correlate with Hb1AC, but it was not statistically sig-nificant (r=0.220, p=0.056). ASDAS-ESR was not corre-lated with GA (Table 2). We included HbA1c in multi-variate analysis, because its p-value was almost near the statistical significance. However, on multivariate linear regression analysis, only white blood cell and hemoglobin were significantly correlated with ASDAS-ESR (β=0.266, p=0.011 and β=−0.355, p=0.002).
Univariate and multivariate analyses of ASDAS-CRP
and other variables
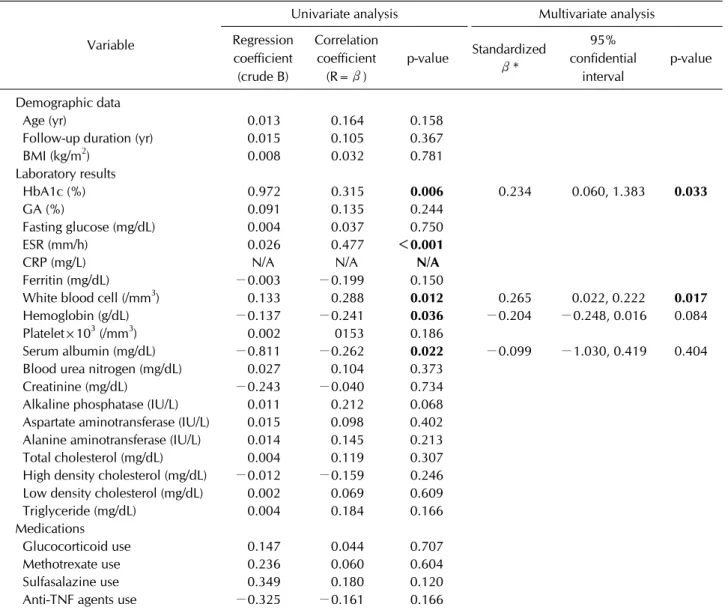
Univariate linear regression analysis discovered that ASDAS-CRP was positively correlated with HbA1c (r= 0.315, p=0.006) and white blood cell (r=0.288, p=0.012) and inversely correlated with haemoglobin (r=−0.241, p=0.036) and serum albumin (r=−0.262, p=0.022). ASDAS-CRP was not correlated with GA. On multiva-riate linear regression analysis, HbA1c and white blood cell were still significantly correlated with ASDAS-CRP (β=0.234, p=0.033 and β=0.265, p=0.017) (Table 3). Also, we analyzed correlation between the use of
medi-Table 3. Univariate and multivariate analysis of ASDAS-CRP and other variables
Variable
Univariate analysis Multivariate analysis Regression coefficient (crude B) Correlation coefficient (R=β) p-value Standardized β* 95% confidential interval p-value Demographic data Age (yr) 0.013 0.164 0.158 Follow-up duration (yr) 0.015 0.105 0.367 BMI (kg/m2) 0.008 0.032 0.781 Laboratory results HbA1c (%) 0.972 0.315 0.006 0.234 0.060, 1.383 0.033 GA (%) 0.091 0.135 0.244 Fasting glucose (mg/dL) 0.004 0.037 0.750 ESR (mm/h) 0.026 0.477 <0.001
CRP (mg/L) N/A N/A N/A
Ferritin (mg/dL) −0.003 −0.199 0.150
White blood cell (/mm3) 0.133 0.288 0.012 0.265 0.022, 0.222 0.017
Hemoglobin (g/dL) −0.137 −0.241 0.036 −0.204 −0.248, 0.016 0.084 Platelet×103 (/mm3) 0.002 0153 0.186
Serum albumin (mg/dL) −0.811 −0.262 0.022 −0.099 −1.030, 0.419 0.404 Blood urea nitrogen (mg/dL) 0.027 0.104 0.373
Creatinine (mg/dL) −0.243 −0.040 0.734 Alkaline phosphatase (IU/L) 0.011 0.212 0.068 Aspartate aminotransferase (IU/L) 0.015 0.098 0.402 Alanine aminotransferase (IU/L) 0.014 0.145 0.213 Total cholesterol (mg/dL) 0.004 0.119 0.307 High density cholesterol (mg/dL) −0.012 −0.159 0.246 Low density cholesterol (mg/dL) 0.002 0.069 0.609 Triglyceride (mg/dL) 0.004 0.184 0.166 Medications
Glucocorticoid use 0.147 0.044 0.707 Methotrexate use 0.236 0.060 0.604 Sulfasalazine use 0.349 0.180 0.120 Anti-TNF agents use −0.325 −0.161 0.166
ASDAS: ankylosing spondylitis disease activity score, CRP: C-reactive protein, BMI: body mass index, HbA1c: hemoglobin A1c, GA: glycated albumin, ESR: erythrocyte sedimentation rate, TNF: tumour necrosis factor, N/A: not available. *ESR was not included in multivariate analysis, because ESR is a variable closely correlated with CRP (ASDAS-CRP) in inflammation in order not to confound the interpretation of statistical results.
cations and ASDAS indexes, there was no statistical sig-nificance (Tables 2 and 3).
Comparison of variables between patients with
ac-tive and inacac-tive AS based on ASDAS-CRP >2.1
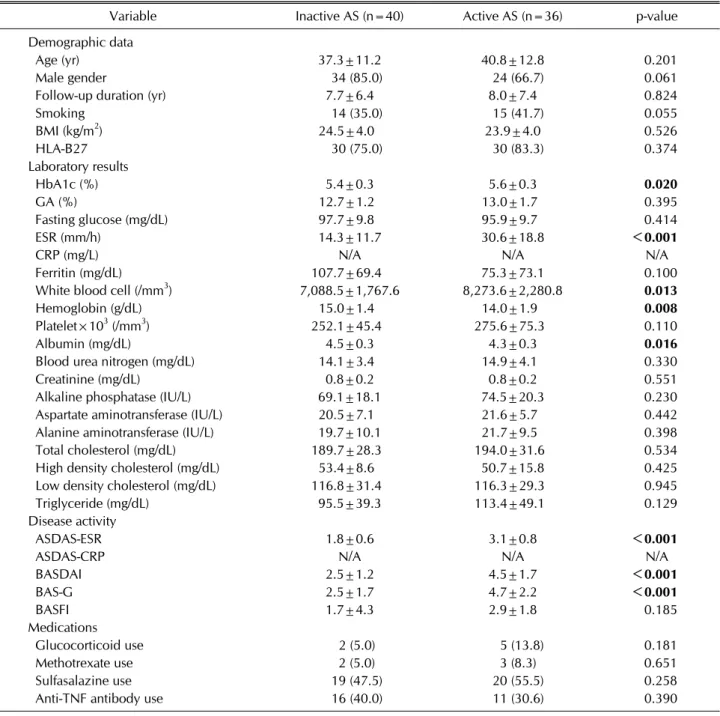
When patients with AS had ASDAS-CRP >2.1, they can be considered to have high or very high disease activity. Since HbA1c showed a significant correlation with ASDAS- CRP, but not ASDAS-ESR, we divided patients into active (40 patients) and inactive (36 patients) groups, based on ASDAS-CRP >2.1. There were no significant differences in demographic data between the two groups. The mean
HbA1c of patients in active group was significantly higher than that of patients in inactive group (5.6 vs. 5.4, p=0.020), but the mean GA did not differ between the two groups (Table 4). Patients in active group showed the higher mean ESR and white blood cell, whereas, than the lower mean hemoglobin and serum albumin than those in in-active group (30.6 vs. 14.3, p<0.001, 8,273.6 vs. 7,088.5, p=0.013, 14.0 vs. 15.0, p=0.008 and 4.3 vs. 4.5, p=0.016, respectively). The mean ASDAS-ESR, BASDAI and BAS-G in active group were significantly higher than those in in-active group. On the other hand, the frequency of gluco-corticoid, methotrexate, sulfasalazine and TNF
anti-Table 4. Comparison variables between patients with active and inactive ankylosing spondylitis based on ASDAS-CRP >2.1
Variable Inactive AS (n=40) Active AS (n=36) p-value Demographic data
Age (yr) 37.3±11.2 40.8±12.8 0.201 Male gender 34 (85.0) 24 (66.7) 0.061 Follow-up duration (yr) 7.7±6.4 8.0±7.4 0.824 Smoking 14 (35.0) 15 (41.7) 0.055 BMI (kg/m2) 24.5±4.0 23.9±4.0 0.526 HLA-B27 30 (75.0) 30 (83.3) 0.374 Laboratory results HbA1c (%) 5.4±0.3 5.6±0.3 0.020 GA (%) 12.7±1.2 13.0±1.7 0.395 Fasting glucose (mg/dL) 97.7±9.8 95.9±9.7 0.414 ESR (mm/h) 14.3±11.7 30.6±18.8 <0.001
CRP (mg/L) N/A N/A N/A
Ferritin (mg/dL) 107.7±69.4 75.3±73.1 0.100 White blood cell (/mm3) 7,088.5±1,767.6 8,273.6±2,280.8 0.013
Hemoglobin (g/dL) 15.0±1.4 14.0±1.9 0.008
Platelet×103 (/mm3) 252.1±45.4 275.6±75.3 0.110
Albumin (mg/dL) 4.5±0.3 4.3±0.3 0.016
Blood urea nitrogen (mg/dL) 14.1±3.4 14.9±4.1 0.330 Creatinine (mg/dL) 0.8±0.2 0.8±0.2 0.551 Alkaline phosphatase (IU/L) 69.1±18.1 74.5±20.3 0.230 Aspartate aminotransferase (IU/L) 20.5±7.1 21.6±5.7 0.442 Alanine aminotransferase (IU/L) 19.7±10.1 21.7±9.5 0.398 Total cholesterol (mg/dL) 189.7±28.3 194.0±31.6 0.534 High density cholesterol (mg/dL) 53.4±8.6 50.7±15.8 0.425 Low density cholesterol (mg/dL) 116.8±31.4 116.3±29.3 0.945 Triglyceride (mg/dL) 95.5±39.3 113.4±49.1 0.129 Disease activity
ASDAS-ESR 1.8±0.6 3.1±0.8 <0.001
ASDAS-CRP N/A N/A N/A
BASDAI 2.5±1.2 4.5±1.7 <0.001 BAS-G 2.5±1.7 4.7±2.2 <0.001 BASFI 1.7±4.3 2.9±1.8 0.185 Medications Glucocorticoid use 2 (5.0) 5 (13.8) 0.181 Methotrexate use 2 (5.0) 3 (8.3) 0.651 Sulfasalazine use 19 (47.5) 20 (55.5) 0.258 Anti-TNF antibody use 16 (40.0) 11 (30.6) 0.390 Values are expressed as mean±standard deviation or number (%). ASDAS: ankylosing spondylitis disease activity score, CRP: C-reactive protein, AS: ankylosing spondylitis, BMI: body mass index, HLA: human leukocyte antigen, HbA1c: hemoglobin A1c, GA: glycated albumin, ESR: erythrocyte sedimentation rate, BASDAI: bath ankylosing spondylitis disease activity index, BAS-G: bath ankylosing spondylitis patient global score, BASFI: bath ankylosing spondylitis disease activity functional index, TNF: tumour necrosis factor, N/A: not available.
body uses did not show statistically significant difference between the two groups.
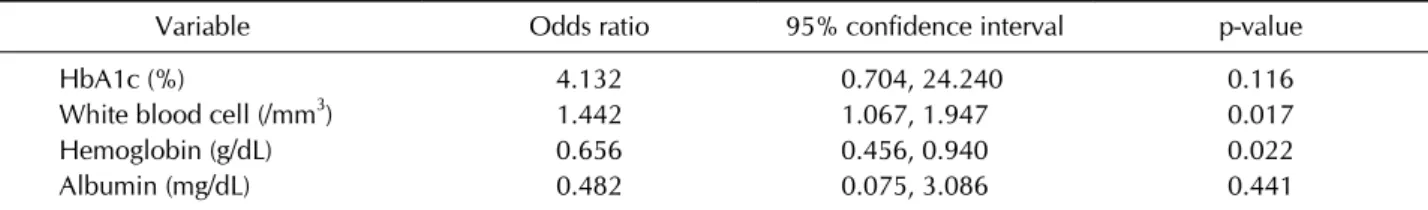
On multivariate logistic regression analysis of these sig-nificant variables, only white blood cell and hemoglobin were independently associated with high disease activity of AS based on ASDAS-CRP of 2.1 (odds ratio [OR]=1.442, 95% confidential interval [CI]=1.067, 1.947, p=0.017,
and OR=0.656, 95% CI=0.456, 0.940, p=0.022). The statistical significance of HbA1c disappeared on multi-variate analysis (OR=4.132, 95% CI=0.704, 24.240, p=0.116) (Table 5).
Table 5. Multivariate logistic regression analysis using variables with statistical significance between patients with active and
inactive ankylosing spondylitis based on ASDAS-CRP >2.1
Variable Odds ratio 95% confidence interval p-value HbA1c (%) 4.132 0.704, 24.240 0.116 White blood cell (/mm3) 1.442 1.067, 1.947 0.017 Hemoglobin (g/dL) 0.656 0.456, 0.940 0.022 Albumin (mg/dL) 0.482 0.075, 3.086 0.441 ASDAS: ankylosing spondylitis disease activity score, CRP: C-reactive protein, HbA1c: hemoglobin A1c.
DISCUSSION
Glycated albumin is a clinical marker to predict for coro-nary artery disease in type 2 diabetes patients, and it is well known as having correlation with high sensi-tivity-CRP, TNF-alpha, and interleukin-6 level [22]. In the study using bovine serum albumin, it shows that in-creased advanced glycation end-products which are rep-resentative for glycated albumin in diabetic patients upre-gulate thrombotic responses and deteriorate vessel ge-ometry through constant disturbed shear stress in endo-thelial cell [23]. Meanwhile, HbA1c is marker to reflect severity of coronary artherosclerosis in non-diabetic in-dividuals, so it has association in lower albumin concen-trations, increased concentration of CRP, fibrinogen and white blood cell level, and so on. It is because HbA1c re-flects subclinical derangement in glucose metabolism caused by chronic inflammation though it has normal range [24].
In this study, we first investigated whether glycated pro-teins, HbA1c and GA, are adjunctive markers to be well correlated with ASDAS-ESR and ASDAS-CRP. And we demonstrated that HbA1c was significantly correlated with ASDAS-CRP, and HbA1c could be a useful marker to reflect ASDAS-CRP in AS patients without medical con-ditions affecting glycated protein levels. Meanwhile, HbA1c had a tendency to correlate with ASDAS-ESR, but it had no statistical significance (p=0.056). In addition, we found that HbA1c was correlated with BASDAI and BAS-G with statistical significance as well, but in the present study, we focused on the ASDAS-ESR and ASDAS- CRP containing objective laboratory results in their equations. In the real clinical settings, a majority of physi-cians are measuring the levels of acute reactants, such as ESR and CRP, at each visit of patients of AS. However, most of them have no over-credulity to directly apply them to AS patients to reflect the disease activity, due to its low sensitivity and singularity in AS [25]. By contrast,
BASDAI, BAS-G and BASFI are not objectively reliable due to their limited subjective items [5]. ASDAS-ESR and ASDAS-CRP are likely to overcome these limitations by adding objective laboratory results to patient-reported forms. In this regard, our study might be valuable in terms of discovering a convenient serum marker to reflect ASDAS-CRP in AS patients, who had normal laboratory results including HbA1c, GA and fasting glucose, and who had no medical history of abnormal glucose metabo-lism and other medical conditions affecting glycated pro-tein levels.
In our previous study, we consecutively enrolled 205 pa-tients with rheumatoid arthritis (RA) and analysed their data. And we concluded that GA increased along with the disease activity in rheumatoid factor positive RA patients, and furthermore, GA was an independent and potential predictor of active RA, comparable with ESR and CRP [12]. However, in this study, we failed to elucidate that GA was correlated with the disease activity indices of AS. GA is a newly suggested parameter for the status of glu-cose metabolism, and it has an advantage in that it can re-flect the relatively short-term alternations in plasma glu-cose concentration, compared to HbA1c, whereas, HbA1c can reflect the status of glucose metabolism over 60 days ago [9,10,26]. In addition, the disease progression and the fluctuation of inflammatory burdens of RA are more changeable than those of AS due to its low sensitivity in AS diagnosis and disease activity assessment [25,27]. Our results also demonstrated that HbA1c was not corre-lated with CRP (r=0.023, p=0.842) and ESR (r=0.201, p=0.081). But HbA1c was well correlated with ASDAS-CRP, which can reflect the accumulative outcome of the alter-ation in inflammatory burdens over time. In this regard, we first revealed that HbA1c can reflect subtle impaired glucose tolerance and metabolic alterations provoked by subclinical inflammatory burdens more clearly than GA in patients with AS, unlike RA.
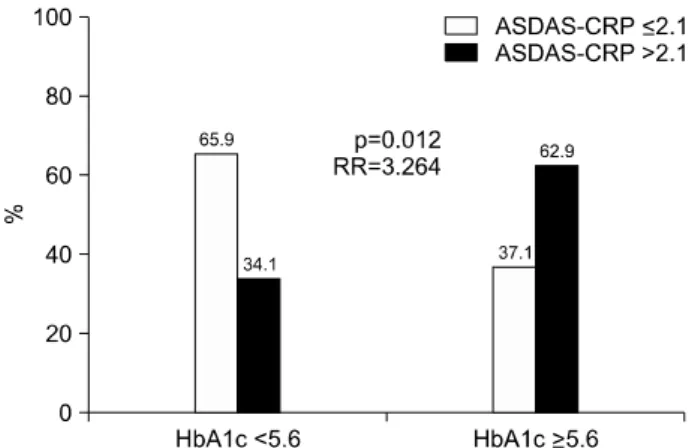
multi-Figure 1. Optimal cut-off values of HbA1c to reflect active
an-kylosing spondylitis. Active anan-kylosing spondylitis in patients having HbA1c ≥5.6 was identified more often than in those having HbA1c <5.6 (62.9% vs. 34.1%, p=0.012). Patients having HbA1c more than 5.6 showed significantly enhanced risk of active AS than those having not (RR=3.264). ASDAS: ankylosing spondylitis disease activity score, CRP: C-reactive protein, RR: relative risk, HbA1c: hemoglobin A1c, AS: anky-losing spondylitis.
variate analysis, HbA1c did show a significant difference between active and inactive AS groups based on ASDAS- CRP of 2.1 on univariate analysis (p=0.020). We as-sumed that this result might result from the relatively low median and mean of ASDAS-CRP as 1.8 and 2.0, which are below the cut-off of 2.1. With this reason, we set the optimal cut-off values of HbA1c to reflect active AS by cal-culating the area under the receiver operator character-istic curve (AUROC) and selection to maximize the sum of sensitivity (0.611) and specificity (0.675). In addition, the relative risk (RR) of the cut-off value of HbA1c for in-creased disease activity of AS was analysed using con-tingency tables and the chi-square test. And we found that 5.6 of HbA1c (AUROC=0.669, 95% CI=0.547, 0.791, p=0.011) was the optimal cut-off value good enough to reflect active AS. When we divided 76 patients with AS into two groups based on the calculated optimal cut-off value of HbA1c, active AS in patients having HbA1c more than 5.6 was identified more often than in those having HbA1c below 5.6 (62.9% vs. 34.1%, p=0.012). Moreover, patients having HbA1c more than 5.6 showed sig-nificantly enhanced risk of active AS than those having not (RR=3.264, 95% CI=1.273, 8.369) (Figure 1). If we are able to enrol the larger number of AS patients, we could validate the statistical power of the optimal cut-off value of HbA1c to easily and conveniently categorise ac-tive AS or inacac-tive AS in non-diabetic patients.
Previous studies have reported that sulfasalazine and
methotrexate treatments can affect HbA1c levels [28,29], so we did univariate regression analysis between these medicines use and HbA1c, but we cannot find statistical significance (data now shown).
The strength of this study is that we first demonstrated that HbA1c was significantly correlated with ASDAS-CRP, and HbA1c could be a useful marker to reflect ASDAS- CRP in AS patients without medical conditions affecting glycated protein levels. Furthermore, we could set the op-timal cut-off value of HbA1c at 5.6, and we elucidated that patients having HbA1c more than 5.6 could have en-hanced risk of active AS 3.3 times as high as those having not.
We also had several issues: first, our study was a cross- sectional study; second, we did not measure the parame-ters more directly related to HbA1c level, such as insulin resistance or intramural thickness; third, we could not perform sub-group analysis according to anti-hyper-tension and anti-dyslipidaemia agents, which can worsen or improve insulin resistance or beta-cell functions [30,31]. If future studies can serially measure not only HbA1c, but also the parameters directly related to HbA1c level, they could provide a dynamic correlation between HbA1c and disease activity of AS. In conclusion, we here-in showed that HbA1c was significantly correlated with ASDAS-CRP, and HbA1c could be a useful marker to re-flect ASDAS-CRP in AS patients without medical con-ditions affecting glycated protein levels. Furthermore, we elucidated that patients having HbA1c more than 5.6 could have enhanced risk of active AS 3.3 times as high as those having not.
CONFLICT OF INTEREST
No potential conflict of interest relevant to this article was reported.
SUPPLEMENTARY DATA
Supplementary data can be found with this article online at https://doi.org/10.4078/jrd.2018.25.2.131.
REFERENCES
1. Pedersen SJ, Sørensen IJ, Garnero P, Johansen JS, Madsen OR, Tvede N, et al. ASDAS, BASDAI and different treat-ment responses and their relation to biomarkers of in-flammation, cartilage and bone turnover in patients with axial spondyloarthritis treated with TNFα inhibitors. Ann
Rheum Dis 2011;70:1375-81.
2. Braun J, Davis J, Dougados M, Sieper J, van der Linden S, van der Heijde D. First update of the international ASAS con-sensus statement for the use of anti-TNF agents in patients with ankylosing spondylitis. Ann Rheum Dis 2006;65:316- 20.
3. Braun J, van den Berg R, Baraliakos X, Boehm H, Burgos-Vargas R, Collantes-Estevez E, et al. 2010 update of the ASAS/EULAR recommendations for the management of ankylosing spondylitis. Ann Rheum Dis 2011;70:896-904. 4. Dougados M, Gueguen A, Nakache JP, Velicitat P, Zeidler H, Veys E, et al. Clinical relevance of C-reactive protein in axial involvement of ankylosing spondylitis. J Rheumatol 1999;26:971-4.
5. Garrett S, Jenkinson T, Kennedy LG, Whitelock H, Gaisford P, Calin A. A new approach to defining disease status in an-kylosing spondylitis: the Bath Anan-kylosing Spondylitis Disease Activity Index. J Rheumatol 1994;21:2286-91. 6. van der Heijde D, Lie E, Kvien TK, Sieper J, Van den Bosch
F, Listing J, et al. ASDAS, a highly discriminatory ASAS-en-dorsed disease activity score in patients with ankylosing spondylitis. Ann Rheum Dis 2009;68:1811-8.
7. Basta G, Lazzerini G, Massaro M, Simoncini T, Tanganelli P, Fu C, et al. Advanced glycation end products activate endo-thelium through signal-transduction receptor RAGE: a mechanism for amplification of inflammatory responses. Circulation 2002;105:816-22.
8. Goldin A, Beckman JA, Schmidt AM, Creager MA. Advanced glycation end products: sparking the develop-ment of diabetic vascular injury. Circulation 2006;114: 597-605.
9. Koga M, Kasayama S. Clinical impact of glycated albumin as another glycemic control marker. Endocr J 2010;57:751-62. 10. Koga M, Murai J, Morita S, Saito H, Kasayama S.
Compari-son of annual variability in HbA1c and glycated albumin in patients with type 1 vs. type 2 diabetes mellitus. J Diabetes Complications 2013;27:211-3.
11. Koga M, Otsuki M, Matsumoto S, Saito H, Mukai M, Kasayama S. Negative association of obesity and its related chronic inflammation with serum glycated albumin but not glycated hemoglobin levels. Clin Chim Acta 2007;378: 48-52.
12. Park JS, Song J, Park YB, Lee SK, Lee SW. Glycated albumin increases with disease activity in rheumatoid factor positive rheumatoid arthritis patients with normal fasting glucose and HbA1c. Joint Bone Spine 2017;84:115-8.
13. van der Linden S, Valkenburg HA, Cats A. Evaluation of di-agnostic criteria for ankylosing spondylitis. A proposal for modification of the New York criteria. Arthritis Rheum 1984;27:361-8.
14. Koga M, Murai J, Saito H, Kasayama S, Imagawa A, Hanafusa T, et al. Serum glycated albumin to haemoglobin A(1C) ratio can distinguish fulminant type 1 diabetes melli-tus from type 2 diabetes mellimelli-tus. Ann Clin Biochem 2010;47:313-7.
15. Koga M, Murai J, Saito H, Matsumoto S, Kasayama S. Effects of thyroid hormone on serum glycated albumin levels: study on non-diabetic subjects. Diabetes Res Clin Pract 2009;84: 163-7.
16. Okada T, Nakao T, Matsumoto H, Nagaoka Y, Tomaru R, Iwasawa H, et al. Influence of proteinuria on glycated
albu-min values in diabetic patients with chronic kidney disease. Intern Med 2011;50:23-9.
17. Nomura Y, Nanjo K, Miyano M, Kikuoka H, Kuriyama S, Maeda M, et al. Hemoglobin A1 in cirrhosis of the liver. Diabetes Res 1989;11:177-80.
18. Panzer S, Kronik G, Lechner K, Bettelheim P, Neumann E, Dudczak R. Glycosylated hemoglobins (GHb): an index of red cell survival. Blood 1982;59:1348-50.
19. Machado P, Navarro-Compán V, Landewé R, van Gaalen FA, Roux C, van der Heijde D. Calculating the ankylosing spondylitis disease activity score if the conventional c-re-active protein level is below the limit of detection or if high-sensitivity c-reactive protein is used: an analysis in the DESIR cohort. Arthritis Rheumatol 2015;67:408-13. 20. Calin A, Garrett S, Whitelock H, Kennedy LG, O'Hea J,
Mallorie P, et al. A new approach to defining functional abil-ity in ankylosing spondylitis: the development of the Bath Ankylosing Spondylitis Functional Index. J Rheumatol 1994;21:2281-5.
21. Jones SD, Steiner A, Garrett SL, Calin A. The bath ankylosing spondylitis patient global score (BAS-G). Br J Rheumatol 1996;35:66-71.
22. Pu LJ, Lu L, Xu XW, Zhang RY, Zhang Q, Zhang JS, et al. Value of serum glycated albumin and high-sensitivity C-re-active protein levels in the prediction of presence of coro-nary artery disease in patients with type 2 diabetes. Cardiovasc Diabetol 2006;5:27.
23. Maria Z, Yin W, Rubenstein DA. Combined effects of phys-iologically relevant disturbed wall shear stress and glycated albumin on endothelial cell functions associated with in-flammation, thrombosis and cytoskeletal dynamics. J Diabetes Investig 2014;5:372-81.
24. Gustavsson CG, Agardh CD. Markers of inflammation in pa-tients with coronary artery disease are also associated with glycosylated haemoglobin A1c within the normal range. Eur Heart J 2004;25:2120-4.
25. Rudwaleit M, Haibel H, Baraliakos X, Listing J, Märker-Hermann E, Zeidler H, et al. The early disease stage in axial spondylarthritis: results from the German Spondy-loarthritis Inception Cohort. Arthritis Rheum 2009;60: 717-27.
26. Kim KJ, Lee BW. The roles of glycated albumin as inter-mediate glycation index and pathogenic protein. Diabetes Metab J 2012;36:98-107.
27. Danve A, O'Dell J. The ongoing quest for biomarkers in Ankylosing Spondylitis. Int J Rheum Dis 2015;18:826-34. 28. de Rotte MC, de Jong PH, den Boer E, Pluijm SM, Özcan B,
Weel AE, et al. Effect of methotrexate use and erythrocyte methotrexate polyglutamate on glycosylated hemoglobin in rheumatoid arthritis. Arthritis Rheumatol 2014;66:2026-36. 29. Krogh Jensen M, Ekelund S, Svendsen L. Folate and
homo-cysteine status and haemolysis in patients treated with sul-phasalazine for arthritis. Scand J Clin Lab Invest 1996; 56:421-9.
30. Lithell HO. Effect of antihypertensive drugs on insulin, glu-cose, and lipid metabolism. Diabetes Care 1991;14:203-9. 31. Goyal A, Singh S, Tandon N, Gupta N, Gupta YK. Effect of
atorvastatin on pancreatic Beta-cell function and insulin re-sistance in type 2 diabetes mellitus patients: a randomized pilot study. Can J Diabetes 2014;38:466-72.
Supplementary Table 1. Correlation among variables related to glucose metabolism and disease activity of ankylosing spondylitis
(n=76)
BMI HbA1c GA Fasting glucose ASDAS-ESR ASDAS-CRP BASDAI BAS-G BMI 1 HbA1c 0.227* 1 GA −0.268* 0.400* 1 Fasting glucose 0.331* 0.405* 0.186 1 ASDAS-ESR 0.013 0.220 0.105 0.011 1 ASDAS-CRP 0.032 0.315* 0.135 0.037 0.792* 1 BASDAI 0.019 0.226* 0.192 0.010 0.719* 0.774* 1 BAS-G 0.039 0.401* 0.221 0.166 0.568* 0.617* 0.655* 1 BASFI −0.118 0.124 0.111 0.013 0.376* 0.322* 0.211 0.279* BMI: body mass index, HbA1c: haemoglobin A1c, GA: glycated albumin, ASDAS: ankylosing spondylitis disease activity score, BASDAI: Bath ankylosing spondylitis disease activity index, BAS-G: Bath ankylosing spondylitis patient global score, BASFI: Bath ankylosing spondylitis disease activity functional index. *p<0.05.