Diffusion-weighted imaging (DWI) is a MR sequence in which phase-defocusing and phase-refocusing gradi- ents are used to evaluate the rate of microscopic water diffusion within the tissues (1). The ability to measure the rate of water diffusion is important because water diffusion is frequently altered in a variety of disease processes. For example, water diffusion is decreased soon after the onset of cerebral ischemia, and detecting early cerebral infarction is one of the earliest and most
important applications for DWI (2). Other cerebral dis- eases that show decreased water diffusion are some tu- mors, intracranial infections, diffuse axonal injury le- sions and intracerebral hematomas (3-6).
The signal intensity (SI) on DWI is defined as follows:
SI = SI0×e-bADC,
where SI0 is the signal intensity on the T2-weighted (or b = 0 sec/mm2) image, b is the diffusion sensitivity factor, and ADC is the apparent diffusion coefficient.
Therefore, the DWI has T2-weighted contrast as well as contrast due to the differences in the ADC. The lesions with decreased water diffusion generally show bright intensity on DWI, but the lesions without decreased wa-
Bright Intracranial Lesions on Diffusion-weighted Images: A Pictorial Review1
Dae Seob Choi, M.D.
1Department of Diagnostic Radiology and Gyeongsang Institute of Health Science, Gyeongsang National University College of Medicine
Received November 25, 2005 ; Accepted February 3, 2006
Address reprint requests to : Dae Seob Choi, M.D., Department of Diagnostic Radiology, Gyeongsang National University Hospital, 90, Chilam-dong, Jinju, Gyeongnam 660-702, Korea
Tel. 82-55-750-8201 Fax. 82-55-758-1568 E-mail: [email protected]
Diffusion-weighted imaging (DWI) is a MR sequence that is used to evaluate the rate of microscopic water diffusion within the tissues. The ability to measure the rate of water diffusion is important because this is frequently altered in various disease processes. Generally, the lesions with restricted water diffusion show bright intensity on DWI, but the lesions without restricted water diffusion can also show bright inten- sity on DWI, which is called the “T2 shine through effect”. With DWI, we can sensi- tively detect hyperacute infarction (within 6 hours after symptom onset), and this is difficult to detect with using CT and the conventional MR sequences. The acute and subacute lesions of hypoxic-ischemic encephalopathy and carbon monoxide intoxica- tion also show bright intensity on the DWI. The other diseases that can show bright in- tensity on the DWI include acute and subacute diffuse axonal injury lesions, hypera- cute and late subacute hematomas, cerebral abscess, subdural empyema, acute herpes encephalitis, various tumors and such degenerative and demyelinating diseases as multiple sclerosis, posterior reversible encephalopathy syndrome, Wilson’s disease and Wernicke’s encephalopathy.
Index words :Brain
Magnetic resonance (MR), diffusion study
ter diffusion can also show bright intensity on DWI, which called the “T2 shine through effect”.
In this illustrated study, we demonstrate various in- tracranial lesions that show bright intensity on DWI and we discuss their pathophysiology.
Ischemic Lesions
Cerebral infarction
One of the most important clinical applications for DWI is the early detection of cerebral infarction (1, 2).
The computed tomography (CT) and conventional MR sequences (the T2, FLAIR and T1-weighted images) are
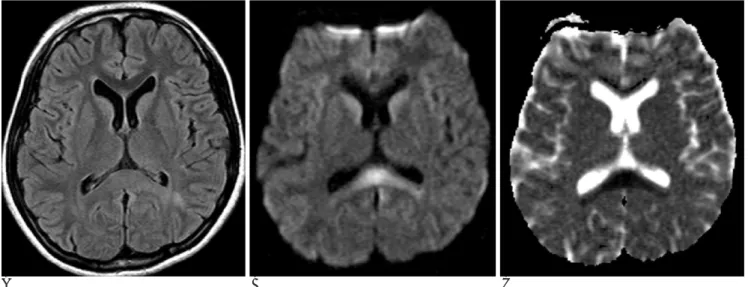
not sensitive enough for making the early diagnosis of hyperacute infarction (within 6 hours after symptom on- set). Within minutes after the onset of ischemia, cytotox- ic edema occurs in the affected brain tissue. A net translocation of water from the extracellular compart- ment to the intracellular compartment leads to restrict- ed water diffusion. This restricted water diffusion that’s associated with acute ischemia can be detected as early as 30 minutes to 1 hour. The ADC continues to decrease and is reduced the most at 8-32 hours; it remains markedly reduced for 3-5 days. This decreased water diffusion is seen as marked hyperintensity on the DWI and as hypointensity on the ADC map image (Fig. 1).
A B C
Fig. 1. A 48-year-old woman with right hemiparesis.
These MR images were obtained 3 hours after ictus.
A. The T2-weighted image shows no definite signal abnormality.
B. The DWI shows a hyperintense lesion in the left deep temporal white matter, and this suggests infarction.
C. The ADC map image reveals the restricted water diffusion of the lesion.
A B
Fig. 2. A 76-year-old man with right hemiparesis.
These MR images were obtained 3 days after ictus.
A. The FLAIR MR image shows multi- ple small hyperintense foci in the white mater of both frontal lobes.
B. On DWI, one of the left frontal lobe lesions shows bright intensity, which represents recent infarction.
The ADC returns to baseline at 1-4 weeks. At this point, the infarction is usually mildly hyperintense due to the T2 component on the DWI and it is isointense on the ADC map image. The DWI is very sensitive and spe- cific for the detection of hyperacute and acute infarc- tion, with a sensitivity of 88%-100% and a specificity of 86%-100%.
Another clinical application of DWI for cerebral in- farction is differentiating acute infarction from chronic
infarction. Older patients commonly have hyperintense abnormalities on their T2-weighted images, which may be indistinguishable from acute lesions. However, acute infarctions are hyperintense, whereas chronic foci are isointense or hypointense on DWI (Fig. 2).
Hypoxic-ischemic encephalopathy and carbon monoxide intoxication
As cerebral infarction, the acute and subacute lesions
A B C
Fig. 3. A 44-year-old man with hypoxic-ischemic encephalopathy. These MR images were obtained 3 weeks after sudden cardiac arrest.
A. The T2-weighted image shows subtle hyperintense lesions in the bilateral putamina and caudate nuclei.
B. On DWI, the lesion conspicuity is increased.
C. The ADC map image shows the restricted water diffusion of the lesions.
A B C
Fig. 4. A 49-year-old woman with delayed encephalopathy of CO intoxication.
These MR images were obtained 29 days after CO exposure. Her symptoms were aggravated 5 days before the images were taken.
A. The FLAIR image shows hyperintense lesions in the bilateral globus pallidus, caudate nuclei and cerebral white matter.
B. The DWI also shows the lesions as bright intensity.
C. On the ADC map image, most of the lesions are isointense to the normal brain parenchyma. There are subtle hypointense foci in both frontal white matter areas (arrows).
of hypoxic-ischemic encephalopathy and carbon monoxide (CO) intoxication show bright intensity on DWI (Fig. 3) (7). Delayed encephalopathy from CO in- toxication also reveals hyperintensity on DWI with a re- duced ADC value (Fig. 4). The reduced water diffusion in the delayed encephalopathy from CO-intoxication may be caused by the slowly progressive cytotoxic ede- ma that’s related to the direct toxic effect of CO gas or to some other unknown mechanism. There are some limi- tations for making the early diagnosis of hypoxic-is- chemic encephalopathy and CO intoxication with using the conventional CT or MR images. The acute lesions that can not be seen on conventional CT or MR can be identified on DWI. When lesions are identified on the conventional images, then the conspicuity of the lesions
is increased on DWI.
Hemorrhage
The signal intensity of intracerebral hematoma seen on DWI is identical that on the T2-weighted image (6).
The same as on the T2-weighted image, hyperacute and late subacute hematomas display bright intensity on DWI (Fig. 5, 6). Although acute and early subacute hematomas also have reduced ADC values, they are seen as very low intensity on DWI, which is the same as on the T2-weighted image. This hypointensity is attrib- uted to the magnetic field inhomogeneity that’s caused by paramagnetic deoxyhemoglobin in acute hematoma and by paramagnetic intracellular methemoglobin in
A B C
Fig. 5. A 69-year-old woman with hyperacute intraparenchymal hematoma in the left cerebellum. These MR images were obtained 6 hours after ictus. A. The T1-weighted image shows an isointense hematoma in the left cerebellum.
B, C. On the T2-weighted image and the DWI, the hematoma is hyperintense.
A B C
Fig. 6. A 36-year-old man with late subacute intracerebral hematoma in the right parietal lobe. These MR images were obtained 13 days after ictus.
A, B, C. The T1 image, T2 image and DWI show a hyperintense hematoma in the right parietal lobe.
early subacute hematoma.
Diffuse Axonal Injury
Most of the acute and subacute diffuse axonal injury lesions show bright intensity on DWI with the corre- spondingly decreased ADC (Fig. 7) (5). In addition, most of these type lesions are more conspicuous on DWI than on the conventional T2-weighted image. Not just cy- totoxic edema, but also other alternative factors such as neurotoxic edema may be related to the decreased ADC values of diffuse axonal injury lesions.
Tumors
Cystic tumors
Epidermoid cyst and choroid plexus cyst usually dis- play bright intensity on DWI (Fig. 8, 9) (4). With using DWI, epidermoid cyst is easily distinguished from arachnoid cyst, which shows low intensity on DWI. The differentiation of epidermoid cyst from arachnoid cyst is occasionally difficult with using the conventional MR sequences.
The ADCs of epidermoid cyst and choroid plexus cyst are lower than that of cerebrospinal fluid, but they are higher than that of the brain parenchyma; therefore, the
A B C
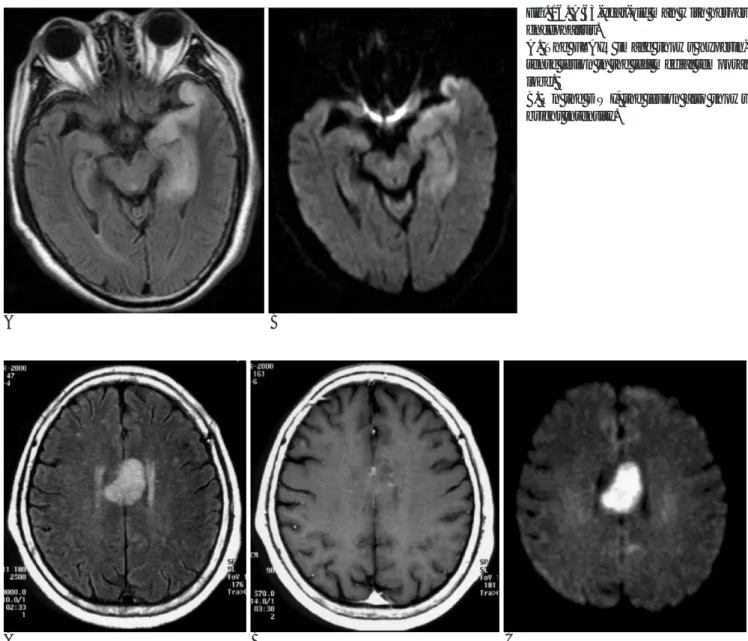
Fig. 7. A 15-year-old female with diffuse axonal injury lesions due to a motor vehicle accident that occurred 10 days previously.
A. The FLAIR image shows a subtle hyperintense lesion at the splenial portion of the corpus callosum.
B. On DWI, the lesion is more conspicuously demonstrated than on the FLAIR image.
C. The ADC map image reveals the restricted water diffusion of the lesion.
A B
Fig. 8. A 78-year-old man with an epi- dermoid cyst.
A. The T2-weighted image shows the prominent right cerebellopontine an- gle (CPA) cistern.
B. On DWI, there is an epidermoid cyst with bright intensity in the right CPA cistern.
hyperintensity of epidermoid cyst and choroid plexus cyst on DWI is not only caused by the diffusion restric- tion, but also by the T2 shine-through effect.
Solid tumors
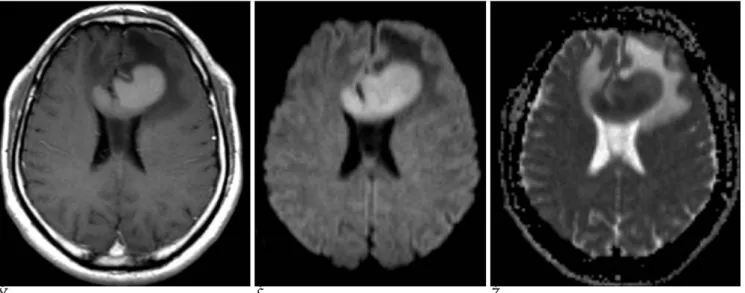
The signal intensity of solid brain tumors on DWI is variable (hyper-, iso- or hypointense). The solid enhanc- ing portions of malignant lymphoma, high grade glioma and metastasis usually show mild hyperintensity on DWI (Fig. 10-12) (3). For gliomas, the signal intensity of these tumors on DWI tends to increase with the in-
creased grade of the tumor. Sometimes, meningioma can also display bright intensity on DWI (Fig. 13) (3).
The most important factor that influences the signal in- tensity of solid tumors on DWI is not their histologic type, but rather, it is their cellularity. The cellularity of a tumor likely contributes to barriers for water diffusion.
Infections
Cerebral abscess
An abscess cavity shows hyperintensity on DWI and it
A B C
Fig. 9. A 56-year-old woman with a choroid plexus cyst.
A. The FLAIR image shows a small hyperintense lesion in the choroid plexus of the left lateral ventricle.
B. On the contrast-enhanced T1-weighted image, the lesion is seen as hypointensity.
C. On the DWI, the lesion is markedly hyperintense.
A B C
Fig. 10. A 39-year-old man with a malignant lymphoma.
A. The enhanced T1-weigted image shows a strong enhancing mass in the corpus callosum and the left frontal lobe white matter.
B. The DWI reveals the mass as bright intensity.
C. On the ADC map image, the mass shows as being isointense or slightly hypointense to the white matter.
has restricted water diffusion (Fig. 14) (4). This restricted water diffusion is most likely due to the high viscosity and cellularity of pus.
Although cerebral abscesses and cystic or necrotic tu- mors may appear similar on the conventional MR se- quences, the signal intensity of an abscess cavity is markedly higher than that of cystic or necrotic tumors on DWI (Fig. 11).
Subdural and epidural empyemas
The same as cerebral abscess, subdural empyemas and epidural empyemas also show bright signal intensi- ty on DWI (Fig. 15). Bacterial meningitis may be compli-
cated by subdural effusion and subdural empyema, and these are difficult to differentiate on the conventional MR images. With employing DWI, they are easily dif- ferentiated because empyema is hyperintense on DWI, whereas effusion is hypointense on DWI.
Herpes encephalitis
Herpes encephalitis is a potentially fatal infectious dis- order that usually involves the temporal lobe, insula, subfrontal area and cingulate gyrus. Performing early imaging for making the diagnosis of herpes encephalitis is very important because this disease is difficult to diag- nose clinically and early treatment is mandatory to
A B C
Fig. 12. A 73-year-old man with metastatic tumors from hepatocellular carcinoma.
A. The enhanced T1-weighted image shows multiple enhancing nodules in both temporal lobes and the left cerebellum.
B. On the DWI, the lesions are hyperintense.
C. The ADC map image reveals the restricted water diffusion of the lesions.
A B
Fig. 11. A 46-year-old man with a glioblastoma.
A. The enhanced T1-weighted image shows a rim-enhancing mass in the left frontal lobe.
B. On the DWI, the solid enhancing portion is hyperintense and the necrot- ic central portion is hypointense.
A B C Fig. 13. A 73-year-old woman with a meningioma.
A. The enhanced T1-weighted image shows a strong enhancing mass at the vertex of the left frontal convexity.
B. On the DWI, the mass is seen as bright intensity.
C. On the ADC map image, the mass is isointense to the brain parenchyma.
A B
Fig. 14. A 62-year-old woman with an abscess.
A. The enhanced T1-weighted image shows an enhanced ring of abscess in the left temporal lobe.
B. On the DWI, the abscess cavity shows bright intensity and the enhanc- ing wall shows low intensity.
A B C
Fig. 15. A 58-year-old man with subdural empyema.
A, B. The T2 and enhanced T1-weighted images show a subdural fluid collection at the left parietal convexity. There is no visible contrast-enhancing wall.
C. On DWI, the fluid collection shows bright intensity, which represents empyema.
avoid any permanent neurologic sequelae. The conven- tional MR imaging findings of herpes encephalitis are characterized by signal abnormalities, hyperintensity on the T2-weighted image and hypointensity on the T1- weighted image. Various degrees of contrast enhance- ment may be seen. The early active lesions of herpes en- cephalitis usually show bright intensity on DWI, with a decrease of the ADC values (Fig. 16) (1). The restricted diffusion is explained by the cytotoxic edema in the tis- sue undergoing necrosis.
Degenerative and Demyelinating Diseases
Multiple sclerosis
The signal intensity of multiple sclerosis (MS) on DWI is variable (hyper-, iso- or hypointense). Active enhanc- ing lesions are hyperintense relative to the white matter on DWI, while chronic lesions are isointense (Fig. 17) (1). The majority of studies have shown increases of the ADC values in MS lesions. The elevated diffusion may result from an increase in the size of the extracellular space due to edema and demyelination acutely, and to axonal loss and gliosis chronically. The high intensity plaques on DWI may occasionally show reduced ADC
A B
Fig. 16. A 63-year-old man with herpes encephalitis.
A. The FLAIR image shows hyperin- tense lesion in the left medial temporal lobe.
B. On the DWI, the lesion also shows bright intensity.
A B C
Fig. 17. A 71-year-old woman with multiple sclerosis.
A. The FLAIR image shows a hyperintense lesion in the body potion of the corpus callosum.
B. On the enhanced T1-weighted image, there is partial contrast enhancement of the lesion.
C. On the DWI, it is markedly hyperintense.
values. This may result from the increased inflammato- ry cellular infiltration with little extracellular edema.
Posterior reversible encephalopathy syndrome
Posterior reversible encephalopathy syndrome (PRES) refers to a symptom complex that’s characterized by headache, confusion, visual disturbance and seizures in the setting of an acute rise in blood pressure, eclampsia or following treatment with a number of therapeutic agents such as cyclosporine. These lesions are usually
isointense on DWI with increased ADC values, which is suggestive of vasogenic edema. Occasionally, smaller ar- eas of hyperintensity on the DWI within the predomi- nantly hyperintense areas on the T2-weighted images and within the isointense areas on the DWI can be seen;
these findings are associated with cerebral infarction and they may represent the earliest signs of nonre- versibility as severe vasogenic edema progresses on- ward to cytotoxic edema (Fig. 18) (8).
A B C
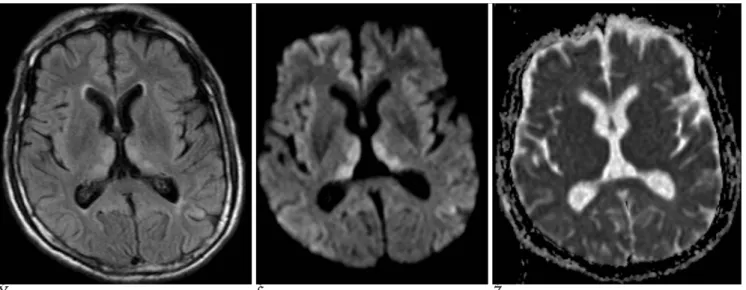
Fig. 18. A 27-year-old woman with posterior reversible encephalopathy syndrome due to eclampsia.
A. The FLAIR image shows multiple hyperintense lesions in both frontoparietal lobes.
B. On the DWI, most of the lesions are isointense or hypointense, but the cortical lesion of the right parietal lobe is hyperintense.
C. On the follow-up FLAIR image 3 months later, most of the lesions have disappeared, but the cortical lesion of the right parietal lobe remained with a decrease in its extent.
A B C
Fig. 19. A 18-year-old man with Wilson’s disease.
A. The T2-weigted image shows heterogeneously hyperintense lesions in the bilateral basal ganglia and thalami.
B. On DWI, the lesions of the caudate nuclei and thalami are hyperintense, whereas the lentiform nuclei lesions are hypointense.
C. The ADC map image reveals the slightly decreased water diffusion of the caudate nuclei and thalamic lesions.
Wilson’s disease
Wilson’s disease is an inherited disorder of copper me- tabolism, and it is caused by a deficiency of ceruloplas- min, the serum transport protein for copper. Abnormal copper deposition can occur in the brain. The brain le- sions are usually bilateral and often symmetrical; they involve the basal ganglia, thalamus, brain stem and den- tate nucleus. The lesions of cerebral Wilson’s disease usually appear hyperintense on the T2-weigted image.
On DWI, early cerebral Wilson’s disease shows bright intensity with reduced ADC values (Fig. 19) (9). Excess copper causes cellular injury leading to inflammation and cell death; it is likely that this finding mainly repre- sents cell swelling that’s associated with inflammation and hence, restriction of water diffusion. The lesions of cerebral Wilson’s disease in the chronic stage display hypointensity on DWI with increased ADC values. It is likely that these reflect necrosis, spongiform degenera- tion and demyelination.
Wernicke’s encephalopathy
Wernicke’s encephalopathy (WE) is caused by thi- amine deficiency, and it can cause symmetrical lesions in different brain areas, including the paraventricular area of the thalamus, the hypothalamus, the mamillary bodies, the periaqueductal area of the midbrain and the cerebellum. The common MR findings of WE are sym- metrically increased signal intensities in the mesen- cephalic tegmentum, mamillary bodies and medial thal- amus on the T2-weigted images. WE lesions show hy-
perintensity on DWI and isointensity on the ADC map images, and this represent vasogenic edema (Fig. 20) (10).
Conclusion
DWI is a valuable MR sequence as it provides physio- logic information about the brain tissue and DWI is par- ticularly sensitive to ischemic infarction. In addition to acute ischemic infarction, various other kinds of in- tracranial lesions can also show bright signal intensity on DWI. They include the acute and subacute lesions of hypoxic-ischemic encephalopathy, CO intoxication and diffuse axonal injury, hyperacute and late subacute hematomas, cerebral abscess, subdural and epidural empyemas, acute herpes encephalitis, various cysts and solid tumors, and degenerative and demyelinating dis- eases such as multiple sclerosis, posterior reversible en- cephalopathy syndrome, Wilson’s disease and Wernicke’s encephalopathy. The physician’s knowl- edge of these entities will be helpful to understand their pathophysiology and to make the correct radiological di- agnosis.
References
1. Schaefer PW, Grant PE, Gonzalez RG. Diffusion-weighted MR imaging of the brain. Radiology 2000;217:331-345
2. Lansberg MG, Thijs VN, O’Brien MW, Ali JO, de Crespigny AJ, Tong DC, et al. Evolution of apparent diffusion coefficient, diffu- sion-weighted, and T2-weighted signal intensity of acute stroke.
A B C
Fig. 20. A 72-year-old man with Wernicke’s encephalopathy.
A. The FLAIR MR image shows subtle hyperintense lesions in the bilateral medial thalami.
B. On DWI, the lesions are hyperintense and they are more conspicuous than on the FLAIR image.
C. On the ADC map image, the lesions are isointense.
AJNR Am J Neuroradiol 2001;22:637-644
3. Shin SW, Na DG, Byun HS, Pyeun YS, Kim JH, Kim KA, et al.
Diffusion MR imaging in patients with intracranial tumors. J Korean Radiol Soc 2000;43:387-394
4. Park SH, Chang KH, Song IC, Kim YJ, Kim SH, Han MH.
Diffusion-weighted MRI in cystic or necrotic intracranial lesions.
Neuroradiology 2000;42:716-721
5. Liu AY, Maldjian JA, Bagley LJ, Sinson GP, Grossman RI.
Traumatic brain injury: diffusion-weighted MR imaging findings.
AJNR Am J Neuroradiol 1999;20:1636-1641
6. Kang BK, Na DG, Ryoo JW, Byun HS, Roh HG, Pyeun YS.
Diffusion-weighted MR imaging of intracerebral hemorrhage.
Korean J Radiol 2001;2:183-191
7. Singhal AB, Topcuoglu MA, Koroshetz WJ. Diffusion MRI in three types of anoxic encephalopathy. J Neurol Sci 2002;196:37-40 8. Covarrubias DJ, Leutmer PH, Campeau NG. Posterior reversible
encephalopathy syndrome: prognostic utility of quantitative diffu- sion-weighted MR images. AJNR Am J Neuroradiol 2002;23:1038- 1048
9. Sener RN. Diffusion MR imaging changes associated with Wilson disease. AJNR Am J Neuroradiol 2003;24:965-967
10. Chung TI, Kim JS, Park SK, Kim BS, Ahn KJ, Yang DW. Diffusion- weighted MR imaging of acute Wernicke’s encephalopathy. Eur J Radiol 2003;45:256-258
대한영상의학회지 2006;55:21-32
확산강조영상에서 고신호 강도를 보이는 두개 내 병변들: 임상화보1
1경상대학교 의과대학 진단방사선과학교실, 경상대학교 건강과학연구원
최 대 섭
확산강조영상은 체내 물 분자의 미시적인 확산운동을 영상화하는 MR기법이다. 인체 내 다양한 질환에서 물 분자 의 확산 정도가 변화하기 때문에 이의 정확한 측정은 질환의 조기진단과 병태생리를 이해하는 데 유용하다. 확산운 동이 제한된 생체 내 조직과 병변은 확산강조영상에서 고신호 강도를 보인다. 확산강조영상에서의 신호강도는 물 분 자의 확산운동뿐만 아니라 T2강조영상에서의 신호강도를 반영하며 이를“T2 shine through effect”라 한다. 확산강 조영상에서 고신호 강도를 보이는 대표적인 질환은 급성 뇌경색으로 CT와 T2 강조영상으로는 진단에 어려움이 있 는 6시간 이내의 초급성기 뇌경색을 민감하게 진단할 수 있다. 급성 및 아급성기의 저산소성-허혈성 뇌증과 일산화 탄소 중독증도 확산강조영상에서 고신호 강도를 보여 이를 민감하게 진단할 수 있다. 또한, 미만성 축삭손상, 초급성 기와 후기 아급성기 혈종, 뇌농양, 경막하 축농증, 헤르페스 뇌염, 다양한 종류의 뇌종양, 퇴행성 및 탈수초성 병변들 도 확산강조영상에서 고신호 강도를 보일 수 있다.