Introduction
In dental implant treatment, the surface characteristics and biocompatibility of implant materials are the most important factors in successful osseointegration.1Titanium is the most commonly used material for existing dental
implants because of its outstanding capacity for osseo- integration. The installation of implants made with non- absorbable material in children still in their growth period can lead to lower sedimentation of the implant, caused by the growth of surrounding alveolar bone.2 Moreover, a case report has been published describing how an anky- losed implant inhibited the alveolar bone, preventing it from undergoing the growth that was occurring elsewhere in the jaws.3Currently, no proper implant treatment me- thod is available in pediatric dentistry for replacing lost deciduous teeth.
Absorbable implants can minimize the side effect of lower sedimentation, since the implant is absorbed inter- nally after placement. We have been developing an implant made with absorbable material that can be absorbed even
Volumetric quantification of bone-implant contact using micro-computed tomography analysis based on region-based segmentation
Sung-Won Kang1,†, Woo-Jin Lee1,†, Soon-Chul Choi2, Sam-Sun Lee2, Min-Suk Heo2, Kyung-Hoe Huh2, Tae-Il Kim3,*, Won-Jin Yi2,*
1Interdisciplinary Program in Radiation, Applied Life Science Major, College of Medicine, BK21, and Dental Research Institute, Seoul National University, Seoul, Korea
2Department of Oral and Maxillofacial Radiology, BK21, and Dental Research Institute, School of Dentistry, Seoul National University, Seoul, Korea
3Department of Periodontology and Dental Research Institute, School of Dentistry, Seoul National University, Seoul, Korea
ABSTRACT
Purpose: We have developed a new method of segmenting the areas of absorbable implants and bone using region- based segmentation of micro-computed tomography (micro-CT) images, which allowed us to quantify volumetric bone-implant contact (VBIC) and volumetric absorption (VA).
Materials and Methods: The simple threshold technique generally used in micro-CT analysis cannot be used to segment the areas of absorbable implants and bone. Instead, a region-based segmentation method, a region-labeling method, and subsequent morphological operations were successively applied to micro-CT images. The three- dimensional VBIC and VA of the absorbable implant were then calculated over the entire volume of the implant.
Two-dimensional (2D) bone-implant contact (BIC) and bone area (BA) were also measured based on the conven- tional histomorphometric method.
Results: VA and VBIC increased significantly with as the healing period increased (p⁄0.05). VBIC values were significantly correlated with VA values (p⁄0.05) and with 2D BIC values (p⁄0.05).
Conclusion: It is possible to quantify VBIC and VA for absorbable implants using micro-CT analysis using a region-based segmentation method. (Imaging Sci Dent 2015; 45: 7-13)
KEY WORDS: Absorbable Implants; Osseointegration; X-Ray Microtomography; Computer-Assisted Image Processing
*This study was supported by a grant of the Korean Health Technology R&D Project, Ministry of Health & Welfare, Republic of Korea (HI13C1491).
Received July 10, 2014; Revised November 10, 2014; Accepted November 17, 2014
†Contributed equally to this study as the co-first author.
*Correspondence to : Prof. Won-Jin Yi
Department of Oral and Maxillofacial Radiology, School of Dentistry, Seoul National University, Seoul, Korea
Tel) 8-22-2072-3049, Fax) 8-22-744-3919, E-mail) [email protected]
*Correspondence to : Prof. Tae-Il Kim
Department of Periodontology, School of Dentistry, Seoul National University, Seoul, Korea
Tel) 82-2-2072-2642, Fax) 82-2-744-0051, E-mail) [email protected]
Copyright ⓒ 2015 by Korean Academy of Oral and Maxillofacial Radiology
This is an Open Access article distributed under the terms of the Creative Commons Attribution Non-Commercial License (http://creativecommons.org/licenses/by-nc/3.0) which permits unrestricted non-commercial use, distribution, and reproduction in any medium, provided the original work is properly cited.
Imaging Science in Dentistry∙pISSN 2233-7822 eISSN 2233-7830
in cases of lower sedimentation. Implants of bio-absorb- able ceramics have already been used in orthopedics. Tri- calcium phosphate (TCP) becomes part of the bone after being absorbed,4 and polylactic acid (PLA) induces over 50% regeneration in regions with bone loss.5,6The strength reduction characteristic of a TCP implant can be mini- mized by conjunction with PLA.7Other synthetic biode- gradable materials such as polyglycolic acid and polyca- prolactone are able to undergo chemical decomposition in the body.
Osseointegration is critical to the success of dental imp- lant treatment and has been well studied, with ongoing research and development.8,9 The osseointegration capa- city of implants made from non-absorbable material has been studied extensively.10-13 Two-dimensional (2D) his- tomorphometric analysis has been widely used to exa- mine thin specimens due to its high spatial resolution and contrast.14,15 Bone-implant contact (BIC) and bone area (BA) have been quantitatively measured to evaluate osseo- integration based on 2D histomorphometric images. How- ever, the use of this technique to evaluate osseointegration has the disadvantages of requiring complex equipment and specimen preparation. Moreover, the rather destruc- tive process of specimen fabrication makes it difficult to reproduce the specimen. Unfavorable changes or damage may also occur at the interface of the bone and the implant surface when preparing and sectioning the specimens. The most important disadvantage is that only a limited area can be analyzed, because most of the specimen is lost dur- ing preparation.
A three-dimensional (3D) analysis method using micro- computed tomography (micro-CT) images has been devel- oped16-19 and exhibits a high correlation with the results of histomorphometric analyses.20-22Generally, a threshold method is used in micro-CT analysis to separate the areas of the bone and the implant.16-22 However, the simple threshold technique used in previous micro-CT analyses cannot be used to segment the areas of absorbable implant and bone, because the voxel intensities of the implants are similar to those of bone and the voxel intensity of the imp- lants exhibits intrinsic inhomogeneity. Therefore, a new analytical technique is necessary to measure the osseo- integration of absorbable implants.
In this study, we have developed a new method to seg- ment the areas of absorbable implants and bone using region-based segmentation of micro-CT images. We eval- uated the osseointegration of absorbable implants over the entire implant surface by analyzing segmented micro- CT images. The results of the micro-CT analysis for the
absorbable implants were compared with those obtained through histomorphometric analysis.
Materials and Methods
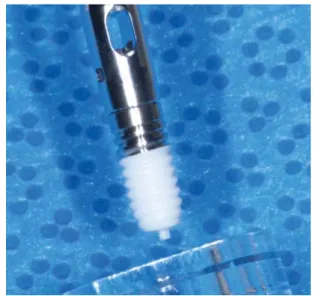
In this study, we used a special implant developed for stable positioning and favorable bone regeneration. The upper part of the implant was manufactured with grade IV titanium, whereas the lower part was composed of a PLA-TCP nanocomposite (Fig. 1). The upper part of the implant had a mini-implant shape with a length of 5 mm and a diameter of 3.5 mm. Hybrid nanopowders, made of a 30% mixture of PLA-TCP, were melted into the nano- composites to form the implant substructures. Seven bea- gle dogs (average age, 2 years; average weight, 13 kg) were used as experimental animals. All animal experi- ments, including animal management and surgical proce- dures, were approved and performed under the guidelines of the Institutional Animal Care and Use Committee of Seoul National University. Xylazine hydrochloride (Rum- pen, Bayer Korea, Seoul, Korea) mixed with ketamine (Ketalar, Yuhan, Seoul, Korea) was injected into the veins of the dogs, and the second and fourth premolars were extracted from the left and right lower jaws. The operation was followed by an eight-week healing period. Three months after the extraction, 28 implants were placed.
Seven implants broken during placement were excluded from the subsequent experiment. The animals were sacri- ficed four, eight, or 12 weeks after implant placement.
The bones, including the implants, were cut to obtain samples, which were fixed in 10% formalin solution for
Fig. 1.An absorbable implant consists of a titanium upper part and a polylactic acid/tricalcium phosphate (PLA-TCP) lower part.
48 hours. The samples were scanned at 70 kVp and 141 μA, using a Skyscan 1172 micro-CT scanner (Skyscan, Kontich, Belgium). The micro-CT image had a pixel size of 9.86 μm and 12-bit depth. A non-placed implant was also scanned for use as a control image.
The micro-CT images were processed to separate the implant area from the bone area for the quantitative 3D analysis of osseointegration. The areas of the bone and implant were segmented by a region-based method, using a region-growing algorithm.23This method segmented the bone and implant by taking a seed region as the initial seg- mentation, and then iteratively added all the connected voxels whose intensity fell within a dynamically defined range.23Holes were generated inside the implant area, as the seed boundary values of the segmentation did not include TCP particles with greater than normal brightness.
The holes were filled using a region-labeling method24 that automatically merged similar segmented regions.
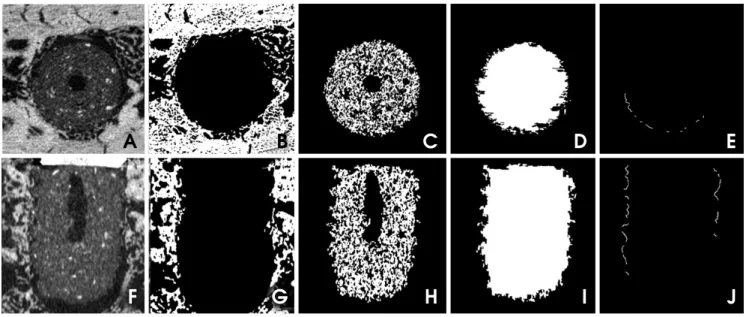
The overall procedure for separating the implant area from the bone area was as follows. First, the reconstructed image was passed through a smoothing process, using a curvature flow filter to reduce the influence of noise (Figs.
2A and F). The images were then segmented into bone and implant areas using an area-based confidence con- nected segmentation method (Figs. 2B and G).23 After segmenting the implant area, holes were generated inside the implant area (Figs. 2C and H). The holes were filled using a region-labeling method (Figs. 2D and I).24 The boundary between the bone and implant areas was smooth-
ed using the morphological operations of erosion and dila- tion. If one of the four-connected neighbors of a pixel in the implant area was a bone pixel, that pixel was deter- mined to belong to the area of bone-implant contact (Figs.
2E and J). The segmented areas of the bone and implant underwent 3D reconstruction after all steps of the image processing were applied to the axial slices of the micro- CT images.
The volumetric absorption (VA) of an implant was cal- culated by comparing it to the volume of a reference imp- lant that was not placed (Eq. 1). The volumetric bone- implant contact (VBIC) ratio was defined by comparing the area of the implant surface boundary in direct contact with the bone to the total area of the implant surface (Eq.
2). The VBIC ratio was calculated over the entire surface area of the implant, not over a partial sample of selected threads. All parameters were measured only for the vol- ume of the lower absorbable implant, after the titanium in the upper portion of the implant was excluded.
Vimp
VA==
(
1-mmmmVref)
×100 (1)Vref: the total volume of the reference implant not placed Vimp: the total volume of the placed implant
Sbone
VBIC==
(
mmmmmSimp)
×100 (2)Sbone: the area of the implant surface in contact with bone Simp: the total of the implant surface
Fig. 2.Smoothed micro-computed tomography image of the absorbable implant in axial (A) and coronal (F) slices. Segmented images of the bone in axial (B) and coronal (G) slices. Segmented images of the implant in axial (C) and coronal (H) slices. Hole-filled images of the implant in axial (D) and coronal (I) slices. The implant surface in direct contact with the bone in axial (E) and coronal (J) slices
A B C D E
F G H I J
The samples were also sliced for 2D histomorphometric analysis. 2D optical images of the slices were analyzed and recorded at a magnification of 100× using an optical microscope (BH-2TM, Olympus Optical, Osaka, Japan).
The images were analyzed with the ScopeEye image ana- lysis software (Tecsan, Seoul, Korea). 2D BIC and BA were measured based on the conventional histomorpho- metric method.25For statistical analysis, ANOVA was per- formed using SPSS version 19 (SPSS Inc., Chicago, IL, USA) in order to evaluate variation in the mean implant healing period. Pearson’s correlation analysis was also performed to assess correlations between the 3D and 2D measurements.
Results
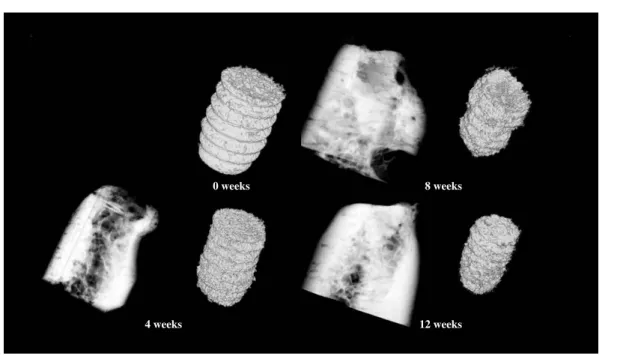
Table 1 shows the distribution of the implants that were used for analysis and placed in the lower jaw of the beagle dogs. The reconstructed volumes of bone and the imp- lants after segmentation were rendered in 3D, and the 3D reconstructed images were organized to reflect variation in the healing period (Fig. 3). In the images, we observed an increase in implant absorption as the healing period increased. The extent of absorption of an implant after eight weeks was shown to be quite different from that indi- cated by the initial 3D implant thread positions. The mean VA values of the implant area were 23.46±5.25% at four weeks, 38.89±2.46% at eight weeks, and 41.94±4.51%
at 12 weeks after implant placement, showing a signifi- cant increase as the healing period was extended (p⁄0.05) (Table 2). The mean VBIC values were 17.67±3.20% at four weeks, 25.23±4.36% at eight weeks, and 36.18±
4.33% at 12 weeks. The mean VBIC also increased signi- ficantly as the healing period increased (p⁄0.05) (Table 2).
The mean 2D BA values according to histomorpho- metric analysis were 62.07±8.43% at four weeks, 72.25
±27.91% at eight weeks, and 82.01±21.34 % at 12 weeks after implant placement (Fig. 4). The BA values increased over time, but did not show a statistically signi-
Table 1.Distribution of the placed implants used for analysis
Period Implantation site Number
4 weeks Second premolar 4
Fourth premolar 4
8 weeks Second premolar 3
Fourth premolar 4
12 weeks Second premolar 3
Fourth premolar 3
Table 2.Volumetric absorption (VA) and volumetric bone-implant contact (VBIC) of the absorbable implants evaluated with micro- CT analysis, by treatment period (mean±SD)
Period 4 weeks 8 weeks 12 weeks
VA (%) 23.46±5.25 38.89±2.46 41.94±4.51
VBIC (%) 17.67±3.20 25.23±4.36 36.18±4.33
0 weeks 8 weeks
4 weeks 12 weeks
Fig. 3.Three-dimensional rendering of the reconstructed volumes shows the bone and implant after segmentation.
ficant relationship with the length of the healing period (p¤0.05) (Table 3). The mean 2D BIC values were 30.57
±6.59% at four weeks, 32.20±9.13% at eight weeks, and 35.50±10.63% at 12 weeks. Similarly to the BA val- ues, the BIC values increased over time, but this relation- ship was not statistically significant (p¤0.05) (Table 3).
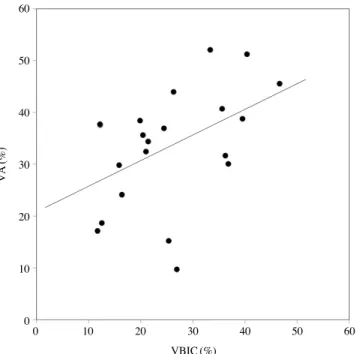
Table 4 shows the Pearson’s correlation coefficients bet- ween the 3D micro-CT measurements and the results of 2D histomorphometric analysis. VBIC was highly signi- ficantly correlated with VA (p⁄0.05) (Fig. 5) and was significantly correlated with 2D BIC (p⁄0.05). 2D BA exhibited no correlations with the other parameters.
Discussion
Surgical technique, quality and quantity of bone, and osseointegration of the implant are important factors in successful implant treatment. In particular, osseointegra- tion is known to be affected by factors such as the surface characteristics and biological compatibility of an implant.1 Increased roughness on the surface of an implant tends to increase BIC.26,27The recently developed method of acid etching uses surface corrosion to increase osseointegra- tion.28,29There has been less interest in assessing implant
treatment in the jaws of children than in the jaws of adults.
It is necessary to develop implants that can be used for the treatment of congenital and accidental tooth loss dur- ing the growth phase. The installation of implants made with non-absorbable material in children can lead to lower sedimentation of the implant, caused by the growth of the surrounding alveolar bone.2In addition to this, ankylosed implants may inhibit the alveolar bone, preventing it from undergoing the growth experienced elsewhere in the jaws.3
Fig. 4.Histomorphometric images show the absorbable implant (100×) at four weeks (A), eight weeks (B), and 12 weeks (C) after placement.
A B C
Table 3.Two-dimensional bone area (BA) and bone-implant con- tact (BIC) of the absorbable implants, evaluated with histomor- phometric analysis, by treatment period (mean±SD).
Period 4 weeks 8 weeks 12 weeks
BA (%) 62.07±8.43 72.25±27.91 82.01±21.34 BIC (%) 30.57±6.59 32.20±9.13 35.50±10.63
Fig. 5.The relationship between the volumetric bone-implant con- tact ratio (VBIC, %) and volumetric absorption (VA, %) (Pearson’s correlation==0.46, p⁄0.05).
VA(%)
60
50
40
30
20
10
00 10 20 30 40 50 60
VBIC (%)
Absorbable implants can minimize the side effect of lower sedimentation, since the implant is absorbed internally after placement. We have been developing an implant made of absorbable material that can be absorbed even in cases of lower sedimentation. This new type of implant is currently under a preclinical trial in order to gather more data that would justify a clinical trial.
In general, a threshold method is used in micro-CT ana- lysis to segment the areas of the bone and implant.16-22An adequate threshold for the bone and implant is selected by superimposing segmented images over the original gray- scale images.30,31 The threshold technique used in micro- CT analysis cannot be used to separate areas of absorb- able implant and bone. The histogram of these areas does not present the clear bimodal characteristics of metal imp- lants, because the voxel intensities of absorbable implant material are similar to those of bone in micro-CT images.
Additionally, the absorbable implant area displays an int- rinsic inhomogeneity of voxel intensities that is not found in areas with a metal implant, since absorbable implants are composed of composite materials. Therefore, if an absorbable implant is present, is not possible to accomp- lish segmentation by directly using the threshold method, which is based on the presence of homogeneous voxel intensities. In order to solve these issues, we employed a region-based segmentation method that uses region-grow- ing and region-labeling algorithms. Finally, the area of bone-implant contact determined by the segmentation re- sults was validated by visual inspection after superimpo- sing the contact area over the original unsegmented image.
We were able to determine the area of bone-implant con- tact over the entire surface of the implant by segmenting the micro-CT images with inhomogeneous voxel inten- sities using the region-based method.
Evaluations of BA and BIC through histomorphometric analysis are the parameters most widely used to measure osseointegration. In this study, histomorphometric analy-
sis did not show that the BA and BIC of the absorbable implant significantly increased during the healing process.
The exact positioning of the absorbable implant thread and its radius setting were difficult to measure in the 2D histomorphometric analysis of BA and BIC, because the thread morphology of the implant changed during healing through processes of absorption and distortion. This dif- ficulty may have resulted in the lack of statistical signifi- cance. In order to overcome these problems in the histo- morphometric analysis, the entire volume of the implant was taken into account when calculating the VBIC ratio and VA using micro-CT analysis. The 3D VBIC ratio and VA, as measured by the micro-CT method, increased sig- nificantly during healing. Moreover, the 3D measurements of VBIC and VA using the micro-CT analysis were highly correlated with each other, despite continuous changes in the morphology of the implant. This implies that the 3D osseointegration and absorption of the absorbable implant increase simultaneously at the implant surface during heal- ing.
Nonetheless, the 3D VBIC ratio for the absorbable imp- lant was significantly correlated with 2D BIC. However, other correlations among the results of the two methods were weak. The histomorphometric analysis provided only 2D measurements for the sectioned slices. Measurements using only fractional slices cannot indicate the total absorp- tion or total BIC of the absorbable implant. The lack of statistical significance regarding osseointegration over time and the lack of correlation between the two mea- surement systems may have been caused by the inherent limitations of histomorphometric analysis, which is based on 2D measurements.
In conclusion, we were able to quantify VBIC and VA for an absorbable implant using micro-CT analysis based on a region-based segmentation method. Osseointegration was evaluated over the entire surface of the implant, which may overcome some limitations of histomorphometric analysis applied to absorbable implants. In future studies, we will apply the method described here to overcome the limitations of micro-CT analysis of the BIC around metal implants. These limitations are mainly related to metal artifacts in computed tomography images, and overcom- ing them may enable the more accurate assessment of VBIC in metal implants.
References
1. Schnitman PA, Wöhrle PS, Rubenstein JE, DaSilva JD, Wang NH. Ten-year results for Brånemark implants immediately Table 4.Pearson’s correlation coefficients between two-dimen-
sional histomorphometric and three-dimensional micro-CT analy- ses, including bone-implant contact ratio (BIC), bone area (BA), volumetric bone-implant contact ratio (VBIC), and volumetric absorption (VA)
BIC BA VBIC VA
BIC 0.03 (0.45) 0.34 (0.05)* 0.31 (0.07)
BA 0.03 (0.45) 0.26 (0.87) 0.33 (0.68)
VBIC 0.34 (0.05)* 0.26 (0.87) 0.46 (0.00)*
VA 0.31 (0.07) 0.33 (0.68) 0.46 (0.00)*
*p⁄0.05
loaded with fixed prostheses at implant placement. Int J Oral Maxillofac Implants 1997; 12: 495-503.
2. Rossi E, Andreasen JO. Maxillary bone growth and implant positioning in a young patient: a case report. Int J Periodon- tics Restorative Dent 2003; 23: 113-9.
3. Tarlow JL. The effect of adult growth on an anterior maxil- lary single-tooth implant: a clinical report. J Prosthet Dent 2004; 92: 213-5.
4. Laffargue P, Fialdes P, Frayssinet P, Rtaimate M, Hildebrand HF, Marchandise X. Adsorption and release of insulin-like growth factor-I on porous tricalcium phosphate implant. J Biomed Mater Res 2000; 49: 415-21.
5. Robert P, Mauduit J, Frank RM, Vert M. Biocompatibility and resorbability of a polylactic acid membrane for periodontal guided tissue regeneration. Biomaterials 1993; 14: 353-8.
6. Kulkarni RK, Pani KC, Neuman C, Leonard F. Polylactic acid for surgical implants. Arch Surg 1966; 93: 839-43.
7. Karabuda C, Ozdemir O, Tosun T, Anil A, Olgaç V. Histolo- gical and clinical evaluation of 3 different grafting materials for sinus lifting procedure based on 8 cases. J Periodontol 2001; 72: 1436-42.
8. Brånemark PI, Hansson BO, Adell R, Breine U, Lindström J, Hallén O, et al. Osseointegrated implants in the treatment of the edentulous jaw. Experience from a 10-year period. Scand J Plast Reconstr Surg Suppl 1977; 16: 1-132.
9. Albrektsson T, Brånemark PI, Hansson HA, Lindström J.
Osseointegrated titanium implants. Requirements for ensuring a long-lasting, direct bone-to-implant anchorage in man. Acta Orthop Scand 1981; 52: 155-70.
10. Kim DS, Kim DG, Park CJ, Cho LR. Histomorphometry and stability analysis of early loaded implants with two different surface conditions in beagle dogs. J Adv Prosthodont 2009; 1:
10-8.
11. Nkenke E, Hahn M, Weinzierl K, Radespiel-Troger M, Neu- kam FW, Engelke K. Implant stability and histomorphometry:
a correlation study in human cadavers using stepped cylinder implants. Clin Oral Implants Res 2003; 14: 601-9.
12. Deguchi T, Nasu M, Murakami K, Yabuuchi T, Kamioka H, Takano-Yamamoto T. Quantitative evaluation of cortical bone thickness with computed tomographic scanning for orthodon- tic implants. Am J Orthod Dentofacial Orthop 2006; 129:
721.e7-12.
13. Garetto LP, Chen J, Parr JA, Roberts WE. Remodeling dyna- mics of bone supporting rigidly fixed titanium implants: a his- tomorphometric comparison in four species including humans.
Implant Dent 1995; 4: 235-43.
14. Roberts WE. Bone tissue interface. J Dent Educ 1988; 52:
804-9.
15. Le Guehennec L, Goyenvalle E, Lopez-Heredia MA, Weiss P, Amouriq Y, Layrolle P. Histomorphometric analysis of the osseointegration of four different implant surfaces in the fem- oral epiphyses of rabbits. Clin Oral Implants Res 2008; 19:
1103-10.
16. Rebaudi A, Koller B, Laib A, Trisi P. Microcomputed tomo- graphic analysis of the peri-implant bone. Int J Periodontics Restorative Dent 2004; 24: 316-25.
17. Park HS, Kwon OW, Sung JH. Microscrew implant ancho- rage sliding mechanics. World J Orthod 2005; 6: 265-74.
18. Schicho K, Kastner J, Klingesberger R, Seemann R, Enislidis G, Undt G, et al. Surface area analysis of dental implants using micro-computed tomography. Clin Oral Implants Res 2007;
18: 459-64.
19. Van Oossterwyck H, Duyck J, Vander Sloten J, Van der Perre G, Jansen J, Wevers M, et al. Use of microfocus computeri- zed tomography as a new technique for characterizing bone tissue around oral implants. J Oral Implantol 2000; 26: 5-12.
20. Bernhardt R, Kuhlisch E, Schulz MC, Eckelt U, Stadlinger B.
Comparison of bone-implant contact and bone-implant vol- ume between 2D-histological sections and 3D-SRrμCT slices.
Eur Cell Mater 2012; 23: 237-48.
21. Park YS, Yi KY, Lee IS, Jung YC. Correlation between micro- tomography and histomorphometry for assessment of implant osseointegration. Clin Oral Implants Res 2005; 16: 156-60.
22. Liu S, Broucek J, Virdi AS, Sumner DR. Limitations of using micro-computed tomography to predict bone-implant contact and mechanical fixation. J Microsc 2012; 245: 34-42.
23. Debats OA, Litjens GJ, Barentsz JO, Karssemeijer N, Huis- man HJ. Automated 3-dimensional segmentation of pelvic lymph nodes in magnetic resonance images. Med Phys 2011;
38: 6178-87.
24. Singh UP, Saxena K, Jain S. Semi-supervised method of mul- tiple object segmentation with a region labeling and flood fill.
Signal Image Process 2011; 2: 175-93.
25. Park JW, An CH, Jeong SH, Suh JY. Osseointegration of commercial microstructured titanium implants incorporating magnesium: a histomorphometric study in rabbit cancellous bone. Clin Oral Implants Res 2012; 23: 294-300.
26. Piattelli M, Scarano A, Paolantonio M, Iezzi G, Petrone G, Piattelli A. Bone response to machined and resorbable blast material titanium implants: an experimental study in rabbits. J Oral Implantol 2002; 28: 2-8.
27. Buser D, Schenk RK, Steinemann S, Fiorellini JP, Fox CH, Stich H. Influence of surface characteristics on bone integra- tion of titanium implants. A histomorphometric study in mini- ature pigs. J Biomed Mater Res 1991; 25: 889-902.
28. Jeong R, Marin C, Granato R, Suzuki M, Gil JN, Granjeiro JM, et al. Early bone healing around implant surfaces treated with variations in the resorbable blasting media method. A study in rabbits. Med Oral Patol Oral Cir Bucal 2010; 15:
e119-25.
29. Rohner D, Tay A, Chung SM, Hutmacher DW. Interface of unloaded titanium implants in the iliac crest, fibula, and sca- pula: a histomorphometric and biomechanical study in the pig. Int J Oral Maxillofac Implants 2004; 19: 52-8.
30. Butz F, Ogawa T, Chang TL, Nishimura I. Three-dimensional bone-implant integration profiling using micro-computed tomography. Int J Oral Maxillofac Implants 2006; 21: 687-95.
31. Ko CY, Lim DH, Choi BH, Li J, Kim HS. Suggestion of new methodology for evaluation of osseointegration between imp- lant and bone based on μ-CT images. Int J Precis Eng Man 2010; 11: 785-90.