Clinical Implications of Glucose Variability: Chronic Complications of Diabetes
Hye Seung Jung
Department of Internal Medicine, Seoul National University College of Medicine, Seoul, Korea
Glucose variability has been identified as a potential risk factor for diabetic complications; oxidative stress is widely regarded as the mechanism by which glycemic variability induces diabetic complications. However, there remains no generally accepted gold standard for assessing glucose variability. Representative indices for measuring intraday variability include calculation of the standard deviation along with the mean amplitude of glycemic excursions (MAGE). MAGE is used to measure major intraday excursions and is easily measured using continuous glucose monitoring systems. Despite a lack of randomized controlled trials, recent clinical data suggest that long-term glycemic variability, as determined by variability in hemoglobin A1c, may contribute to the development of microvascular complications. Intraday glycemic variability is also suggested to accelerate coronary artery disease in high-risk patients.
Keywords: Glucose variability; Microvascular complications; Macrovascular complications
INTRODUCTION
Diabetic patients with similar mean glucose levels often ex- hibit differences in terms of both the number and degree of glucose excursions. This phenomenon, termed glucose vari- ability, has been suggested as a factor associated with diabetic complications. The development of continuous glucose moni- toring (CGM) systems has revolutionized the monitoring of short-term glucose variability, and understanding of the role of glucose fluctuations is in progress. Here, we provide an over- view of the methods used to measure glucose variability and review the literatures on clinical implications associated with glucose variability.
GLUCOSE VARIABILITY MEASUREMENT
Table 1 describes the formulas underlying commonly used mea- surements and their characteristics. There is no generally accept- ed gold standard and little consensus regarding which method offers the most meaningful assessment of glucose variability.
Among the most commonly used methods is the standard devia- tion (SD). It can be calculated from self-monitoring of blood glucose (SMBG) levels. Since CGM was available, the mean amplitude of glycemic excursions (MAGE) has been widely used, too.
To avoid distortions in variability due to glycemic exposure, calculations of glucose variability should be devoid of a time component: glucose excursion×time=glycemic exposure, but not variability. Similarly, the formula glucose excursion/
Received: 19 May 2015, Revised: 22 May 2015, Accepted: 22 May 2015
Corresponding author: Hye Seung Jung
Department of Internal Medicine, Seoul National University College of Medicine, 101 Daehak-ro, Jongno-gu, Seoul 110-744, Korea
Tel: +82-2-2072-0240, Fax: +82-2-762-9662, E-mail: [email protected]
Copyright © 2015 Korean Endocrine Society
This is an Open Access article distributed under the terms of the Creative Com- mons Attribution Non-Commercial License (http://creativecommons.org/
licenses/by-nc/3.0/) which permits unrestricted non-commercial use, distribu- tion, and reproduction in any medium, provided the original work is properly cited.
time=slope is the rate of glucose change, but not its magnitude [1]. Unlike the integrated measurement of long-term glucose control provided by hemoglobin A1c (HbA1c), glycemic vari- ability requires comprehensive assessment of glycemia. CGM systems provide a more accurate measure of glycemia than does SMBG; however, issues of reproducibility limit the utility of this approach [2].
Intraday variability
The simplest method of assessing intra-day variability of serum glucose is to calculate the SD or coefficient of variation (CV) of multiple SMBG readings taken over the course of a day. Usually 7-point glucose measures are used, although important fluctua- tions can be missed simply because they occur between two measurements (Fig. 1). Furthermore, it is difficult to obtain in- formation on nocturnal glycemic patterns. CGM systems are
able to overcome many of the issues with SMBG glucose curves, though the data are still not normally distributed, a con- dition necessary for calculating the SD. However, the SD corre- lates well with other variability measures and is the only mea- surement identified to date where a relationship between glu- cose variability and mortality in intensive care unit can be dem- onstrated [3,4]. For these reasons, some groups have suggested the SD as the preferred method for assessing intraday glucose variability [5].
MAGE was originally developed using hourly glucose sam- ples taken from venous blood [6], and it has emerged as the preferred method for assessing CGM data. In the example pre- sented in Fig. 2, 1 SD of the mean glucose level for each 24- hour period acts as an individualized standard; only one limb of the excursion >1 SD, either ascending or descending, is used to calculate subsequent excursions. The arithmetic mean Table 1. Formulas Used to Describe Glucose Variability
Variability measure Formula Explanation of symbols
SD ∑(xi-x)2
k-1
xi=individual observation x=mean of observations k=number of observations
CV s
x
s=standard deviation x=mean of observations MAGE
∑ λ
n if λ>v λ=each blood glucose increase or decrease (nadir-peak or peak nadir)
n=number of observations
v=1 SD of mean glucose for 24-hour period Adjusted M value MGR +MW where
MGR=∑ 10log GRt
IGV and MW= Gmax 20- Gmin
M GR=M-value for glucose readings M w=correction factor for n<24 GRt=glucose reading at time t IGV=ideal glucose value
ti= time in minutes after start of observations of the ith observation
Gmax=maximum glucose reading Gmin =minimum glucose reading J-index 0.001×(MBG+SD)2 for glucose measured in mg/dL
CONGA
∑(D-D)2 k*-1
where Dt=GRt - GRt-m andD= ∑kD*t
k*= number of observations where there is an observation n×60 minutes ago
m=n×60
Dt= difference between glucose reading at time t and t minus n hours ago
MODD
D=∑ GRik-GR* i-1440
Units are in mmol/L or mg/dL depending on the unity of the glucose values measured. To convert glucose values from mg/dL to mmol/L multiply by 0.0555. Adapted from Siegelaar et al. [5], with permission from Endocrine Society.
SD, standard deviation; CV, coefficient of variation; MAGE, mean amplitude of glycemic excursion; MBG, mean blood glucose; CONGA, continu- ous overall net glycemic action; MODD, mean of daily difference.
3 t=ti
t=ti
t=ti
tk* tk
n
tk*
t=ti
tk*
of these glycemic excursions over the period of study (24 hours or longer) is then used to calculate the MAGE; an auto- mated algorithm has been created for this calculation [7]. Us- ing this method, the mean glucose value becomes the refer- ence point for glycemic variability. However, because the MAGE represents only major excursions from the mean and ignores excursions of <1 SD, this approach disregards smaller excursions that may be important.
The M-value was developed to quantify glycemic control of patients with type 1 diabetes mellitus (T1DM) using a refer- ence value of six blood sugar measurements taken over a 24- hour period [8]. This approach measures the stability of glu- cose excursions relative to a user-defined “ideal” value rang- ing from 80 to 120 mg/dL. As a result, differences in user-de- fined “ideal” values have limited the ability to compare results between studies. In addition, M-values rise in response to in- creasing glycemic variability and poor glycemic control, mak- ing it difficult to distinguish between patients with high mean glucose levels and high glucose variability. Because hypogly- cemia has a greater impact on the M-value than does hyper- glycemia, this method is more relevant as a clinical, rather than a mathematical, indicator of glycemic control. A similar index which takes into account both the mean glucose level and variability of glycemia is the J-index [9].
In 1999, a new method, continuous overall net glycemic ac- tion (CONGA)-n, was developed specifically for use with CGM data [10]. This method calculates the difference between
current glucose levels and that of glucose levels n hours previ- ously, with n varying from 1 to 8 hours; readouts are then calcu- lated using the SD of these differences. Because CONGA does not require arbitrarily defined glucose cutoffs or changes in glu- cose levels, this approach provides an objective assessment of glycemic variability over short time intervals. However, glu- cose differences are not normally distributed, limiting the appli- cability of this approach. Furthermore, which time segments produce the most useful results has yet to be determined.
Outside of measuring glucose itself, serum 1,5-anhydroglu- citol (1,5-AG) levels have been suggested as a means of as- sessing glycemic excursions [11]. 1,5-AG is a polyol main-
Blood glucose (mg/dL)
350 300 250 200 150 100 50
012 AM 5 AM 6 AM 10 AM 12 PM 2 PM 6 PM 12 PM
Fig. 1. Twenty-four-hour glycemic curves of two patients with di- abetes (red and blue lines). The two patients exhibit different pat- terns of glycemic variation; however, standard deviations calcu- lated across all four points, before each meal and at bedtime (ar- rows), do not reflect this because the glucose measures are similar between the two patients at those points.
Fig. 2. Continuous glucose monitoring in a patient with type 1 di- abetes mellitus. Qualifying excursions are shown as blue arrows (only the inflection components in this case). Each inflection in- corporates several excursions smaller than 1 standard deviation (SD) within a given day (44 mg/dL for day 1 and 65 mg/dL for day 2). The averaged excursion (that is, mean amplitude of glyce- mic excursion [MAGE]) is (A) 85.0 mg/dL for day 1 and (B) 156.5 mg/dL for day 2. MAGE calculated from the entire 48-hour time course (SD, 56.5 mg/dL) was 131.5 mg/dL; this level was similar across each day of the study period (120.7 mg/dL). Similar MAGE values could also be calculated from the descending limbs.
Time (hr)
Glucose (mg/dL)
255
191 SD 44
204 297
Day 1
293 195 396
352 308 264 220 176 132 88 44
017 19 21 23 1 3 5 7 9 11 13 15 A
MAGE 85 mg/dL
Time (hr) MAGE 156.5 mg/dL
Glucose (mg/dL)
SD 65 107
338 Day 2
244 162 390
325 260 195 130 65
017 19 21 23 1 3 5 7 9 11 13 15 B
tained within stable limits in subjects with healthy glucose levels. Its reabsorption in the kidney is inhibited by excessive excretion of urinary glucose; the higher the plasma glucose concentration, the lower the concentration of plasma 1,5-AG [12]. Urinary glucose only appears at plasma glucose concen- trations over 160 mg/dL; therefore, 1,5-AG level seems of lit- tle use in detecting glucose fluctuations below this range. In addition, because both chronic and intermittent hyperglycemia are characterized by low concentrations of 1,5-AG, the corre- lation between glucose variability and 1,5-AG is poor when mean glucose levels remain high persistently. Use of the 1,5- AG concentration as a clinical marker is therefore limited to patients with postprandial hyperglycemia with HbA1c levels below 8% [13,14]. Even though, 1,5-AG is not able to provide a direct measurement of glucose fluctuations, limiting the abil- ity of this method to measure both the size and frequency of glycemic excursions.
Interday variability
The easiest way to measure interday variability of serum glu- cose is by calculating the SD of the fasting blood glucose con- centration [15]. The absolute mean of daily differences (MODD) using hourly blood sampling was developed as a supplement to MAGE and mean blood glucose testing; this approach calculates the mean absolute value of the differences between glucose values on two consecutive days at the same time [16]. However, the timing of meals can greatly affect MODD scores, making a strict dietary regimen essential for accurate monitoring.
Long-term variability
The SD of the fasting blood glucose or HbA1c can be used to assess long-term variability in serum glucose levels, the latter of which having been found to be a significant prognostic fac- tor for microvascular complications, as discussed below.
CONTRIBUTION OF GLUCOSE VARIABILITY TO CHRONIC COMPLICATIONS
It has been suggested that glucose variability may have been responsible for differences in microvascular outcomes be- tween intensively and conventionally treated T1DM patients with the same mean HbA1c in the Diabetes Control and Com- plications Trial (DCCT) [17]. Although this hypothesis has since been refuted by the study authors themselves [18], inter-
est in the relationship between glucose variability and chronic complications of diabetes has persisted. This interest has yet to progress to the point of randomized clinical trials, making the connection between these two factors largely speculative.
Hyperglycemia is thought to induce oxidative stress, which has been shown to exacerbate diabetic complications through a variety of molecular mechanisms [19]. The proposed contri- bution of glucose variability is supported by reports that oxi- dative stress is greater for intermittent as opposed to sustained hyperglycemia [20-22], though contradictory evidence has also been reported [13,23,24].
Microvascular complications
In the case of T1DM, a large proportion of studies have been secondary analyses of either the DCCT or the follow-up Epi- demiology of Diabetes Interventions and Complications (EDIC) study. In these studies, the SD of SMBG results re- vealed no relationship between glucose variability and the risk of development or progression of microvascular complications (retinopathy and/or nephropathy) [18,25-27]. Glucose vari- ability did not contribute to the development of neuropathy, although neuropathy data were more limited than other clini- cal covariates [28]. However, according to a prospective ob- servational study that followed 100 patients with T1DM for 11 years, the SD of SMBG was found to be significantly related only with peripheral neuropathy and a borderline predictor of incidence (hazard ratio, 1.73; P=0.07) [29]. Therefore, these data suggest that the nervous system may be particularly vul- nerable to glycemic variability. However, these studies relied on SMBG data, which may miss fluctuations occurring be- tween the measurements.
A similar study assessing glycemic variability in T1DM pa- tients using both CGM and SMBG readings revealed a strong correlation between microvascular complications and higher glycemic variability by CGM, but not by SMBG [30]. How- ever, reproducibility remains an issue, with a conflicting report demonstrating no significant association between retinopathy and measures of glucose variability using CGM data in either T1DM or type 2 diabetes mellitus (T2DM) [31]. More studies are therefore necessary to determine the relationship between intraday glycemic variability and microvascular complica- tions. In the meantime, long-term fluctuations such as HbA1c variability and the CV/SD of fasting blood glucose have been implicated in the development of retinopathy or nephropathy in T1DM [32] and T2DM [33,34] by retrospective analyses.
However, even these associations remain controversial [35].
Macrovascular complications
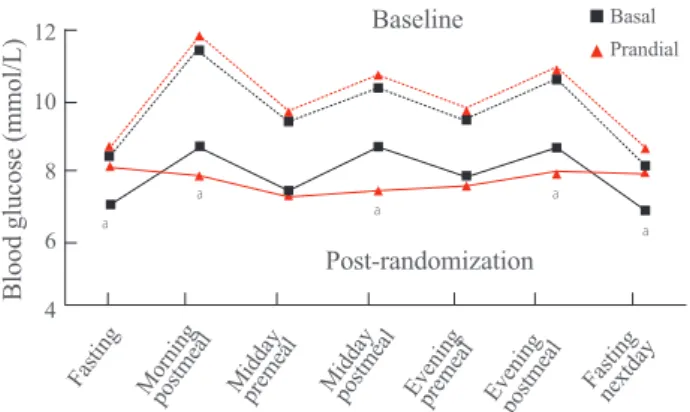
In terms of the DCCT study, the SD was not a predictor of car- diovascular events in patients with T1DM [36]. As for T2DM, some evidence of long-term variability in fasting plasma glu- cose as a prognostic factor for cardiovascular mortality has been seen in elderly patients [37]. Recent 7-point glucose data from the HEART2D study comparing basal insulin and pran- dial insulin after acute myocardial infarction (Fig. 3) reported no association between the mean absolute glucose (MAG), an intraday assessment of glucose variability, and the endpoint of combined cardiovascular events [38]. Because neither SD nor MAGE was significantly different between the two treatment groups, this interpretation has been challenged in part due to the reliance on MAG, with no other methods used to assess variability [39]. In the meanwhile, in patients with acute myo- cardial infarction, MAGE from CGM data collected at the time of admission independently predicted major adverse car- diac events [40,41]. A subsequent cross-sectional study also showed that short-term glucose variability, as determined by CGM, was associated with the severity of coronary artery dis- ease [42]. When we look at studies of surrogate endpoints such as subclinical atherosclerosis, more supportive evidence for associations with glucose variability can be found both in
T1DM and T2DM [43-46]. However, a substantial proportion of the T2DM studies included mixed populations of patients treated with diet alone, diet and oral antidiabetic medications, and insulin. As such, this may have been a confounding factor in many of the findings, requiring further subgroup analyses to more accurately assess risk factors in this population.
CONCLUSIONS
While the data remain very heterogeneous, some conclusions can be drawn from this literature review. First, in the absence of a true gold standard for determining glucose variability, MAGE and SD have become the go-to methods for variability testing. CGM systems appear to be preferable to SMBG for capturing variability because of the larger number of data points possible with this approach. Second, little supporting evidence linking short-term glucose variability and microvas- cular complications exists, with full confirmation requiring use of a CGM system, particularly in patients with T1DM.
The bulk of the T1DM data were derived from a single study (DCCT), limiting the generalizability of some conclusions;
further studies are necessary to determine whether these find- ings are consistent across different populations. Prospective analyses examining the effects of long-term variability on mi- crovascular complications are also needed. As for macrovas- cular complications, although the HEART2D trial suggested that lowering glucose variability does not improve cardiovas- cular outcomes in T2DM patients after acute myocardial in- farction, subsequent studies demonstrated that glycemic vari- ability has a probability of accelerating coronary artery disease in high-risk patients with T2DM. Large-scale randomized controlled trials are necessary to establish such a risk.
CONFLICTS OF INTEREST
No potential conflict of interest relevant to this article was re- ported.
ACKNOWLEDGMENTS
This study was supported by a grant from the Innovative Re- search Institute for Cell Therapy (A062260) by the Ministry of Health and Welfare, Republic of Korea.
Fig. 3. Glycemic measures in a randomized controlled trial com- paring prandial and basal insulin in patients with cardiovascular disease (HEART2D study). Seven-point mean self-monitoring of blood glucose profiles at baseline (dotted line) and throughout the study (solid line) are indicative of the treatment strategy. Only the change in the mean absolute glucose level, an alleged measure of glucose variability, was significantly different between treat- ments, with no observable differences in standard deviation or mean amplitude of glycemic excursion. Therefore, accurate inter- pretation of the relationship between glycemic variability and the endpoint of combined cardiovascular events in this trial is pru- dent. Adapted from Raz et al. [47], with permission from Ameri- can Diabetes Association. aP<0.05 between treatment.
Prandial Basal
Baseline
Post-randomization
Fasting Morning postmeal Middaypremeal Middaypostmeal Eveningpremeal Eveningpostmeal Fastingnextday
Blood glucose (mmol/L)
12 10 8 6 4
a a a
a a
REFERENCES
1. Service FJ. Glucose variability. Diabetes 2013;62:1398- 404.
2. Facchinetti A, Sparacino G, Cobelli C. Modeling the error of continuous glucose monitoring sensor data: critical as- pects discussed through simulation studies. J Diabetes Sci Technol 2010;4:4-14.
3. Krinsley JS. Glycemic variability: a strong independent predictor of mortality in critically ill patients. Crit Care Med 2008;36:3008-13.
4. Egi M, Bellomo R, Stachowski E, French CJ, Hart G. Vari- ability of blood glucose concentration and short-term mor- tality in critically ill patients. Anesthesiology 2006;105:244- 52.
5. Siegelaar SE, Holleman F, Hoekstra JB, DeVries JH. Glu- cose variability; does it matter? Endocr Rev 2010;31:171- 82.
6. Service FJ, Molnar GD, Rosevear JW, Ackerman E, Gate- wood LC, Taylor WF. Mean amplitude of glycemic excur- sions, a measure of diabetic instability. Diabetes 1970;19:644- 55.
7. Baghurst PA. Calculating the mean amplitude of glycemic excursion from continuous glucose monitoring data: an automated algorithm. Diabetes Technol Ther 2011;13:296- 302.
8. Schlichtkrull J, Munck O, Jersild M. The M-valve, an in- dex of blood-sugar control in diabetics. Acta Med Scand 1965;177:95-102.
9. Moberg E, Kollind M, Lins PE, Adamson U. Estimation of blood-glucose variability in patients with insulin-dependent diabetes mellitus. Scand J Clin Lab Invest 1993;53:507-14.
10. McDonnell CM, Donath SM, Vidmar SI, Werther GA, Cameron FJ. A novel approach to continuous glucose anal- ysis utilizing glycemic variation. Diabetes Technol Ther 2005;7:253-63.
11. Kishimoto M, Yamasaki Y, Kubota M, Arai K, Morishima T, Kawamori R, Kamada T. 1,5-Anhydro-D-glucitol evalu- ates daily glycemic excursions in well-controlled NIDDM.
Diabetes Care 1995;18:1156-9.
12. Buse JB, Freeman JL, Edelman SV, Jovanovic L, McGill JB. Serum 1,5-anhydroglucitol (GlycoMark): a short-term glycemic marker. Diabetes Technol Ther 2003;5:355-63.
13. Kim MJ, Jung HS, Hwang-Bo Y, Cho SW, Jang HC, Kim SY, Park KS. Evaluation of 1,5-anhydroglucitol as a mark- er for glycemic variability in patients with type 2 diabetes
mellitus. Acta Diabetol 2013;50:505-10.
14. Dungan KM, Buse JB, Largay J, Kelly MM, Button EA, Kato S, Wittlin S. 1,5-anhydroglucitol and postprandial hyperglycemia as measured by continuous glucose moni- toring system in moderately controlled patients with diabe- tes. Diabetes Care 2006;29:1214-9.
15. Shima K, Tanaka R, Morishita S, Tarui S, Kumahara Y.
Studies on the etiology of “brittle diabetes”. Relationship between diabetic instability and insulinogenic reserve. Di- abetes 1977;26:717-25.
16. Molnar GD, Taylor WF, Ho MM. Day-to-day variation of continuously monitored glycaemia: a further measure of diabetic instability. Diabetologia 1972;8:342-8.
17. Brownlee M, Hirsch IB. Glycemic variability: a hemoglo- bin A1c-independent risk factor for diabetic complications.
JAMA 2006;295:1707-8.
18. Lachin JM, Genuth S, Nathan DM, Zinman B, Rutledge BN; DCCT/EDIC Research Group. Effect of glycemic ex- posure on the risk of microvascular complications in the diabetes control and complications trial: revisited. Diabe- tes 2008;57:995-1001.
19. Brownlee M. Biochemistry and molecular cell biology of diabetic complications. Nature 2001;414:813-20.
20. Ceriello A, Esposito K, Piconi L, Ihnat MA, Thorpe JE, Testa R, Boemi M, Giugliano D. Oscillating glucose is more deleterious to endothelial function and oxidative stress than mean glucose in normal and type 2 diabetic pa- tients. Diabetes 2008;57:1349-54.
21. Monnier L, Colette C, Mas E, Michel F, Cristol JP, Boegn- er C, Owens DR. Regulation of oxidative stress by glycae- mic control: evidence for an independent inhibitory effect of insulin therapy. Diabetologia 2010;53:562-71.
22. Monnier L, Mas E, Ginet C, Michel F, Villon L, Cristol JP, Colette C. Activation of oxidative stress by acute glucose fluctuations compared with sustained chronic hyperglyce- mia in patients with type 2 diabetes. JAMA 2006;295:1681- 7.
23. Siegelaar SE, Barwari T, Kulik W, Hoekstra JB, DeVries JH. No relevant relationship between glucose variability and oxidative stress in well-regulated type 2 diabetes pa- tients. J Diabetes Sci Technol 2011;5:86-92.
24. Wentholt IM, Kulik W, Michels RP, Hoekstra JB, DeVries JH. Glucose fluctuations and activation of oxidative stress in patients with type 1 diabetes. Diabetologia 2008;51:183- 90.
25. Kilpatrick ES, Rigby AS, Atkin SL. The effect of glucose
variability on the risk of microvascular complications in type 1 diabetes. Diabetes Care 2006;29:1486-90.
26. Kilpatrick ES, Rigby AS, Atkin SL. Effect of glucose vari- ability on the long-term risk of microvascular complica- tions in type 1 diabetes. Diabetes Care 2009;32:1901-3.
27. Service FJ, O’Brien PC. The relation of glycaemia to the risk of development and progression of retinopathy in the Diabetic Control and Complications Trial. Diabetologia 2001;44:1215-20.
28. Siegelaar SE, Kilpatrick ES, Rigby AS, Atkin SL, Hoeks- tra JB, Devries JH. Glucose variability does not contribute to the development of peripheral and autonomic neuropa- thy in type 1 diabetes: data from the DCCT. Diabetologia 2009;52:2229-32.
29. Bragd J, Adamson U, Backlund LB, Lins PE, Moberg E, Oskarsson P. Can glycaemic variability, as calculated from blood glucose self-monitoring, predict the development of complications in type 1 diabetes over a decade? Diabetes Metab 2008;34(6 Pt 1):612-6.
30. Soupal J, Skrha J Jr, Fajmon M, Horova E, Mraz M, Skrha J, Prazny M. Glycemic variability is higher in type 1 diabe- tes patients with microvascular complications irrespective of glycemic control. Diabetes Technol Ther 2014;16:198- 203.
31. Sartore G, Chilelli NC, Burlina S, Lapolla A. Association between glucose variability as assessed by continuous glu- cose monitoring (CGM) and diabetic retinopathy in type 1 and type 2 diabetes. Acta Diabetol 2013;50:437-42.
32. Kilpatrick ES, Rigby AS, Atkin SL. A1C variability and the risk of microvascular complications in type 1 diabetes:
data from the Diabetes Control and Complications Trial.
Diabetes Care 2008;31:2198-202.
33. Gimeno-Orna JA, Castro-Alonso FJ, Boned-Juliani B, Lou-Arnal LM. Fasting plasma glucose variability as a risk factor of retinopathy in type 2 diabetic patients. J Diabetes Complications 2003;17:78-81.
34. Takao T, Ide T, Yanagisawa H, Kikuchi M, Kawazu S, Matsuyama Y. The effects of fasting plasma glucose vari- ability and time-dependent glycemic control on the long- term risk of retinopathy in type 2 diabetic patients. Diabe- tes Res Clin Pract 2011;91:e40-2.
35. Zoppini G, Verlato G, Targher G, Casati S, Gusson E, Biasi V, Perrone F, Bonora E, Muggeo M. Is fasting glucose variability a risk factor for retinopathy in people with type 2 diabetes? Nutr Metab Cardiovasc Dis 2009;19:334-9.
36. Kilpatrick ES, Rigby AS, Atkin SL. Mean blood glucose
compared with HbA1c in the prediction of cardiovascular disease in patients with type 1 diabetes. Diabetologia 2008;51:365-71.
37. Muggeo M, Verlato G, Bonora E, Zoppini G, Corbellini M, de Marco R. Long-term instability of fasting plasma glu- cose, a novel predictor of cardiovascular mortality in el- derly patients with non-insulin-dependent diabetes melli- tus: the Verona Diabetes Study. Circulation 1997;96:1750- 4.
38. Siegelaar SE, Kerr L, Jacober SJ, Devries JH. A decrease in glucose variability does not reduce cardiovascular event rates in type 2 diabetic patients after acute myocardial in- farction: a reanalysis of the HEART2D study. Diabetes Care 2011;34:855-7.
39. Monnier L, Colette C. Glycemic variability: can we bridge the divide between controversies? Diabetes Care 2011;34:1058-9.
40. Su G, Mi SH, Tao H, Li Z, Yang HX, Zheng H, Zhou Y, Tian L. Impact of admission glycemic variability, glucose, and glycosylated hemoglobin on major adverse cardiac events after acute myocardial infarction. Diabetes Care 2013;36:1026-32.
41. Wang X, Zhao X, Dorje T, Yan H, Qian J, Ge J. Glycemic variability predicts cardiovascular complications in acute myocardial infarction patients with type 2 diabetes melli- tus. Int J Cardiol 2014;172:498-500.
42. Su G, Mi S, Tao H, Li Z, Yang H, Zheng H, Zhou Y, Ma C.
Association of glycemic variability and the presence and severity of coronary artery disease in patients with type 2 diabetes. Cardiovasc Diabetol 2011;10:19.
43. Esposito K, Giugliano D, Nappo F, Marfella R; Campanian Postprandial Hyperglycemia Study Group. Regression of carotid atherosclerosis by control of postprandial hypergly- cemia in type 2 diabetes mellitus. Circulation 2004;110:214- 9.
44. Snell-Bergeon JK, Roman R, Rodbard D, Garg S, Maahs DM, Schauer IE, Bergman BC, Kinney GL, Rewers M.
Glycaemic variability is associated with coronary artery calcium in men with type 1 diabetes: the Coronary Artery Calcification in Type 1 Diabetes study. Diabet Med 2010;27:1436-42.
45. Barbieri M, Rizzo MR, Marfella R, Boccardi V, Esposito A, Pansini A, Paolisso G. Decreased carotid atherosclerotic process by control of daily acute glucose fluctuations in diabetic patients treated by DPP-IV inhibitors. Atheroscle- rosis 2013;227:349-54.
46. Mo Y, Zhou J, Li M, Wang Y, Bao Y, Ma X, Li D, Lu W,
Hu C, Li M, Jia W. Glycemic variability is associated with subclinical atherosclerosis in Chinese type 2 diabetic pa- tients. Cardiovasc Diabetol 2013;12:15.
47. Raz I, Wilson PW, Strojek K, Kowalska I, Bozikov V, Gitt
AK, Jermendy G, Campaigne BN, Kerr L, Milicevic Z, Jacober SJ. Effects of prandial versus fasting glycemia on cardiovascular outcomes in type 2 diabetes: the HEART2D trial. Diabetes Care 2009;32:381-6.