© 2014 The Korean Ophthalmological Society
This is an Open Access article distributed under the terms of the Creative Commons Attribution Non-Commercial License (http://creativecommons.org/licenses /by-nc/3.0/) which permits unrestricted non-commercial use, distribution, and reproduction in any medium, provided the original work is properly cited.
Original Article
Patterns of Subsequent Progression of Localized Retinal Nerve Fiber Layer Defects on Red-free Fundus Photographs in Normal-tension
Glaucoma
Tai Jun Kim, Young Kook Kim, Dong Myung Kim
Department of Ophthalmology, Seoul National University Hospital, Seoul, Korea
Purpose: To investigate patterns of subsequent progression of localized retinal nerve fiber layer (RNFL) defects and to quantify the extent of progression in normal-tension glaucoma (NTG) patients.
Methods: Thirty-three eyes of 33 consecutive NTG patients who had shown continuous progression of localized RNFL defect on serial red-free fundus photographs were selected for the study. Patterns of subsequent progression of localized RNFL defects were categorized, and extents of progression were quantified. Serial evaluations of disc stereophotographs and visual fields were also performed to detect progression.
Results: The most common pattern was continuous widening of the defect towards the macula (n = 11, 33.3%) followed by sharpening of the defect border after widening of the defect towards the macula (n = 5, 15.2%), continuous widening of the defect away from the macula (n = 2, 6.1%), and deepening of the defect after appearance of a new defect (n = 2, 6.1%). Four eyes (12.1%) simultaneously showed two patterns of subsequent progression. In 13 eyes that showed continuous widening of the defect, subsequent angular widening towards the macula and away from the macula were 9.2 ± 6.0° (range, 1.1° to 24.4°; n = 11) and 5.2 ± 4.9° (range, 0.3° to 11.3°; n = 2), respectively. Thirty-two eyes showed no progression of optic disc cupping. Out of the 21 eyes in which Humphrey central 30-2 threshold visual field tests were performed after progression of RNFL defects, 15 eyes showed no deterioration in the visual field.
Conclusions: There were nine patterns of subsequent progression of localized RNFL defects. Among them, continuous RNFL loss proceeding temporally was the most common one. Initial progression of the defect proceeded temporally, especially in the defect located at the inferior fundus, might be at a risk of further RNFL loss temporally.
Key Words: Low tension glaucoma, Nerve fibers, Progression
The glaucomatous damage is visible both in the retinal nerve fiber layer (RNFL) and the optic disc [1]. RNFL defect is the most sensitive parameter in detecting glaucom-
atous optic neuropathy [2], and serial RNFL examinations by red-free fundus photography are known to be more sen- sitive than color disc photographs or visual fields evalu- ations in detecting progression of glaucomatous optic neuro- pathies [3,4]. As the differences among optical coherence tomography (OCT) devices with regard to the measurement protocols and thickness values affect their ability to detect localized RNFL defects, red-free fundus photography still remains a useful and complementary tool in detecting
Received: October 23, 2013 Accepted: December 27, 2013
Corresponding Author: Dong Myung Kim, MD. Department of Ophthal- mology, Seoul National University Hospital, 101 Daehak-ro, Jongno-gu, Seoul 110-744, Korea. Tel: 82-2-2072-2087, Fax: 82-2-741-3187, E-mail:
[email protected]
RNFL defects and monitoring the progression of the defects. In the detection of localized RNFL defects using OCT devices, the deviation-from-normal map of the Cirrus OCT device and the 36-segment map of the 3D OCT device have the highest sensitivity (89.6% and 91.7%, respectively) compared to the circumpapillary RNFL para meters of both devices [5]. The sensitivity of the Spectralis OCT parameters ranged from 18.9% to 83.8% [6]. Furth ermore, the Spectralis HRA+OCT device revealed various degrees of circumpa- pillary RNFL thinning and disruption of circumpapillary RNFL reflectivity in the same location as the photographic RNFL defect for 23 (35.4%) of the 65 RNFL defects [7]. An earlier study evaluated progression of localized RNFL defects on red-free fundus photographs in normal-tension glaucoma (NTG). In most cases, RNFL loss proceeded temporally [8]. But little is known about patterns of subsequent progression of RNFL defects after initial progression. We investigated patterns of subsequent progression of localized RNFL defects on serial red-free fundus photographs and quantified extents of progression in NTG patients. This study may provide us which pattern of initial progression of localized RNFL defect is at a risk of further progression of defect.
Materials and Methods
Thirty-three eyes of 33 consecutive NTG patients that had shown subsequent progression of localized RNFL defects, as revealed by serial red-free fundus photographs, were selected by one ophthalmologist (DMK) for the study. These patients were followed up at the Glaucoma Clinic of Seoul National University Hospital between March 2001 and July 2013. NTG was defined as diurnal intraocular pressure (IOP) of 21 mmHg or lower without any medication, glauco- matous optic neuropathy, glaucomatous visual field defect, open anterior chamber angle, and no evidence of non-glau- comatous cause of optic nerve damage. Each patient had measurement of visual acuity, refraction, slit-lamp biomi- croscopy, diurnal IOP measurements with Goldmann applanation tonometer, central corneal thickness measur- ement, gonioscopy, disc stereophotography, red-free fundus photography, and automated perimetry. When the result of Humphrey central 30-2 threshold visual field test was within normal limits (n = 10), Humphrey Matrix 30-2 visual field test was performed. Disc stereophotography, red-free
fundus photography, and automated perimetry were performed annually or between 6 months and one year after the previous examination. Disc stereophotograph and red- free fundus photograph were taken with a digital fundus camera (VX-10; Kowa, Tokyo, Japan) after full dilation of the pupil. Sixty-degree, wide-angle views of the optic disc, carefully focused on the retina using the built-in split-line focusing device and centered between the fovea and the optic disc, were obtained for red-free fundus photographs and were reviewed on a LCD monitor.
Localized RNFL defect was defined as a dark wedge- shaped area with its tip touching the optic disc margin in the brightly striated pattern of the surrounding RNFL. The width of the defect at 1-disc diameter distance from the margin of the optic disc should be larger than that of the major retinal vessel [9]. The parameters, angle α and angle β, used to represent localized RNFL defects were defined as described elsewhere [8]. Angle α is the minimum angle that is made by a line from the center of the optic disc to the center of the macula and a line from the center of the optic disc to the optic disc margin where the nearest border of the RNFL defect meets the optic disc. The smaller the angle, the closer the RNFL defect to the fovea and the closer the visual field defect to the fixation. Angle β is the circum- ferential angle of the RNFL defect. The larger the angle, the wider the RNFL defect in circumferential width and the more diffuse the visual field defect.
Two examiners (TJK and YKK) masked to the subjects’
identities and test results classified 33 eyes into the following categories after reviewing serial red-free fundus photo- graphs: widening or deepening of the pre-existing defect, appearance of a new defect, or an ambiguous one. Widening was defined as a recognizable change in the distance bet- ween the border of the RNFL defect and the adjacent reference vessel. In these cases, the difference of angle β and the direction of the widening (towards or away from the macula) were determined using the angle-measuring program (Maro-view 5.4; Infinitt, Seoul, Korea) on a LCD monitor. Depth of the RNFL defect was determined acco- rding to the following two methods after equalizing brigh- tness and contrast of RNFL at the posterior pole among images on the LCD monitor. First, severity of the RNFL defect was divided into three grades (grade 1, mild defect;
grade 2, moderate defect; grade 3, severe defect) by evalua-
ting brightness and texture of the RNFL and degree of
blood vessel obscuration. This method was described in
detail elsewhere [2]. Grade 1 indicates fine striations of RNFL are visible and only large vessels are clearly visible;
grade 2, striations of RNFL are barely detectable and even small vessels are clearly visible; and grade 3, texture of the RNFL is not visible at all. Second, sharpness of temporal and nasal borders of the RNFL defect was compared among images. Deepening was defined as an increase in the grade of severity or as sharpening of the border of the pre-existing RNFL defect. Appearance of a new defect was determined when a localized defect ranging from grade 1 to 3 developed in the area where there had been no previous defect [2]. When the photograph had poor image quality or a change was too subtle to be considered progression, these cases were classified as ambiguous one and excluded from further evaluation.
Evaluation of serial red-free fundus photographs was independently performed twice by each examiner (TJK and YKK) and inter-observer discrepancies were resolved by adjudication of a third experienced examiner (DMK). Absolute values and changes of angle α and angle β were determined by averaging values measured by the two examiners. In the case of bilateral progression, only one eye was randomly selected.
Evaluations of serial disc stereophotographs and visual fields were also performed to detect progression. Progressive changes of the optic disc were defined as narrowing or notching of the neural rim, increased cup:disc ratio, or shift in the position of the vasculature. The optic disc changes were also evaluated by the two examiners in the same manner as done in the evaluation of red-free fundus photo- graphs and the discrepancy between them was resolved by adjudication of a third experienced examiner. Visual field defect progression was defined according to the GPA prog- ram of the Humphrey Field Analyzer. In cases that showed progression on the visual fields, pattern of progression was divided into three categories: deepening or extension of the pre-existing scotoma or a new scotoma not within or adjacent to the pre-existing scotoma [10]. The study protocol was approved by the institutional review board of Seoul National University Hospital Biomedical Research Institute (no. 1309-008-516). Statistical analysis was performed using MedCalc ver. 12.7.0 (MedCalc, Ostend, Belgium).
Results
Among the 33 eyes of the 33 NTG patients enrolled, no eye was classified as ambiguous one or as showing bilateral
continuous progression. Demographics and ophthalmic measurements are presented in Table 1. Mean age at diagnosis was 54.2 ± 11.4 years, and female patient comp- rised 57.6% of the study group. Mean follow-up period was 52.5 ± 31.5 months (range, 16 to 131 months). No patient had intraocular surgery other than cataract surgery or laser treatment. There was strong intra- and inter-observer agre- ements in determining progression of the RNFL defect for each progression criterion (widening of the defect towards the macula or away from the macula, severity grading of the defect, sharpening of the defect border, and occurrence of a new defect) (k-values ≥0.80).
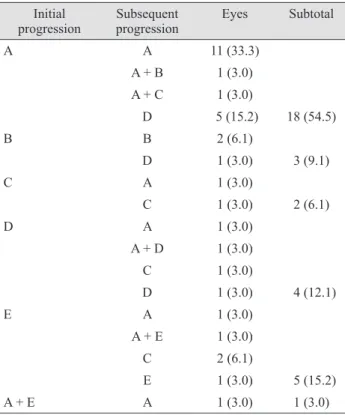
At the initial progression of the RNFL defect, the most common pattern of progression was widening of the defect towards the macula (54.5%) followed by appearance of a new defect (15.2%), sharpening of the defect border (12.1%), widening of the defect away from the macula (9.1%), and deepening of the defect (6.1%). One eye simultaneously showed two patterns of progression which were widening of the defect towards the macula and appearance of a new defect (Table 2).
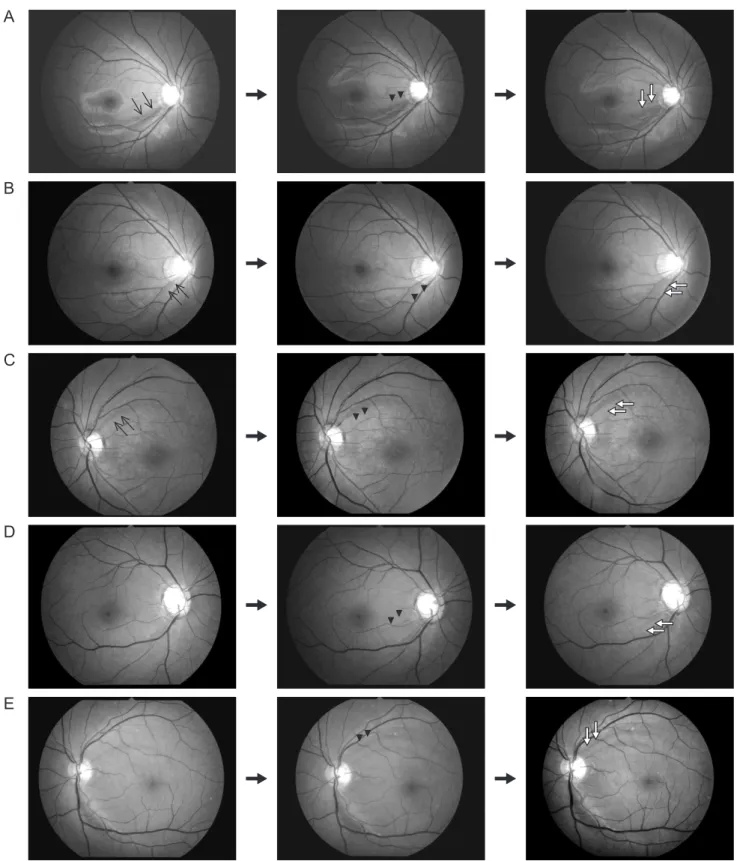
Regarding subsequent progression of RNFL defect, most of localized RNFL defects were located at both of the superotemporal and inferotemporal retina (n = 16). The most common pattern was continuous widening of the defect towards the macula (n = 11, 33.3%) followed by sharpening of the defect border after widening of the defect towards the macula (n = 5, 15.2%), continuous widening of the defect away from the macula (n = 2, 6.1%), and deepening of the defect after appearance of a new defect (n
= 2, 6.1%) (Fig. 1). Four eyes (12.1%) simultaneously showed
two patterns of subsequent progression. They had the
common feature of widening of the defect towards the
macula. Other combined patterns were widening of the
defect away from the macula, deepe ning of the RNFL
defect, sharpening of RNFL defect border, and appearance
of a new defect, respectively, in each eye (Table 2). In 13 eyes
that showed continuous widening of the defect, subsequent
angular widening towards the macula and away from the
macula were 9.2 ± 6.0° (range, 1.1° to 24.4°; n = 11) and 5.2 ±
4.9° (range, 0.3° to 11.3°; n = 2), respectively. In five eyes that
showed deepening of the defect, severity of the defect was
increased by one grade from grade 1. Only one eye showed
continuous deepening of the defect. Ten eyes had
sharpening of the defect border at initial or subsequent
progression, and the location was mostly at the temporal
border (n = 8). Continuous widening of the defect towards the macula occurred in 8 eyes (44.4%) out of 18 eyes with defects located at the inferior fundus, and in 3 eyes (20%) out of 15 eyes with defects located at the superior fundus.
Thirty-two eyes showed no progression of optic disc cup- ping. One eye showed increased notching at the time when initial progression of the RNFL defect was detected. Optic disc hemorrhages were found on the disc stereophotographs taken just before the detection of continuous progression of the RNFL defect (n = 7), at the time of detection (n = 1), and at both (n = 1).
Out of the 21 eyes in which Humphrey central 30-2 threshold visual field tests were performed after progression of RNFL defect, 15 eyes showed no deterioration in the vi- sual field and 1 eye was categorized as having a visual field with low reliability. Three eyes showed 'likely progression' involving deepening (n = 2) and extension (n = 1) of pre-ex- isting scotoma. Two eyes showed 'possible progression' in- volving either deepening of pre-existing scotoma or a new scotoma. In the remaining 12 eyes, 6 eyes had Humphrey
Matrix 30-2 visual field defect at the time of diagnosis and normal visual fields at the follow-up Humphrey central 30-2 threshold visual field tests, 2 eyes showed conversion of Humphrey Matrix 30-2 visual field defect to Humphrey central 30-2 threshold visual field defect at the follow-up, 1 eye had Humphrey Matrix 30-2 visual tests at the time of diagnosis and follow-up, and 3 eyes had no visual field tests performed at the time when progression of the RNFL defect was detected.
Discussion
In this study, subsequent progression of localized RNFL defects was categorized into nine patterns. The most com- mon pattern was continuous widening of the defect towards the macula (33.3%) followed by sharpening of the defect border after widening of the defect towards the macula (15.2%), continuous widening of the defect away from the macula (6.1%), and deepening of the defect after appearance Table 1. Demographics and ophthalmic measurements in the eyes with continuous progression of localized RNFL defects (n = 33)
Variables Values
Age at diagnosis (yr) 54.2 ± 11.4
Mean age (yr) 61.6 ± 10.8
Gender (female / male) 19 / 14
Follow-up period (mon) 52.5 ± 31.5
Systemic disease (%)
Diabetes mellitus 6
Hypertension 39.4
Central corneal thickness (μm, n = 26)
*509.6 ± 37.1
Highest IOP at diurnal IOP measurements (mmHg) 16.5 ± 2.4
Cup:disc ratio at initial visit
Horizontal / vertical 0.7 ± 0.1 / 0.7 ± 0.1
Location of localized RNFL defect
†Superotemporal retina/ inferotemporal retina/ both 5 / 12 / 16 eyes Humphrey central 30-2 threshold visual field at initial visit (dB, n = 23)
Mean deviation -4.7 ± 4.5
Pattern standard deviation 7.9 ± 4.5
Humphrey Matrix 30-2 visual field at initial visit (dB, n = 10)
Mean deviation -3.8 ± 3.6
Pattern standard deviation 4.3 ± 0.8
RNFL = retinal nerve fiber layer; IOP = intraocular pressure; dB = decibels.
*