Journal of Forest and Environmental Science
Journal of Forest and Environmental Science Vol. 32, No. 1, pp. 1-9, February, 2016 http://dx.doi.org/10.7747/JFES.2016.32.1.1
Research on the Accessibility of Urban Green Space Based on Road Network- A Case Study of the Park Green Space in City Proper of Nanjing
Yong Fan1, Ming-yuan Zhao2, Lin Ma2 and Lan-yong Zhao2,*
Departmenst of 1Ornamental Horticulture and 2Landscape Architecture, Shandong Agricultural University, China
Abstract
Accessibility of urban green space, as an important index of evaluating the service level of urban green space, not only shows the resident’s access to green space, but also reflects the environment quality of urban living. Since the quantity, area and space distribution of the patches in urban green space directly affect the function of urban green space and the quality of urban environment, the research on the accessibility of urban green space holds great significance to improve the service of urban green space and the living environment quality. Based on GIS software, this research uses the road network and the population distribution data of Nanjing’s city proper to conduct quantitative analysis of the accessibility of park green space and the convenience for residents to travel under different forms of transportation.
After the case analysis, the author tests the application of road network in studying the accessibility of urban park green space and proposes a GIS-based method to study the accessibility and the rational layout of urban green space.
Key Words: urban green space, road network structure, GIS technology, accessibility analysis
Received: March 31, 2015. Revised: September 18, 2015. Accepted: October 6, 2015.
Corresponding author: Lan-yong Zhao
College of Forestry, Shandong Agricultural University, Daizong Road No.61,Taian City, Shandong Prov., China Tel: 8613853186399, Fax: 8653189736319, E-mail: [email protected]
Introduction
Urban green space system is an important part of urban ecosystem. As the main natural landscape and place for lei- sure and recreation in city, the area, quantity, planning, de- sign and space layout of urban green space all concern the living environment quality of urban residents and the daily recreational activities. The early studies on urban park mostly focused on a single park or some typical parks and they mainly researched citizen’s perception and use of park, the structure and the ecological, economic and social bene- fits of park (Oguz 2000; Tzeng et al. 2002; Swanwick et al.
2003; Amberger 2006; Jim and Chen 2006; Neuvonen et al. 2007). However, can the existing urban green space
meet the needs of citizens? Can the space distribution pro- vide citizens with equal recreational opportunities? Where should the new urban green space be constructed to serve more citizens and to realize the reasonable distribution of urban park? All these questions require the research on the space distribution of urban green space.
Accessibility is widely used in transportation planning, urban planning, land planning and other fields and it is an effective index to measure the structure of traffic network.
As a research hotspot at home and abroad, it is also one of the effective factors to evaluate the opportunity of regional development and the ability to control the market (Geurs 2004; Zhang and Lu 2007; Liu et al. 2009; Zhang et al.
2009). Using accessibility index to evaluate the layout of
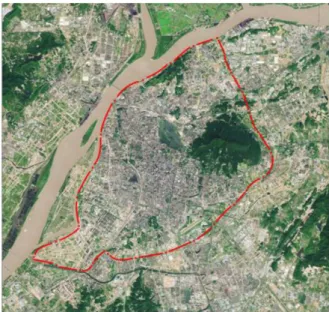
Fig. 1. Location map of city proper of Nanjing.
public facilities especially the urban green space system greatly expands the application scope of accessibility (Herzele and Wiedemann 2003; Jeong 2007; Comber et al.
2008; Hien and Jusuf 2008).
The accessibility of green space refers to how difficult one person overcomes the space resistance to reach the green space and it also reflects the size of the space block (Talen and Anselin 1998). The indexes of the accessibility include distance, time, cost, etc (Lu 2003; Zhang and Lu 2006). The accessibility of green space can measure the possibility or potential of green space to serve the resident and it profoundly affects the frequency of using green space or other public service facilities by urban poverty group, the elderly, children and the disabled (Yu et al. 1999).
There were a few researches on the accessibility of green space in the past and the main research method was to measure the linear distance (Zhang 2007) or set different resistance values according to different land uses (Li et al.
2008; Li and Liu 2009), which was greatly different from the resident’s actual traffic routes so that the results could not reflect the actual accessibility. Therefore, based on the road network and the population distribution in the re- search area, this paper applies GIS software to quantita- tively discuss the accessibility of park green space, in order to improve the accuracy of the research on accessibility of green space and provide a new way to study on the space structure of green space system.
The Overview of the Research Area
Nanjing is located in the lower reaches of the Yangtze River and its geographical coordinate ranges from 31o14"N to 32o37"N and from 118o22"E to 119o14"E. It is an im- portant city in the Yangtze River delta region. With a long history and developed social economy, Nanjing is one of the first Chinese national historical and cultural cities and is one of the key tourist cities of China. Nanjing governs 11 districts and 2 counties, covering an area of 6598 km2. The garden and green space in Nanjing has always been in the front row in China and it has won many titles including
“Excellent Tourism City in China”, “National Garden City” and “Special Honor of UN-HABITAT”. In 2007, the per capita area of park green space is 13.2 m2 and the rate of green space reaches 41.46%. Therefore, taking
Nanjing as the research case has certain representativeness and foresight.
In this paper, the research focuses on the city proper of Nanjing, including the whole area of Gulou, Xuanwu and Xiaguan Districts, most parts of Baixia, Jianye and Yuhuatai Districts and a part of Qixia District, covering an area of 243 km2 (Fig. 1).
Because the number of population and road conditions in city suburbs and rural areas are very different from the city, which can not calculate the accessibility of green space according to the same method. So the paper not take into account green space outside of the main urban areas as the research object.
Data Sources and Research Method
Main Data Sources
The data in this paper mainly include the 1:10000 scale map of land use in Nanjing (2013) and the population data in each district (2013). All these data come from the official website and the annals of each district.
Research Method
Evaluation Index of the Accessibility of Park Green Space
The evaluation index of the accessibility of the park
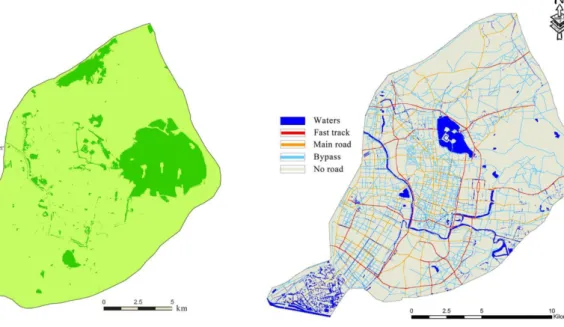
Fig. 2. Distribution map of park green space. Fig. 3. Distribution map of road network and waters.
green space from any point in the research area is:
Ai=min (MjTij)
i refers to any point in the area and Tij refers to the time Point i takes to reach the park green space j through the shortest route. Mj means the weight of park green space j and here the weight is set to 1 on the basis of transportation accessibility with no consideration of the attraction of park green space. Ai is the accessibility of Point i and it not only shows the time that any point in the area takes to reach the nearest park green space, but illustrates the convenience for the resident in this point to travel (Jin et al. 2010).
Method of Calculating the Accessibility of Park Green Space
Preparation of data source files: First, digitize the map of land use in Nanjing (2013) in Arc-Map and rectify it with the Georeferencing tool in ArcGIS. Then, compare the digitized map with the high- resolution remote sensing image in Google earth and make corrections based on field survey, in order to get an accurate electronic map of park green space in Nanjing. After that, the distribution of park green space in the research area is shown in Fig. 2.
Preparation of the travel cost files (Namely, files of road network and waters): This research adopts grid method and divides the research area into several grid units. The area of each unit is 900 m2 with the size of 30x30
m. Compared with the city proper of Nanjing, which covers 243 km2, 900 m2 is small enough and its internal difference is very small. Therefore, we can take each grid as a homoge- neous unit with same accessibility.
In this research, the criterion for measuring the accessi- bility is time distance. First, the space distance should be transformed into time distance through calculating the speed that is to use the difficulty for the resident to pass a unit to measure and its values is the seconds that moving 30 m takes. The transportations adopted by the resident are set as three kinds: walk, non-motor vehicles and motor vehicle.
Non-motor vehicles and motor vehicle go along the road while walk is not restricted by the road network. The roads in research area are divided into three levels: fast track, main road and bypass, which are given different speeds and travel costs. The files of road network and waters are shown in Fig. 3.
According to the Technical Standards for Highway Engi- neering of the People’s Republic of China (JTGB-2003), the average speed of walking is set as 5 km/h; the speed of non-motor vehicles (most are bicycles) in any road is 15 km/h; the speeds of motor vehicle are 60 km/h in fast track, 45 km/h in main road and 30 km/h in bypass; the speed of both non-motor vehicles and motor vehicle is 5 km/h when there is no road. When there is a river or lake in a grid, it
Table 1. Values of travel cost
Walking Non-motor vehicle Motor vehicle
Waters Road No road Fast track Main road Bypass No road
Average speed (km/h) 5 15 5 60 45 30 5 0
Values of travel cost (s/grid) 21.6 7.2 21.6 1.8 2.4 3.6 21.6 1000
Fig. 4. Distribution map of population density.
will be set as blocking grid and the cost values will be 1000.
But it will be calculated in accordance with the correspond- ing road level, when there a bridge or bypass in the area.
The travel costs of taking different transportations are shown in Table 1.
Calculate the population density with interpola- tion: Based on ARC/INFO software platform, the author takes the population in Nanjing Statistical Yearbook 2013 and the current administrative division as a benchmark and fully considers the factors like the boundary of city proper, the district with large area but sparse population such as Xuanwuhu District and Zijinshan District. Then the city proper is divided into 52 communities and the distribution map of population density is obtained (Fig. 4). At the same time, the author establishes the attribute database of pop- ulation density in Arc-Map and accomplishes the matching of space data and the attribute data of population.
Calculate the accessibility of park green space:
Use ARCGIS software to calculate the time it takes from each grid to the nearest park green space and then calculate the accessibility of park green space in the whole research area. Combine with the population distribution in each community, the author analyzes the population and its per- centages in the areas with different accessibilities.
Evaluation Index of the Convenience for Residents to Travel
To evaluate whether the space distribution of urban park green space can provide equal opportunity for citizens to use and whether the urban parks are reasonably and equally distributed, this paper introduces the evaluation index of the convenience for residents to travel.
The evaluation index of the convenience for the resident in each community to travel is:
nj is the number of the grid in the No. j community. Ai re- fers to the accessibility of the No. i grid in community and
Rj is the convenience for the resident in No. j community to travel. After using the average time of the accessibility in the community to reflect the accessibility of the whole com- munity, this index illustrates the convenience for commun- ity residents to use green space and visually shows the ac- cessibility of park green space in urban community.
Results and Analysis
Analysis of the Accessibility
Respectively calculate the shortest time it takes to move from each park green space to any point in the research area with the above three kinds of transportations and that is the accessibility of park green space from that point. To more visually present the size of area in each time period, the au- thor divides the accessibilities of park green space under different transportations every 5 minutes and obtains the distribution frequency and cumulative frequency of the
Fig. 6. Distribution map of the accessibility of park green space by non-mo- tor vehicles (Unit min).
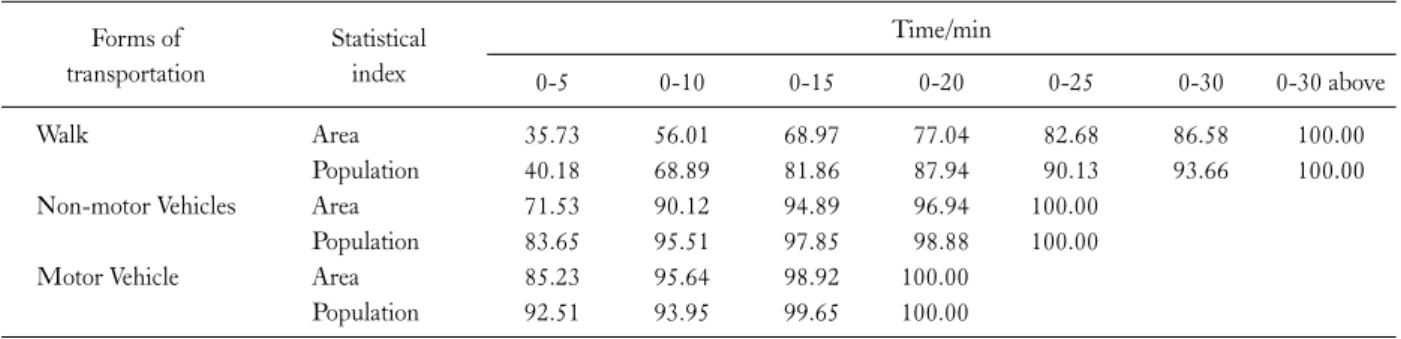
Table 2. Cumulative frequency of the time distribution of the accessibility of park green space (%) Forms of
transportation
Statistical index
Time/min
0-5 0-10 0-15 0-20 0-25 0-30 0-30 above
Walk Area 35.73 56.01 68.97 77.04 82.68 86.58 100.00
Population 40.18 68.89 81.86 87.94 90.13 93.66 100.00
Non-motor Vehicles Area 71.53 90.12 94.89 96.94 100.00
Population 83.65 95.51 97.85 98.88 100.00
Motor Vehicle Area 85.23 95.64 98.92 100.00
Population 92.51 93.95 99.65 100.00
Fig. 5. Distribution map of the accessibility of park green space by walk (Unit min).
Fig. 7. Distribution map of the accessibility of park green space by motor vehicle (Unit min).
space and population in each time period (Fig. 5-7, Table 2). It can be seen that:
In most areas, the accessibility is good and it takes 10-minute walk, 5-minute non-motor vehicles or 5-minute motor vehicle to reach the nearest park green space. Within 5-minute walk, the accessible area and population account for 35.73% and 40.18% respectively and they will accumu- late to 56.01% and 68.89% in 10 minutes. For non-motor vehicles, the accessible area and population account for 71.53% and 83.65% in 5 minutes, while the motor vehicle holds 85.23% and 92.51% respectively in 5 minutes.
In some areas, the accessibility is always poor no matter what kind of transportation is taken. These areas are mainly distributed at the edge of city proper and it takes about 30 minutes to arrive there by walk or non-motor vehicles and 20 minutes by motor vehicle.
Fig. 9. Distribution map of the convenience for the resident in each com- munity to travel by non-motor vehicles (Unit min).
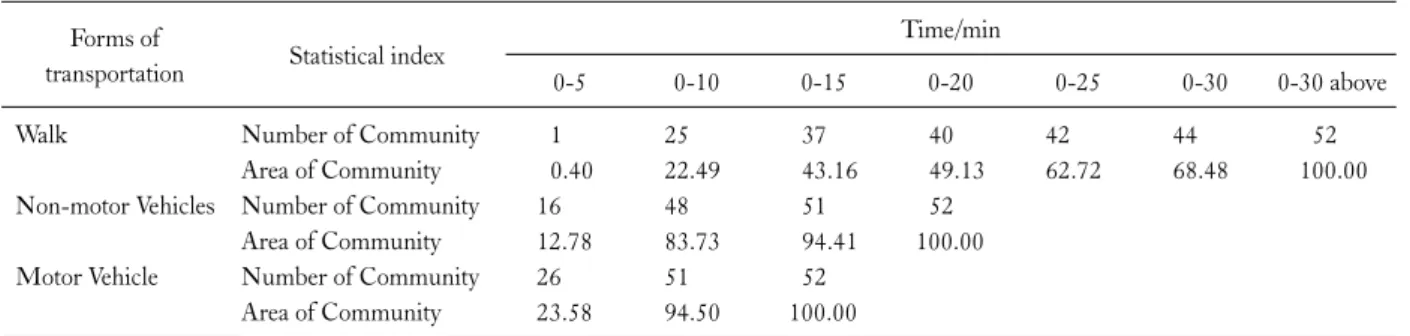
Table 3. Cumulative frequency of the time distribution of the convenience for residents to travel Forms of
transportation Statistical index Time/min
0-5 0-10 0-15 0-20 0-25 0-30 0-30 above
Walk Number of Community 1 25 37 40 42 44 52
Area of Community 0.40 22.49 43.16 49.13 62.72 68.48 100.00
Non-motor Vehicles Number of Community 16 48 51 52
Area of Community 12.78 83.73 94.41 100.00
Motor Vehicle Number of Community 26 51 52
Area of Community 23.58 94.50 100.00
Fig. 10. Distribution map of the convenience for the resident in each com- munity to travel by motor vehicles (Unit min).
Fig. 8. Distribution map of the convenience for the resident in each com- munity to travel by walk (Unit min).
Analysis of the Convenience for Residents to Travel To better reflect the different accessibilities in the re- search area and show the use of park green space by the res- ident in different communities, the author introduces the data of each community and uses formula (2) to calculate the accessibility. Then, the calculation results under differ- ent transportations are divided according to the time period and the convenience for the resident in community to travel is obtained, as shown in Fig. 8-10 and Table 3. It can be seen that:
In most areas, the convenience is good and it takes 15-minute walk, 10-minute non-motor vehicles or 5-mi- nute motor vehicle to reach the nearest park green space.
Residents in 37 communities take 15-minute walk to reach
the park green space and the cumulative accessible area ac- counts for 43.16%. Residents in 48 communities get to the park green space in 10 minutes by non-motor vehicles, and the cumulative accessible area covers 83.73%. Residents in 26 communities get to the park green space in 5 minutes by motor vehicle and the cumulative accessible area covers 23.58%.
The results show the layer structure with the center of city proper as the core. It means that the community which is close to central area is relatively more convenient than the community at the edge of city.
Analysis of the Influencing Factors
Both the accessibility of park green space and the con- venience for residents to use green space are affected by many factors, mainly including the following four aspects.
The Quality of Park Green Space Itself
The quality of park green space includes the quantity, area, space distribution and attraction of park green space.
More park green spaces, larger size, more balanced space distribution, more improved service facility and more at- tractive landscapes will make better accessibility. In the cen- tral area especially inside the inner ring road, there are more park green spaces with relatively balanced space distribu- tion and the accessibility is good no matter what kind of transportation is taken. At the edge of city, there is less park green space and the accessibility is poor. Therefore, the con- struction of urban green space has to take the equity and reasonability of space distribution into consideration except simply increasing the number of park green space.
The Maturity Level of Road Network
If the urban roads extend in all directions, it will be very convenient for residents to get to any public facility. Other- wise, it will waste time and energy. The road network in the research area is relatively complete and the fast track adopts a grid shape, which not only connects the areas inside the inner ring road, but also connects the inner ring road and the outside areas. The layout of main road is balanced, while the bypass is closely dotted. But there is big difference between the inside and outside areas of the inner ring road:
the main road outside the inner ring road is relatively
sparse, especially at the edge of city proper; in Xiaguan, Qixia and Yuhuatai Districts, the bypass is also sparse. That partly explains why the accessibility of the central area is good and why the accessibility is poor at the edge.
The Adopted Transportation
In this research, the reason why the resident takes differ- ent time to reach the same park green space from the same starting point and along the same route is that the speeds of different transportations are different. In fact, due to the different distance to park green space, different road net- works, different ages and incomes of the resident, people choose different transportations. The urban green space system planning must fully consider the design of the road network which surrounds the park green space and consid- er the transportations adopted by different groups, in order to realize the true accessibility of park green space.
The Distribution of Urban Residents
To a certain extent, the distribution of urban residents determines how frequently the park green space is used and the age and gender structure of population decide how many park green space the resident needs and its type. The connection between the resident and park green space affect the travel time, cost and the convenience of the start point and end point. The research results show that population is mostly distributed in the accessible area within 15-minute walk, which reflects the preference of living near the park green space. But it is based on the assumption that the pop- ulation is evenly distributed in the community, which may affect the accuracy of the accessibility results to some extent.
However, it does not interfere with the overall analysis of the accessibility.
Conclusions and Discussion
Conclusions
From the perspectives of the accessibility of green space, this paper has calculated the overall accessibility of park green space in the research area and the convenience for the resident in each community to travel by applying the GIS software. At the same time, it provides a new way for re- searching the space structure of urban green space system.
Through the analysis of the accessibility of park green space
in the research area, the following conclusions can be made that:
The accessibility of park green space in Nanjing is gen- erally good and in most areas the resident can take 10-mi- nute walk, 5-minute non-motor vehicles or motor vehicle to get to the nearest park green space. In most communities, the convenience is also good and the resident can take 15-minute walk, 10-minute non-motor vehicles or 5-mi- nute motor vehicle to get to the nearest park green space.
There are 4 factors influencing the accessibility of green space, mainly including the quality of park green space it- self, the maturity level of road network, the adopted trans- portation and the distribution of urban residents.
Discussion
1) The data of population distribution adopted by this research is calculated from the population dada of each community. But this paper assumes that the population is evenly distributed in the community and the difference of population data only exists between different communities without considering the difference of residential areas in- side the community. Therefore, it remains to be further studied that applying more elaborate data of population dis- tribution in residential area to analyze the accessibility of ur- ban green space.
2) This research discusses the space structure of urban green space only based on the accessibility theory. The as- sumed accessibility is a kind of accessibility without any block and without considering the number of traffic lights or traffic jam. In fact, the green space is an important part of urban ecosystem and its accessibility is affected by the ur- ban economic development, different regional economies, road condition in urban green space, its ecological service function and many other aspects, which should be further studied. Through investigation and analysis, make it as a supplement to the accessibility study.
3) The analysis of the accessibility in this research only takes the central point of the grid as the start point and does not consider it from the residential area. Meanwhile, other environmental factors such as safety, continuity, pleasur- ability, block size, block types, waiting time to cross the roads can also affect pedestrians’ environment. In the fu- ture, the accessibility of urban green space can be further analyzed by taking the access of the residential area as the
start point.
4) The calculation of the accessibility of green space based on the road network structure has already showed great potential, but the existing methods fail to consider the effect of the different parks’ attraction on the accessibility of the urban park, which is probably the biggest deficiency.
Therefore, putting the urban park’s attraction into the cal- culation process will greatly improve the application pros- pect of this method.
5) At present, the research of accessibility of green space mainly concentrated on single large and medium cities, the accessibility research should be carried on the horizontal comparison study of the same level cities, and to make the accessibility become comparability index to measure urban green space construction quality.
References
Amberger A. 2006. Recreation use of urban forests. An inter-area comparison. Urban For Uiban Green 4: 135-144.
Comber A, Brunsdon C, Green E. 2008. Using a GIS-based net- work analysis to determine urban green space accessibility for different ethnic and religious groups. Landsc Urban Plan 86:
103-114.
Geurs K, Wee B. 2004. Accessibility evaluation of land-use and transport strategies review and research directions. J Transp Geogr 12: 127-140.
Herzele AV, Wiedemann T. 2003. A monitoring tool for the provi- sion of accessible and attractive urban green spaces. Landsc Urban Plan 63: 109-126.
Hien WN, Jusuf SK. 2008. GIS-based greenery evaluation on campus master plan. Landsc Urban Plan 84: 166-182.
Jim CY, Chen WY. 2006. Perception and attitude of residents to- ward urban green spaces in Guangzhou (China). Environ Manage 38: 338-349.
Jin C, Lu Y, Fan L. 2010. Research on accessibility of scenic spots in the Yangtze River Delta based on land traffic network. J Nat Resour 25: 258-269.
Li B, Song Y, Yu K. 2008. Evaluation method for measurement of accessibility in urban public green space planning. Acta Scientia- rum Naturalium Universitatis Pekinensis 44: 618-624.
Li X, Liu C. 2009. Accesslbility and service of Shenyang’s urban park by network analysis. Acta Ecologica Sinica 29: 1554-1562.
Liu C, Yu R, Xiong J, Zeng J. 2009. Spatial accessibility of road network in Wuhan metropolitan area. Acta Geographica Sinica 64: 1488-1498.
Lu D. 2003. Theory and practice of regional development in China.
Beijing-Science Press.
Neuvonen M, SievänenT, Tännes S, Koskela T. 2007. Access to
green areas and the frequency of visits: A case study in Helsinki.
Urban For Uiban Green 6: 235-247.
Oguz D. 2000. User surveys of Ankara’s urban parks. Landsc Urban Plan 52: 165-171.
Oh K, Jeong S. 2007. Assessing the spatial distribution of urban parks using GIS. Landsc Urban Plan 82: 25-32.
Swanwick C, Dunnett N, Woolley H. 2003. Nature role and value of green space in towns and cities: an overview. Built Environ 29: 94-106.
Talen E, Anselin L. 1998. Assessing spatial equity: An evaluation of measures of accessibility to public playground. Environ Plan A 30: 595-613.
Tzeng GH, Tsaur SH, Laiw YD, Opricovic S. 2002. Multicriteria analysis of environmental quality in Taipei: public preferences and improvement strategies. J Environ Manage 65: 109-120.
Yu KJ, Duan TW, Li DH, Peng JF. 1999. Landscape accessibility as a measurement of the function of urban green system. City Plan Rev 23: 11-43.
Zhang L, Lu Y, Zhao Y. 2009. Delimitation of central cities attract- ing scope based on time accessibility: A case study of the Yangtze River Delta. Geogr Res 28: 803-816.
Zhang L, Lu Y. 2006. Assessment on regional accessibility based on land transportation network: A case study of the Yangtze River Delta. Acta Geographica Sinica 61: 1235-1246.
Zhang L, Lu Y. 2007. Regional accessibility of land traffic network in the Yangtze River Delta. J Geogr Sci 62: 351-364.
Zhang X. 2007. GIS-Based researches on service radius of urban public park: take Laohekou city as an example. Huazhong Agricultural University, Wuhan, China. (in Chinese)