www.kjpp.net 27 Korean J Physiol Pharmacol 2017;21(1):27-36 Author contributions: J.H.W. and T.W.H., performed cell-based assay and behavioral experiments. H.S.K. suplied experimental materials, and J.T.H.
coordinated this study.
This is an Open Access article distributed under the terms of the Creative Commons Attribution Non-Commercial License, which permits unrestricted non-commercial use, distribution, and reproduction in any medium, provided the original work is properly cited.
Copyright © Korean J Physiol Pharmacol, pISSN 1226-4512, eISSN 2093-3827
INTRODUCTION
The research to find alternative compounds for the treatment of insomnia has progressed in the past decades. Many kinds of herbs such as St, John’s wort, Kava Kava, Valerian and Passion flower have been introduced in European countries [1]. Herbs as sleep aids are becoming more popular as alternative medicines.
g-Aminobutyric acid (GABA)A-ergic transmission plays an important role in the mediation of sleep behaviors. GABA is synthesized from glutamate by glutamic acid decarboxylase (GAD) and higher levels of GABA contains in the inhibitory
neurons [2]. GABA is the main inhibitory neurotransmitter in the central nervous systems (CNS) of mammalians [3]. GABA binds the ionotropic and metabotropic GABA receptors on the pre- and post-synaptic nerves, resulting in hyperpolarization of neuronal cells in CNS [4-6]. Depending on the configuration of the structural subunits, it determines the pharmacological properties of the GABA receptors [7]. α1−Subunits in GABA
Areceptors mediate sedation, amnesia, and ataxic effects of benzodiazepine (BZ), whereas α2−and α3-subunits are involved in their anxiolytic-like and muscle-relaxing actions. α5−Subunits are involved in at least some of the memory impairment caused
Original Article
Potentiation of decursinol angelate on pentobarbital-induced sleeping behaviors via the activation of gABA A -ergic systems in rodents
Jae Hoon Woo
1, Tae-Woo Ha
1, Jae-Seon Kang
2, Jin Tae Hong
1, and Ki-Wan Oh
1,*
1
College of Pharmacy and Medical Research Center, Chungbuk National University, Cheongju 28644,
2College of Pharmacy, Kyungsung University, Busan, 48434, Korea
ARTICLE INFO Received June 16, 2016 Revised July 29, 2016 Accepted August 18, 2016
*Correspondence Ki-Wan Oh
E-mail: [email protected] Key Words
Decursinol angelate Electroencephalogram Insomnia
Pentobarbital-induced sleeping g-Aminobutyric acid (GABA)
Areceptors
ABSTRACT Angelicae Gigantis Radix (AGR, Angelica gigas) has been used for a long time as a traditional folk medicine in Korea and oriental countries. Decursinol angelate (DCA) is structurally isomeric decursin, one of the major components of AGR. This study was performed to confirm whether DCA augments pentobarbital- induced sleeping behaviors via the activation of GABA
A-ergic systems in animals.
Oral administration of DCA (10, 25 and 50 mg/kg) markedly suppressed spontaneous locomotor activity. DCA also prolonged sleeping time, and decreased the sleep latency by pentobarbital (42 mg/kg), in a dose-dependent manner, similar to muscimol, both at the hypnotic (42 mg/kg) and sub-hypnotic (28 mg/kg) dosages.
Especially, DCA increased the number of sleeping animals in the sub-hypnotic
dosage. DCA (50 mg/kg, p.o.) itself modulated sleep architectures; DCA reduced
the counts of sleep/wake cycles. At the same time, DCA increased total sleep time,
but not non-rapid eye movement (NREM) and rapid eye movement (REM) sleep. In
the molecular experiments. DCA (0.001, 0.01 and 0.1 μg/ml) increased intracellular
Cl- influx level in hypothalamic primary cultured neuronal cells of rats. In addition,
DCA increased the protein expression of glutamic acid decarboxylase (GAD
65/67)
and GABA
Areceptors subtypes. Taken together, these results suggest that DCA
potentiates pentobarbital-induced sleeping behaviors through the activation of
GABA
A-ergic systems, and can be useful in the treatment of insomnia.
https://doi.org/10.4196/kjpp.2017.21.1.27 Korean J Physiol Pharmacol 2017;21(1):27-36
by BZ [8].
The dried root of Korean Angelicae Gigantis Radix (AGR, Angelica gigas), known by the Korean name as ‘Cham-dang-gui’
has been used as a medicinal herb in Korea [9]. This herb been used traditionally for the treatment of psychosomatic diseases such as excess stress, anxiety, depression, pain and insomnia [10- 14]. So far, recent studies have been shown that the essential oil components of AGR exhibited anxiolytic-like effects in rodents tests [15]. It was reported that Japanese Angelica root extract reversed stress-induced sleep-reduction in pentobarbital sleeping animals through the inhibition of the central noradrenergic or the activation of GABA
Areceptors in mice [16]. Decursinol angelate (DCA, one of coumarin derivatives from AGR, Fig. 1) has been shown similar pharmacological activities of the extract of AGR such as and anti-amyloid β protein aggregation, anti- amnesic activity, anti-nociceptive activity and protective activity of neurotoxicity [17-20]. Therefore, we investigated whether DCA augments pentobarbital-induced sleeping behaviors via the activation of GABA
A-ergic systems, and the sleep architectures of electroencephalogram (EEG) induced by DCA were analyzed.
These experiments have been more focused on whether DCA could be a candidate of insomnia treatment.
mEThODS
Materials
DCA was gifted from the professor Jae-Seon Kang who works at the College of Pharmacy, Kyungsung University of Pharmacy.
Diazepam and pentobarbital sodium were purchased from Hanlim Pharm. Co., Ltd. (Seoul, Korea) and Samjin Pharm.
(Seoul, Korea), respectively. Fetal bovine serum (FBS), Dulbecco's Modified Eagle Medium (DMEM), Neurobasal A Medium, Penicillin–Streptomycin and Trypsin–EDTA were obtained from GIBCO (GrandIsland, NY, USA). The Cl- sensitive fluorescence probe N- (ethoxycarbonylmethyl) - 6- methoxyquinolinium bromide (MQAE) and cytosine β-D-arabinofuranoside were obtained from Sigma-Aldrich Co. (St. Louis, MO, USA).
Muscimol (Tocris Bioscience, Bristol, UK) and Dimethyl
sulfoxide (Amresco Solon, Ohio, USA) were purchased, res- pectively. The specific rabbit polyclonal antibodies against GABA
Areceptors subunits or GAD
65/67and the corresponding conjugated anti-rabbit immunoglobulin G-horseradish peroxidase were purchased from Abcam Inc. (Cambridge, UK).
Chemiluminescent HRP substrate was obtained from Millipore Co. (Billerica, MA, USA).
Animals
All animals (ICR mice weighing 20~24 g and Sprague-Dawley rats weighing 220~250 g) were purchased from Samtako (Osan, Korea). All animals were housed in acrylic cages (45×60×23 cm) and were kept at least 1 week for acclimation time. The room temperature was maintained at 22±2
oC and at the relative humidity (50~52%) with a 12 h light/dark cycle (lights on at 7:00) in the animal room. Food and water were available ad libitum.
All the behavioral experiments were performed between 10:00 and 17:00. Experiments were carried out in accordance with the Principle of Laboratory Animal Care (NIH publication No. 85- 23, revised 1985) and the Animal Care and Use Guidelines of Chungbuk National University, Korea.
Locomotor activity
Spontaneous locomotor activity was measured automatically with a tilting-type ambulometer (AMB-10, O’Hara, Tokyo, Japan). Each mouse was placed in the activity cage (20 cm in diameter and 18 cm in height) and after an adaptation period of 10 min. DCA (10, 25 and 50 mg/kg). Diazepam (2.0 mg/kg) were dissolved in 0.9% physiological saline. DCA (10, 25 and 50 mg/
kg) and diazepam (2.0 mg/kg) were orally administered before 60 min and 30 min of the locomotor measurement, respectively. The ambulatory of activity was measured automatically for 1 h after the administration of the agents [21].
Pentobarbital-induced sleeping behaviors
Animals were fasted for a day. Pentobarbital sodium (Hanlim Pharm. Co., Ltd., Korea) was diluted in 0.9% physiological saline, and administered to each mouse intraperitoneally to induce sleep. Muscimol and DCA were suspended in 0.01% DMSO. All experiments were carried out between 13:00 and 17:00. DCA (10, 25 and 50 mg/kg) and muscimol (0.2 mg/kg) were orally administered before 1 h and 30 min of pentobarbital (42 mg/kg, i.p.) administration, respectively, to the mice. The animals that stopped the movement after pentobarbital injection was moved carefully to another cage. The sleep latency was recorded as elapse time between pentobarbital injection and loss of the reflex. The sleep was recorded as elapse time between the loss and recovery righting movement. The mice which failed to induce sleep within 15 min after administration of pentobarbital were except from
Fig. 1. Chemical structure of the decursinol angelate.
Korean J Physiol Pharmacol 2017;21(1):27-36 www.kjpp.net
the experiments [22,23]. The awakening behaviors characterized by righting of the animal, were observed constantly.
Implantation of the EEG telemetric transmitter
Pentobarbital (50 mg/kg) was i.p. injected to the rats of the surgical anesthesia. The animals were then placed on a pad, and then secured in the stereotaxic apparatus under aseptic conditions. An incision was made in the part of the abdomen's midline, caudal to the cartilage. One hole for positioning the electrodes was drilled in the skull surface (A: 2.0 [Bregma], L:
1.5; P: 7.0 [Bregma], L: 1.5 contra-lateral) [24]. The periosteum was removed by sterile cotton. Lines from the transmitter were connected subcutaneously to the hole that made in the skull.
The electrodes lines were anchored to the skull with screws and dental cement. The transmitter (Data Sciences International TA11CTA-F40, MN, USA) was placed in the skin. It was attached to the skin with 3 sutures for stabilization. It was fixed by a silk 4–0 suture. The antibiotic (i.p.) (5 million unit potassium penicillin-G Injection, Kunwha, KOREA) was given to the rats for a better recovery.
Date collection
Following 7 days post-surgical recovery, rats were divided into control and DCA, with 8 rats in each group. DCA (50 mg/kg) was suspended, dissolved in 0.01% DMSO, and administered orally 1 hour prior to the measurement. Telemetric recording of cortical EEG activity were designed with a slight modification as previous reports [25]. The setting of EEG signal was amplified and arranged of 0.5~20.0 Hz in the transmitters. It was additionally set up –0.5/+0.5 volts per/units ×2, and was controlled by a Data Sciences International analog converter. The signals were passed over to an AD converter (Eagle PC30, USA) and then saved by a computer. The signals digitize the collected data to the rate of 128 Hz by an AD converter. The recordings marked graphically can be expressed by the computer. An on-line fast Fourier transformation (FFT) was performed on the EEG data at 2 sec intervals during data acquisition (256 samples) after a Hanning window treatment. The FFT analysis generated power density values from 0.0 to 20.0 Hz. The FFT data were further averaged in the range of 0 to 20 Hz for every 10 sec. The sleep data and FFT results were saved to the hard disk every 10 sec for additional off- line analysis. Movement of the animal in relation to the telemetry receiver generated transistor-transistor logic (TTL) pulses that were collected and counted as a measure of activity. Data were recorded between 11:00 and 15:00. The activity of the each rat was recorded simultaneously.
Data analysis
The amount of time in wakefulness, NREM sleep and REM
sleep were determined from the digitized data at 10 sec intervals using professional animal sleep analysis software SleepSign2.1 (KISSEI Comtec Co Ltd, Matsumoto, Japan). The amount of time in wakefulness, non-rapid eye movement (NREM) sleep, and rapid eye movement (REM) sleep were classified every 10 sec period [26]. EEG signals according to the followings were classified by the software: Wakefulness was identified by a high-frequency, and recoding of NREM was focused on the presence of spindles interspersed with slow waves. EEG power during REM sleep is significantly reduced in lower frequency δ-wave (0.75~4.0 Hz), and is increased in the range of theta- wave activity (5.0~9.0 Hz, peak at 7.5 Hz) for 6 hours period.
We further calculated the time of each recording spent in each sleep–wake states (wakefulness, NREM sleep and REM sleep).
The absolute EEG power was calculated during wakefulness, NREM, and REM in 0.5 Hz bins from 0.5 to 20 Hz for the entire 6 h reading. EEG power density in 3 selected frequency bands for wakefulness, NREM sleep and REM sleep δ-wave (0.75~4.0 Hz), θ-wave (4.0~8.0 Hz) and α-wave (8.0~13.0 Hz) were subsequently evaluated.
Measurement of intracellular chloride influx
Primary cultures of hypothalamus cells were prepared from 8 days old SD rats [27,28]. Hypothalamus cells were plated (1.0×10
5cells per well) in 96-well microplates dishes coated with poly- L-lysine (50 mg/mL; Sigma, St. Louis, MO, USA). and were cultured DMEM and neurobasal A media 10% heat-inactivated fetal bovine serum, gentamicin (100 mg/mL), glutamine (2.0 mM), antibiotic-antimycotic solution (10 mg/mL; Sigma), and potassium chloride (25 mM). After seeding the cells, incubated for 6~9 days in a humidified 5% CO
2/95% air atmosphere at 37
oC. Cytosine arabinofuranoside (final concentration, 10 mM;
Sigma, USA) was added after 18~24 h of culture to inhibit the
replication of non-neuronal cells. The intracellular chloride ion
([Cl
–]
i) of hypothalamic neuronal cells of rats was estimated using
Cl
–sensitive fluorescence probe N-(ethoxy- carbonylmethyl)-
6-methyoxyquionolinium bromide (MQAE) according to the
method of West and Molloy, with a slight modification [29]. After
overnight incubated, the primary cultured cells were washed three
times in the buffer (pH 7.4) which contained 2.4 mM HPO
42–,
0.6 mM H
2PO
4–, 10 mM HEPES, 10 mM D-glucose and 1 mM
MgSO
4. Fluorescence was monitored using excitation wavelength
320 nm and emission wavelength 460 nm, respectively, in a
microplate reader (Spectra Max M2e Multi-Mode, PA, USA) as
described by Wagner [30]. The data is presented as the relative
fluorescence F
0/F, where F
0is the fluorescence without Cl
–ions
and F is the fluorescence as a function of each sample. The F
0/F
values were directly proportional to [Cl
–]
i.
Western blotting of GAD and GABA A receptors subunits
The groups were administered orally to DCA (10, 25 and 50 mg/kg) and diazepam (0.2 mg/kg) before 1 h and 30 min respectively injected to all mice (0.1 ml/10 g). The mice were decapitated and separated hypothalamus from brain on ice.
Mouse hypothalamic tissue was homogenized with 4
oC lysis buffer. The extracts were centrifuged at 13,000 × g for 20 min at 4
oC. Then, supernatant was recovered, the samples were stored at –20
oC. Equal amounts of protein were loaded and electrophoresed on 10% SDS–polyacrylamide gel. Proteins were then transferred to PVDF membranes (Hybond-P, GE Healthcare, Amersham, UK) using a semidry transfer system. The blots were blocked for 1 h at room temperature with 5% (w/v) BSA [applied to all primary antibodies except for glyceraldehyde 3-phosphate dehydro genase (GAPDH)] in tris-buffered saline solution (TBS) containing 0.1%
Tween-20. Both specific rabbit polyclonal antibodies against GABA
Areceptors subunits and rabbit anti-GAD
65/67polyclonal antibody at the appropriate dilution in TBST and 5.0% BSA (1:2,500 for all the primary antibodies used) were incubated for overnight at 4
oC. Blots were washed and incubated with the horseradish peroxidase-conjugated (HRP) secondary antibody (1:3,000 for goat anti-rabbit IgG) in TBST for 4 h at room temperature. The chemiluminescent substrate for the secondary antibody was developed using the ECL detection system (Roche Diagnostics, Mannheim, Germany) [31].
Statistical analysis
All statistical analyses were calculated by Sigma Stat software (SPSS Inc., Chicago, IL, USA). The results were expressed as mean
±S.E.M for the number of experiments. The significance of the effects of the compounds was assessed using analysis of variance (ANOVA). Statistical significances were compared between treated group and control group by Holm-Sidak method. For the sub-hypnotic pentobarbital dosage experiment, Chi-square test was used to compare the control. Each experiment was repeated at least three times and yielded comparable results. Values with p<0.05 were considered significant.
RESULTS
Decreased effects of DCA on locomotor activity in mice
DCA (10, 25 and 50 mg/kg) was administered to the mice.
Locomotor activity was decreased, in a dose-dependent manner, by DCA. Locomotor activities were decreased by approximately 61.8% at 50 mg/kg, 44.3% at 25 mg/kg, and 30.0% at 10 mg/kg, respectively. The locomotor activity by diazepam (2.0 mg/kg)
as a positive control was also decreased by approximately 27.2%, compared with that of the control (Fig. 2 ).
Effects of DCA on the onset and duration of sleep in pentobarbital treated mice
DCA (25 and 50 mg/kg) significantly decreased the sleep latency of sleep and increased dose-dependently total sleep time in pentobarbital induced sleeping mice. Muscimol (0.2 mg/kg, p.o.) as a positive control also augmented the increase of the sleeping time and the decrease of the sleep latency in pentobarbital (42 mg/kg)-induced sleeping mice. The time of sleep onset to oral administration with DCA at 10, 25 and 50 mg/
kg were decreased by approximately 97.4%, 86.1% and 77.9%, respectively. Muscimol also decreased by approximately 77.3%, compared with that of the control (Fig. 3A). The time of sleep duration by oral administration with DCA at 10, 25 and 50 mg/
kg were increased by approximately 113.0%, 121.1% and 129.8%, respectively. Muscimol showed similar effects and increased sleeping time by approximately 137.3%, compared with that of the control (Fig. 3 B).
Decreased effects of DCA on sleep onset of mice treated by sub-hypnotic dosage of pentobarbital
Oral administration of DCA increased the rate of sleep onset and the duration of sleep time induced by sub-hypnotic dosage of pentobarbital (28 mg/kg. i.p.). Muscimol also increased the rate of sleep onset and prolonged the sleep time significantly (Table 1 ). It was found that DCA at all dose treated to the mice
Fig. 2.
CONT 2 10 25 50
L oc om ot or a ct iv ity (Co un ts )
0 50 100 150 200
(mg/kg)
DZ DCA
**
***
***
***
Fig. 2. Decreased effects of decursinol angelate (DA) and diazepam
(DZ) on locomotor activity test in mice. Ambulation activity was
measured for 1 h, 30 min after oral administration of diazepam and 1 h
after the administration of DCA. Each column represents the mean with
S.E.M (n=10). The statistical significance was assessed using analysis of
variance (ANOVA) followed by Holm-sidak test. **p<0.01, ***p<0.001
compared with that of the control.
Korean J Physiol Pharmacol 2017;21(1):27-36 www.kjpp.net
showed significant increase in sleeping behaviors induced by pentobarbital. The time of sleep duration to sub-hypnotics dosage with DCA at 25 and 50 mg/kg were increased by approximately 152.3% and 195.0%, respectively. Muscimol increased sleep duration by approximately 157.5%, compared with that of the control (Table 1).
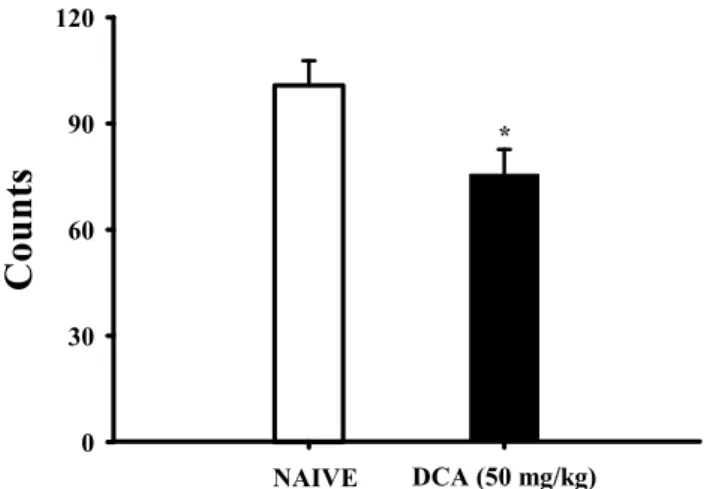
Decreased effects of DCA (50 mg/kg) on the counts of sleep-wake cycles
Sleep-wake cycles were observed in rats during 6 h after administration of DCA (50 mg/kg, p.o.), DCA decreased the
count of sleep-wake cycles approximately 75.6%, compared with that of the control (Fig. 4).
The sleep architectures by DCA
The oral administration of DCA (50 mg/kg) significantly decreased wakefulness, and increased total sleep during 6 hours in EEG recording. DCA decreased wakeful time by approximately 68.5%, and increased total sleep time by approximately 108.2%, compared with that of the control (Fig. 5). However, REM and NREM sleep was not increased.
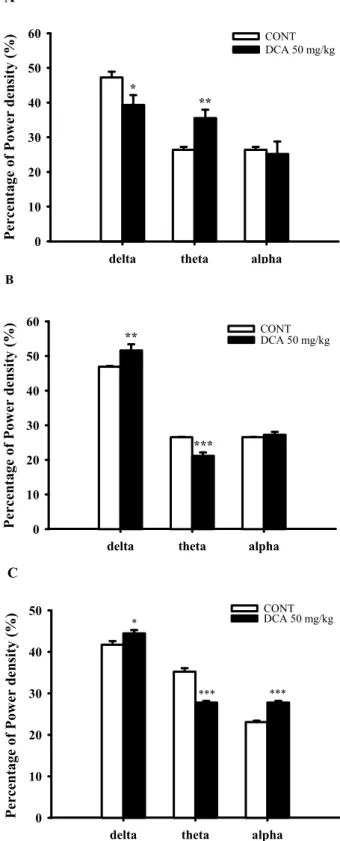
Effects of DCA on EEG power density
DCA (50 mg/kg) decreased δ-wave and increased θ-wave by approximately 83.2% and 134.6%, respectively, in wakefulness.
DCA increased δ-waves in REM and NREM sleep by appro- ximately 109.9% and 106.5%. In addition, DCA decreased Fig. 3.
(A)
Sleep laten cy time (min )
CONT 0.2 10 25 50
0 1 2 3 4
MUSC DCA
Pentobarbital 42 (mg/kg)
(mg/kg)
***
***
***
CONT 0.2 10 25 50
0 25 50 75 100
Total sl eeping time (min)
(mg/kg)
***
*
** ***
(B)
MUSC DCA
Pentobarbital 42 (mg/kg)
Fig. 3. Decreased effects of DCA on onset and duration of sleep in pentobarbital-treated mice. Mice were food deprived for 24 h prior to the experiment. Pentobarbital (42 mg/kg, i.p.) was injected to mice following administration of muscimol (MUSC) or DCA. The sleep latency time (A) and total sleeping time (B) were recorded. Each column represents the mean with S.E.M (n=12~14). The significance of the effects of the compounds was assessed using analysis of variance (ANOVA). Where there was significant variability, the individual values were compared using Holm-sidak test. *p<0.05, **p<0.01, ***p<0.001, compared with that of the control.
Fig. 4.
CONT DCA (50 mg/kg)
Counts
0 30 60 90 120
*
NAIVE
Fig. 4. Decreased effects of DCA (50 mg/kg) on the counts of sleep- wake cycles. Where there was significant variability, the individual values were calculated as mean with S.E.M (n=8) were compared using Holm-sidak test. *p<0.05, compared with that of the naïve control.
Table 1. Decreased effects of DCA on the sleep onset of mice treated by sub-hypnotic dose of pentobarbital (28 mg/kg, i.p.)
Group Dose
(mg/kg) No. falling
asleep /total Sleep time (min)
Control 0 6/12 18.3±2.7
Muscimol 0.2 12/12*** 28.8±1.4***
DCA 10 6/12 23.2±0.9*
25 9/12 27.8±2.2**
50 11/11* 35.6±2.4***
After administration of muscimol and decursinol angelate (DCA), pentobarbital (28 mg/kg) was given i.p. to mouse. Each value represents the mean S.E.M of 11~12 observations. *p<0.05, **p<
0.01, ***p<0.005, compared with that of the control (Chi-square
test and ANOVA followed by Holm-sidak test).
32 Woo JH et al
θ -waves in REM and NREM sleep, by approximately 79.7% and 78.9%, respectively, compared with that of the control (Fig. 6). It is suggested that slow waves such as δ-waves were increased during sleep.
Increased effects of DCA on chloride influx in primary cultured hypothalamic neuronal cells
Intracellular chloride ion influx in primary cultured hy- pothalamic neuronal cells was measured. The data is represented as the relative fluorescence F
0/F, where F
0is the fluorescence without chloride ions and F is the fluorescence as a function of each sample. The F
0/F values were directly proportional to intracellular chloride ion concentration. DCA (0.01 and 0.1 μ g/ml) significantly increased chloride ion influx in primary cultured cerebellar granule cells by approximately 115.3%, compared with that of the control (Fig. 7). Pentobarbital (10 μM) also increased the influx of Cl
–(Fig. 7).
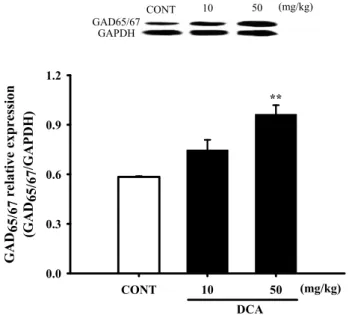
Increased effects of DCA on GAD 65/67 expression
Mice were sacrificed to examine the effect of these drugs on the abundance of GAD
65/67in the hypothalamic tissue. DCA (50 mg/kg) overexpressed GAD
65/67in the plasma membrane of hypothalamic tissue by approximately 164.8%, compared with that of the controls tissue (Fig. 8 ).
Increased effects of DCA on GABA A receptors subunits expression
The DCA increased the expression of GABA
Asubunit (α4, α5, Fig. 5.
WAKE TOTAL NREM REM
Time (hour )
0 1 2 3 4 5 6
*
*
CONT DCA 50 mg/kg
Fig. 5. Effects of DCA on sleep architectures in rats. The data represent the mean with S.E.M (n=8) of time spent, which separated the wakefulness/sleep (NREM and REM sleep) state. The significance of the effects of the compounds was assessed using analysis of variance (ANOVA). Where there was significant variability, the individual values were compared using Holm-sidak test. *p<0.05, Compared with that of the naïve control.
Fig. 6.
A
delta theta alpha
Perc en ta ge of Power d en sit y ( % )
0 10 20 30 40 50 60
* **
CONT DCA 50 mg/kg
delta theta alpha 0
10 20 30 40 50 60
Pe rc en tage of Pow er de nsit y (%)
CONT DCA 50 mg/kg B
**
***
C
delta theta alpha
Pe rc ent age of Pow er d en sity (% )
0 10 20 30 40
50 * CONT DCA 50 mg/kg
*** ***
Fig. 6. Effects of DCA on EEg power density of wakefulness (A), REm sleep (B) and NREm sleep (C). The power density was departmentalized into δ-wave, θ-wave, and α-wave. Each wave represents the mean with S.E.M (n=8). The significance of the effects of the compounds was assessed using analysis of variance (ANOVA).
Where there was significant variability, the individual values were
compared using Holm-sidak test. *p<0.05, **p<0.01, ***p<0.001,
compared with that of the naïve control.
Decurcinol and sleep
Korean J Physiol Pharmacol 2017;21(1):27-36 www.kjpp.net
33
β1, β2 and g3) in hypothalamic sample treated with 50 mg/kg were approximately 111.1%, 120.9%, 129.6%, 123.7% and 110.6%
respectively. The protein overexpressions (α1, α4, β1, β2, g3) by PENT as a positive control were also increased by approximately 124.8%, 135.6%, 112.9%, 109.9% and 145.1% respectively, compared with that of the control. DCA did not influence the amounts of α1 and α3 subunit in the GABA
Areceptor (Fig. 9).
Pentobarbital showed increased all protein levels except α3 and α5 subunits.
DISCUSSION
DCA is one of major components of AGR, have been re- ported as anti-amnesic [32], analgesic, anti-cancer, anti-bac- terial, neuroprotective and protein kinase C (PKC) activating activities from in vivo and in vitro experiment [33-37]. From these experiments, oral administration of DCA suppressed spontaneous locomotor activity. We considered that DCA would be inhibitory in the CNS. DCA also prolonged sleeping time, and decreased the sleep latency by pentobarbital (42 mg/kg), in a dose- Fig. 7.
Cl - I nf lu x ( F/ F 0)
CONT 10 0.001 0.01 0.1 0.0
0.5 1.0 1.5 2.0
PENT (㎛ ) DCA (㎍/㎖)
**
***
Fig. 7. Decreased effects of DCA on Cl
–influx in primary cultured hypothalamic neuronal cells. The cells were incubated with MQAE overnight, after the culture of hypothalamic neuronal cells for 8 days, and then DCA (0.001, 0.01 and 0.1 μg/ml) and pentobarbital (PENT 10 μm) were added 1 h prior to measurement. Each column represents the mean with S.E.M (n=3). The significance of the effects of the compounds was assessed using analysis of variance (ANOVA). Where there was significant variability, the individual values were compared using Holm-sidak test. **p<0.01, ***p<0.005, compared with that of the naïve control.
Fig. 8.
(mg/kg) DCA
CONT 10 50
GAD 65/ 67 re la tive e xpre ssion (GAD 65/ 67 /G A PD H ) 0.0 0.3 0.6 0.9 1.2
**
GAD65/67 GAPDH
CONT 10 50 (mg/kg)
Fig. 8. Increased effects of DCA on the expression of gAD.
Immunoblots of lysed hypothalamus tissues which were treated for 1 h following DCA are shown. GAPDH levels were need for the normalization of the protein expression. Each column represents the mean with S.E.M (n=3). The significance of the effects of the compounds was assessed using analysis of variance (ANOVA). Where there was significant variability, the individual values were compared using Holm-sidak t-test. **p<0.01, compared with that of the control.
CONT means the control group and GAD means glutamic acid decarboxylase.
Fig. 9.
CONT DZ DCA
1 GAPDH
3
4 GAPDH GAPDH
CONT DZ DCA
1
3 GAPDH GAPDH GAPDH GAPDH
R el at iv e e xp re ss io n (Subunit/ G AP DH)
α 1 α 3 α 4 α 5 β 1 β 2 γ 3 0.0
0.4 0.8 1.2
1.6
****** **
* *
* *
*
** ***