Relationship between maturation indices and morphology of the midpalatal suture obtained using cone-beam computed tomography images
Objective: The purpose of this study was to determine whether predicting maturation of the midpalatal suture is possible by classifying its morphology on cone-beam computed tomography (CBCT) images and to investigate relationships with other developmental age indices. Methods: The morphology of the midpalatal suture was assessed by using CBCT images of 99 patients.
Axial plane images of the midpalatal suture were classified into five stages according to the classification scheme. To make the assessment more accurate, the morphology and fusion of the midpalatal suture were additionally investigated on coronal cross-sectional planar images and volume-rendered images. Bone age was evaluated using the hand and wrist method (HWM) and cervical vertebrae method (CVM); dental age (Hellman’s index), sex, and chronological age were also assessed. To evaluate relationships among variables, Spearman’s rho rank test was performed along with crosstabs using contingency coefficients. Results: The HWM and CVM showed strong correlations with the maturation stage of the midpalatal suture, while other indices showed relatively weak correlations (p < 0.01). Through crosstabs, the HWM and CVM showed high association values with CBCT stage; the HWM demonstrated slightly higher values (p < 0.0001). Based on the HWM, the midpalatal suture was not fused until stage 6 in both sexes. Conclusions: Among developmental age indices, the HWM and CVM showed strong correlations and high associations, suggesting that they can be useful in assessing maturation of the midpalatal suture.
[Korean J Orthod 2016;46(6):345-355]
Key words: Midpalatal suture, Cervical vertebrae, Hand-wrist, Cone-beam computed tomography
Hong-Ik Jang
aSang-Cheol Kim
a,bJong-Moon Chae
a,cKyung-Hwa Kang
a,bJin-Woo Cho
cNa-Young Chang
a,bKeun-Young Lee
a,bJin-Hyoung Cho
a,ba
Department of Orthodontics, School of Dentistry, Wonkwang University, Iksan, Korea
b
Wonkwang Dental Research Institute, School of Dentistry, Wonkwang University, Iksan, Korea
c
Department of Orthodontics, Wonkwang University Daejeon Dental Hospital, Daejeon, Korea
Received March 14, 2016; Revised May 10, 2016; Accepted May 30, 2016.
Corresponding author: Jin-Hyoung Cho.
Professor and Director, Wonkwang University Sanbon Dental Hospital, 321 Sanbon-ro, Gunpo 15865, Korea.
Tel +82-31-390-2875 e-mail [email protected]
*This paper was supported by Wonkwang University in 2014.
© 2016 The Korean Association of Orthodontists.
The authors report no commercial, proprietary, or financial interest in the products or companies described in this article.
This is an Open Access article distributed under the terms of the Creative Commons Attribution Non-Commercial License (http://creativecommons.org/licenses/by-nc/4.0) which permits unrestricted non-commercial use, distribution, and reproduction in any medium, provided the original work is properly cited.
pISSN 2234-7518 • eISSN 2005-372X
https://doi.org/10.4041/kjod.2016.46.6.345
INTRODUCTION
Anteroposterior as well as transverse skeletal problems may co-exist in malocclusion patients. Maxillary con- striction can cause posterior crossbite, dental crowding, and abnormal muscular function. In the orthodontic field, maxillary expansion is performed to correct maxillary transverse constriction and the tooth axes of the posterior teeth, alleviate dental crowding, and establish a favorable maxillomandibular relationship.
1However, according to Melsen,
2responses to orthopedic maxillary expansion differ depending on the age and maturation of the patient. The interlock of the midpalatal suture increases as it matures, making skeletal expansion even more difficult. As a result, expansion of a matured maxilla leads to a tipping movement of the teeth, which increases the risk of relapse because the extent of dental expansion is greater than that of orthopedic expansion.
It is possible to expand the maxilla using a removable or fixed appliance in young patients because the structure of the suture is simple. However, with increased complexity of the suture, as occurs in adults, different treatment methods ―such as surgically assisted rapid palatal expansion (SARPE) ―should be used.
1However, SARPE can cause postoperative side effects, discomfort, and psychological and economic burdens on patients.
3Recently, a new method that can load orthopedic pressure directly to the bone (i.e., miniscrew-assisted rapid palatal expansion, MARPE) has been introduced in clinical practice. MARPE also can be considered at a certain level of maturation.
4,5Generally, various indices of maturation have been used to make decisions about treatment timing and method in orthodontics. An evaluation of skeletal age is one of the most important pieces of information in the diagnosis of growing children. The hand and wrist method (HWM)
6,7and cervical vertebrae method (CVM)
8are the most commonly used maturation indices.
Hellman’s index also is a popular method for assessing dental age.
9It is now possible to observe images of the midpalatal suture by using cone-beam computed tomography (CBCT); this is impossible with conventional radiography.
Angelieri et al.
10suggested that maturation of the midpalatal suture can be classified into five stages (stages A–E) by observing CBCT images. Through assessment of the midpalatal suture, they found it possible to minimize the failure of rapid maxillary expansion in adolescent and young adult patients. However, it is impossible to obtain routine CBCT radiography of every patient, and especially those without any diagnostic need (e.g., impacted tooth, cyst, and skeletal asymmetry).
In addition, there are ethical concerns regarding
unnecessary CBCT because of radiation exposure.
The aim of this study was to classify the maturation degree based on the morphology of the midpalatal suture by using CBCT images and to investigate relationships with conventional developmental age indices (indices of maturation). In doing so, we sought to determine whether using conventional developmental age indices can predict the morphology of the midpalatal suture and be used for maxillary expansion treatment planning.
MATERIALS AND METHODS
Patient selection and radiography
Before the study commenced, we estimated the sample size needed to reach statistical significance. A power analysis with G*Power 3.1.9.2 (Universitåt Düsseldorf, Germany) showed that 93 subjects would be needed for a statistical power of more than 85% to detect significant differences with a 0.5 effect size and a significance level of α = 0.05 (actual power = 0.851;
critical chi-square = 31.41; noncentrality parameter λ = 23.25). Institutional review board approval was granted by the Wonkwang University Daejeon Dental Hospital (Daejeon, Korea) to conduct this study (IRB No.
W1404/004-001).
From August 2009 to February 2014, patients between the ages of 7 and 20 years who visited the Department of Orthodontics, Wonkwang University Sanbon Dental Hospital (Gunpo, Korea) for orthodontic treatment and who underwent CBCT were selected. Among 319 patients in this group, 99 patients without any exclusion factors were selected for this study. The average ages of the sample groups were 14.3 ± 3.27 years (ages 8−18 years) and 13.56 ± 3.12 years (ages 6−20 years) for male and female subjects, respectively. The total distributions for sex and age are shown in Table 1. We collected data that had been obtained from each patient for orthodontic diagnosis including CBCT images for
Table 1. Sex and age demographics of the sample (n = 99)
Age (yr) Sex
Total Female Male
< 10 11 10 21
≥ 10, < 12 22 14 36
≥ 12, < 14 7 6 13
≥ 14, < 16 5 3 8
≥16 14 7 21
Total 59 40 99
Mean of age ± SD 12.10 ± 3.354 11.93 ± 3.155 12.03 ± 3.221
SD, Standard deviation.
assessment of the midpalatal suture, hand-wrist and cephalometric radiographs for bone age, and panoramic radiographs for dental age. The exclusion criteria were as follows:
1. Any experience with orthodontic treatment 2. Disease or medicine intake affecting bone metabolism 3. Omission of any diagnostic data, including CBCT images 4. Poor-quality images that were difficult to distinguish
(e.g., blurry images)
5. More than 2 months’ difference between the dates when CBCT and other radiographs were acquired CBCT (PaX-Zenith3D; Vatech Korea Ind. Co., Gyeonggi- do, Korea) images were taken using the following para- meters: 105 kVp, 6.2 mAs, 15–24 second scan time, 0.2 and 0.3 mm voxel sizes, and field-of-view, 16 cm × 14 cm. The images were converted to Digital Imaging and Communication in Medicine (DICOM) format. DICOM files were reconstructed into a three-dimensional image by multiplanar reformatting and volume rendering using imaging software (InVivoDental 5.0; Anatomage, San Jose, CA, USA). Cephalometric radiographs, panoramic radiographs, and hand-wrist radiographs were evaluated by using an exclusive imaging program (PiViewSTAR;
Infinitt, Seoul, Korea).
All measurements were blind-tested by one ortho- dontist. A screen capture of every slide and image was taken and saved in JPEG file format for this study. Every slide and image was arranged on a black background and assessed on a 27-inch high-resolution (1,920 × 1,018 pixel) monitor using a viewer program (ACDSee Pro 6.2;
ACD Systems International Inc., Victoria, BC, Canada).
There was no modification made on the monitor or to the saved images, such as changing the brightness or contrast.
Reorientation of CBCT images
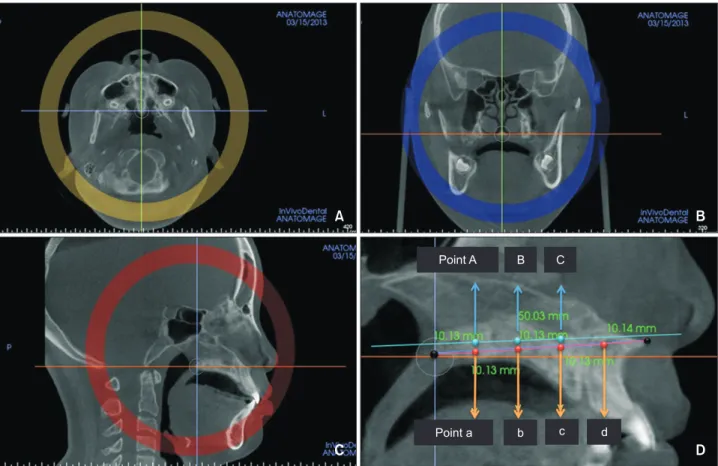
To standardize the CBCT images, head reorientation was performed. After making the position indicator visible, the vertical line of the cursor (green line) was matched to the axis of the palatal plane line (anterior nasal spine-posterior nasal spine; ANS-PNS) on an axial view (Figure 1A). At the same time, on a coronal view, the vertical line of the cursor was matched to the nasal septum, and the horizontal line of the cursor (orange line) was oriented parallel to the palatal plane (Figure 1B).
To facilitate observation of the axial cross-sectional planar view of the midpalatal suture, it was established
A
C
Point A B C
D
Point a b c d
B
Figure 1. Head reorientation and setting of the axial cross-sectional planar view. A, An axial plane view; B, a coronal
plane view; C, a sagittal plane view; and D, a midsagittal plane view.
that the horizontal line of the cursor would intersect the middle of the palate in the sagittal plane (Figure 1C). To evaluate the morphology of the midpalatal suture more accurately than in a previous study,
10a new axial cross- sectional plane was established as follows: four points that divide the ANS-PNS into fifths in the midsagittal plane were defined as point a, point b, point c, and point d, starting at the nearest PNS point (Figure 1D).
A vertical line was drawn from point a to the horizontal line of the cursor, and the points at which the extension of the vertical line met the upper and lower borders of the palatal bone were defined as point a’ and point a”, respectively. The midpoint of point a’ and point a” was defined as point A. Point B and point C were defined using the same method (Figure 1D). Point D was excluded from measurement because images of the nasopalatine canal and midpalatal suture showed a high tendency to overlap. The horizontal line of the cursor was matched to a virtual line connecting point A,
point B, and point C (Figure 1D). The horizontal cross- sectional image that showed the midpalatal suture most evidently and seemed longest was selected by moving the horizontal line up and down in a 1-mm range. If it was impossible to find a line connecting all three points, the shape of the palate was considered a curve, and two horizontal cross-sectional images going through point A–point B and point B–point C were observed.
Classification of midpalatal suture maturation and verification of the staging process
CBCT images of the midpalatal suture were assessed on an axial plane view from stage A to stage E according to the classification scheme of Angelieri et al.
10The morphology of the midpalatal suture was regarded as an indicator of maturation, similar to a previous study.
Additionally, we defined “CBCT stage” as the determined morphological stage of the midpalatal suture.
To make the assessment more accurate, maturation of
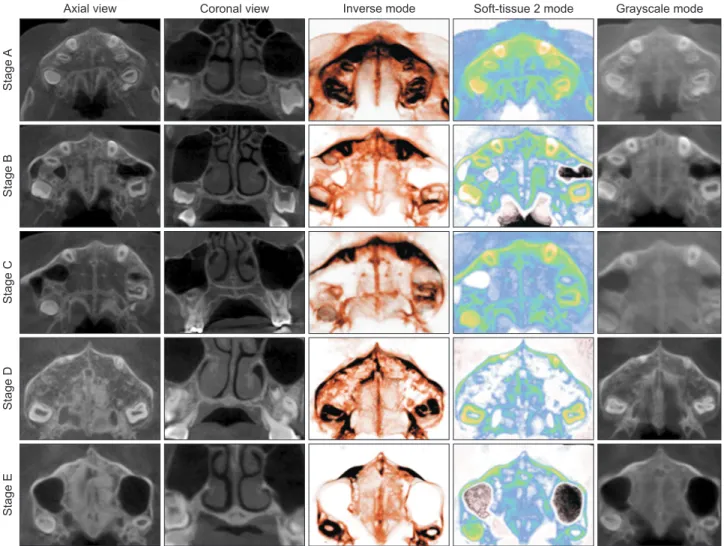
Figure 2. Cone-beam computed tomography images of the midpalatal suture and volume-rendered images according to maturation stage.
StageAStageBStageCStageDStageE
Axial view Coronal view Inverse mode Soft-tissue 2 mode Grayscale mode
the midpalatal suture was reconfirmed on a horizontal cross-sectional image by additionally investigating its morphology and fusion on a coronal cross-sectional planar view and on volume-rendered images.
When the coronal cross-sectional image was observed as showing fusion at all three points (point A–point C), it was categorized as stage E. If only some points showed fusion, it was judged as stage D. If the suture was open at all three points, it was judged as “before stage C”; if there were two high radiopaque lines with low density in the middle of the suture, or if the suture was not fused, it was considered as stage C. If only some points showed “stage C conditions,” it was judged as stage B. If there was no stage C condition and a mixture of opacity was observed at all three points, or if only one weak radiopaque line was observed, it was judged as stage A.
Then, the volume-rendered computed tomography image was clipped with a minimum unit of a 5-mm thickness, including the midpalatal suture. Opacity, brightness, and contrast were adjusted to maximize visibility on an axial plane view. Among the rendering modes in the software, only three modes (i.e., gray scale mode, inverse mode, and soft tissue 2 mode) that clearly visualized the midpalatal suture were used. Final maturation of the midpalatal suture was determined by reconfirming the result from each volume rendering mode (Figure 2).
Maturation assessments by bone age, dental age, and chronological age
The skeletal maturation indicator (SMI) proposed by Fishman
6,7was used on hand-wrist radiographs to evaluate bone age. The CVM was used on cephalometric radiographs, as suggested by Hassel and Farman.
8Dental age was assessed by applying the Hellman’s index to a panoramic radiograph.
9The chronological age and sex of each patient were investigated.
Statistical analysis
All statistical calculations were performed with IBM SPSS Statistics software ver. 22.0 (IBM Co., Armonk, NY, USA). The distribution and percentage of each measurement and age were calculated. After measurement, 30 samples were selected randomly from the same patient group after 2 months and re-assessed with the same method. The intra-class correlation coefficient (ICC) was calculated to test the reliability of the CBCT stage, and developmental age indices were determined by one investigator. There was high intra- rater reliability according to the results of ICC. ICC values were 0.995 (p < 0.05) for CBCT stage, 0.996 (p <
0.05) for the HWM, 0.991 (p < 0.05) for the CVM, and 0.992 (p < 0.05) for Hellman’s index.
To observe correlations between CBCT stages and each maturation index, Spearman’s rho rank order correlation analysis was performed. Additionally, the same analyses were performed to test for differences between the sexes. A crosstab analysis by contingency coefficients was performed to determine associations between CBCT stages and each maturation index. Assessment was
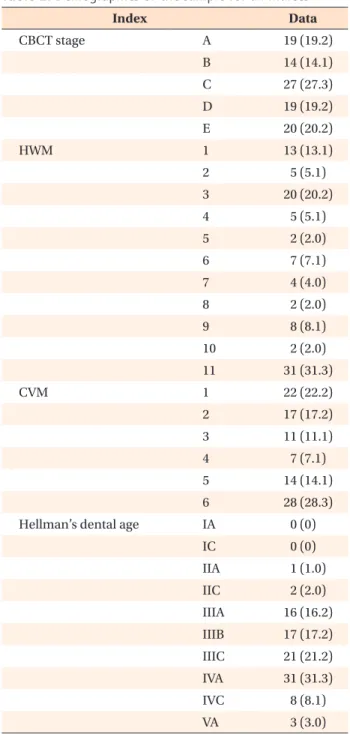
Table 2. Demographics of the sample for all indices
Index Data
CBCT stage A 19 (19.2)
B 14 (14.1)
C 27 (27.3)
D 19 (19.2)
E 20 (20.2)
HWM 1 13 (13.1)
2 5 (5.1)
3 20 (20.2)
4 5 (5.1)
5 2 (2.0)
6 7 (7.1)
7 4 (4.0)
8 2 (2.0)
9 8 (8.1)
10 2 (2.0)
11 31 (31.3)
CVM 1 22 (22.2)
2 17 (17.2)
3 11 (11.1)
4 7 (7.1)
5 14 (14.1)
6 28 (28.3)
Hellman’s dental age IA 0 (0)
IC 0 (0)
IIA 1 (1.0)
IIC 2 (2.0)
IIIA 16 (16.2) IIIB 17 (17.2) IIIC 21 (21.2)
IVA 31 (31.3)
IVC 8 (8.1)
VA 3 (3.0)
Values are presented as number (%). Both sexes are included.
CBCT stage, Midpalatal suture maturation stage using cone-
beam computed tomography images; HWM, hand and wrist
method; CVM, cervical vertebrae method.
Table 3. Distribution of the HWM according to CBCT stage (n = 99) HWM
CBCT stage
A B C D E
M F T M F T M F T M F T M F T
1 8 4 12 1 1
2 1 1 1 1 2 1 1 2
3 4 2 6 5 2 7 2 5 7
4 2 2 1 2 3
5 1 1 1 1
6 1 1 1 5 6
7 1 1 2 2 2
8 1 1 1 1
9 1 4 5 1 2 3
10 2 2
11 5 8 13 4 14 18
HWM, Hand and wrist method; CBCT stage, midpalatal suture maturation stage using cone-beam computed tomography images; M, distribution of the male group; F, distribution of the female group; T, distribution of the total sample group.
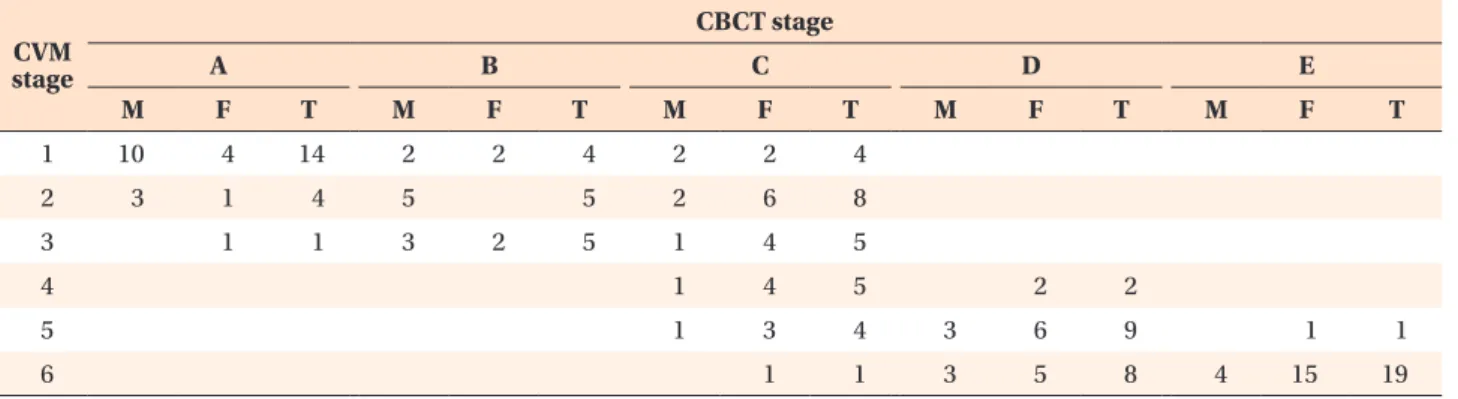
Table 4. Distribution of the CVM according to CBCT stage (n = 99) stage CVM
CBCT stage
A B C D E
M F T M F T M F T M F T M F T
1 10 4 14 2 2 4 2 2 4
2 3 1 4 5 5 2 6 8
3 1 1 3 2 5 1 4 5
4 1 4 5 2 2
5 1 3 4 3 6 9 1 1
6 1 1 3 5 8 4 15 19
CVM, Cervical vertebrae method; CBCT stage, midpalatal suture maturation stage using cone-beam computed tomography images; M, distribution of the male group; F, distribution of the female group; T, distribution of the total sample group.
Table 5. Distribution of Hellman’s dental age according to CBCT stage (n = 99) Hellman’s
index
CBCT stage
A B C D E
M F T M F T M F T M F T M F T
IIA 1 1
IIC 1 1 2
IIIA 7 5 12 1 1 2 2 2
IIIB 3 3 3 1 4 2 6 8 2 2
IIIC 2 2 4 4 4 7 11 3 3 1 1
IVA 2 1 3 1 5 6 4 7 11 11 11
IVAC 2 1 3 2 3 5
VA 2 1 3
CBCT stage, Midpalatal suture maturation stage using cone-beam computed tomography images; M, distribution of the male
group; F, distribution of the female group; T, distribution of the total sample group.
performed by using gamma (γ) and Kendall’s tau-b (τ- b) as association measures. Additionally, crosstab analyses between the sexes were performed to find any sex differences.
RESULTS
Demographics of the sample
The distribution of the total sample and the sexes related to each developmental age index according to CBCT stage (maturation of the midpalatal suture) are presented in Tables 2 to 6.
Correlation between indices using a rank order correlation analysis
Correlations between CBCT stage and developmental age indices (HWM, CVM, and Hellman’s dental age) or chronological age were investigated. The same analysis was performed according to sex (Table 7). All values showed statistically significant correlations (p < 0.01).
The HWM and CBCT stage showed an especially strong correlation (0.904) and the CVM and CBCT stage showed a strong correlation (0.874). Correlations between CBCT stage and Hellman’s index for chronological age were relatively weak (0.777 and 0.774, respectively). In male subjects, a strong correlation was observed between CBCT stage and the HWM (0.857). The CVM also showed
a strong correlation (0.813), and this result was similar in female subjects (0.887 and 0.862, respectively).
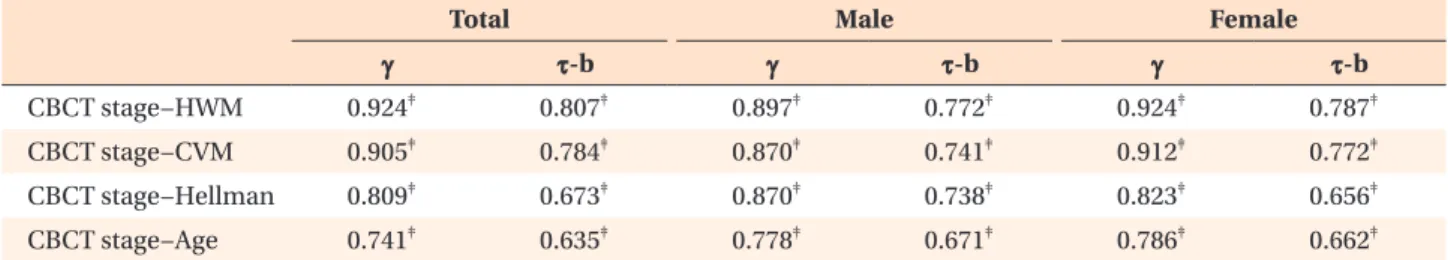
Association between indices using contingency coefficients
The results of the crosstab analysis between CBCT stage and the HWM, CVM, Hellman’s index, and chronological age are presented in Table 8. All measurements showed significant correlations (p < 0.0001). Crosstab analysis by contingency coefficients showed that the HWM and CVM had the highest γ and Kendall’s τ-b values. When compared, the HWM and CVM both showed significantly high values, but the HWM showed a slightly higher value (γ = 0.924 > 0.905, Kendall’s τ-b = 0.087 > 0.784). The association between Hellman’s index and chronological age also reached a significant level, but the contingency coefficient values were lower than those for the HWM and CVM (γ = 0.809 and 0.741; and Kendall’s τ-b = 0.673 and 0.635, respectively).
The crosstab analysis according to sex also showed that the HWM and CVM were significantly higher, while Hellman’s index and chronological age were relatively lower (Table 8).
DISCUSSION
There have been many attempts to determine whether Table 6. Distribution of chronological age according to CBCT stage (n = 99)
Chronologic age
CBCT stage
A B C D E
M F T M F T M F T M F T M F T
6 1 1
7 2 2 1 1
8 3 2 5 1 1 1 1
9 4 1 5 1 1 2 2 4
10 4 4 3 1 4 6 6 1 1
11 2 2 3 1 4 2 7 9 4 4 2 2
12 2 2 2 2 1 1 1 1
13 1 1 3 3 1 1 2 1 1
14 1 1 2 1 1 2 2
15 1 1 1 1 2
16 1 1 2 5 5
17 4 4 1 3 4
18 2 2 1 1 2
19 1 1
20 1 1
CBCT stage, Midpalatal suture maturation stage using cone-beam computed tomography images; M, distribution of the male
group; F, distribution of the female group; T, distribution of the total sample group.
surgical procedures are necessary to expand the maxilla.
SARPE has been recommended by Timms and Vero
11for patients aged 25 years and older and by Epker and Wolford
12for those aged 16 years and older. Moreover, many other studies recommended various ages from 14 to 20 years and older.
13-15However, accurate clinical guidelines regarding treatment timing for maxillary expansion are not available. Additionally, existing studies have shortcomings in that they suggested appropriate treatment timing in chronological age; however, it is generally known that chronological age is not a precise index in predicting skeletal maturation, and these studies did not assess the midpalatal suture itself.
16,17Therefore, the aim of this study was to investigate the relationship between various developmental age indices
including skeletal age and the morphology of the midpalatal suture.
To evaluate the morphology of the midpalatal suture according to maturation, CBCT images were assessed by conventional methods.
10,18However, conventional methods have limitations, including the possibility of the images appearing different depending on the position of the cross-sectional slice. If the cross-sectional slice is not positioned properly in the middle of the midpalatal suture, the practitioner can misjudge the CBCT stage. There fore, in this study, it was established that the cross-section slice would intersect the middle of the palate, and maturation of the midpalatal suture also was evaluated based on a coronal cross-sectional planar view and on various volume-rendered images (Figures 1 and 2).
Table 7. Results of Spearman’s rho rank order correlation analysis
Index CBCT stage HWM CVM Hellman Age
Total CBCT stage - 0.904
†0.874
†0.777
†0.774
†HWM 0.904
†- 0.945
†0.859
†0.883
†CVM 0.874
†0.945
†- 0.791
†0.824
†Hellman 0.777
†0.859
†0.791
†- 0.868
†Age 0.774
†0.883
†0.824
†0.868
†-
Male CBCT stage - 0.857
†0.813
†0.823
†0.785
†HWM 0.857
†- 0.915
†0.873
†0.906
†CVM 0.813
†0.915
†- 0.797
†0.834
†Hellman 0.823
†0.873
†0.797
†- 0.932
†Age 0.785
†0.906
†0.834
†0.932
†-
Female CBCT stage - 0.887
†0.862
†0.742
†0.781
†HWM 0.887
†- 0.932
†0.850
†0.902
†CVM 0.862
†0.932
†- 0.781
†0.844
†Hellman 0.742
†0.850
†0.781
†- 0.804
†Age 0.781
†0.902
†0.844
†0.804
†-
CBCT stage, Midpalatal suture maturation stage using cone-beam computed tomography images; HWM, hand and wrist method; CVM, cervical vertebrae method; Hellman, Hellman’s dental age; Age, chronological age.
†
Significant difference by Spearman’s rho rank order correlation analysis (p < 0.01).
Table 8. Analysis of associations between CBCT stage and maturation indices using crosstabs
Total Male Female
γ τ-b γ τ-b γ τ-b
CBCT stage−HWM 0.924
‡0.807
‡0.897
‡0.772
‡0.924
‡0.787
‡CBCT stage−CVM 0.905
‡0.784
‡0.870
‡0.741
‡0.912
‡0.772
‡CBCT stage−Hellman 0.809
‡0.673
‡0.870
‡0.738
‡0.823
‡0.656
‡CBCT stage−Age 0.741
‡0.635
‡0.778
‡0.671
‡0.786
‡0.662
‡CBCT stage, Midpalatal suture maturation stage using cone-beam computed tomography images; HWM, hand and wrist method; CVM, cervical vertebrae method; Hellman, Hellman’s dental age; Age, chronological age; γ, gamma as an association measure for the crosstabs; τ-b, Kendall’s tau (τ)-b as an association measure for the crosstabs.
‡