INTRODUCTION
In breast cancers, angiogenesis, the process of new blood vessel formation, plays a crucial role in tumor growth, invasion, and distant metastasis (1, 2). Dynamic contrast-
Kinetic Features of Invasive Breast Cancers on Computer-Aided Diagnosis Using 3T MRI Data:
Correlation with Clinical and Pathologic Prognostic Factors
Sung Eun Song, MD, PhD
1, Kyu Ran Cho, MD, PhD
1, Bo Kyoung Seo, MD, PhD
2, Ok Hee Woo, MD, PhD
3, Seung Pil Jung, MD, PhD
4, Deuk Jae Sung, MD, PhD
1Departments of 1Radiology and 4Surgery, Korea University Anam Hospital, Korea University College of Medicine, Seoul, Korea; 2Department of Radiology, Korea University Ansan Hospital, Korea University College of Medicine, Ansan, Korea; 3Department of Radiology, Korea University Guro Hospital, Korea University College of Medicine, Seoul, Korea
Objective: To investigate the correlation of kinetic features of breast cancers on computer-aided diagnosis (CAD) of preoperative 3T magnetic resonance imaging (MRI) data and clinical-pathologic factors in breast cancer patients.
Materials and Methods: Between July 2016 and March 2017, 85 patients (mean age, 54 years; age range, 35–81 years) with invasive breast cancers (mean, 1.8 cm; range, 0.8-4.8 cm) who had undergone MRI and surgery were retrospectively enrolled.
All magnetic resonance images were processed using CAD, and kinetic features of tumors were acquired. The relationships between kinetic features and clinical-pathologic factors were assessed using Spearman correlation test and binary logistic regression analysis.
Results: Peak enhancement and angio-volume were significantly correlated with histologic grade, Ki-67 index, and tumor size: r = 0.355 (p = 0.001), r = 0.330 (p = 0.002), and r = 0.231 (p = 0.033) for peak enhancement, r = 0.410 (p = 0.005), r = 0.341 (p < 0.001), and r = 0.505 (p < 0.001) for angio-volume. Delayed-plateau component was correlated with Ki-67 (r = 0.255 [p = 0.019]). In regression analysis, higher peak enhancement was associated with higher histologic grade (odds ratio [OR] = 1.004; 95% confidence interval [CI]: 1.001–1.008; p = 0.024), and higher delayed-plateau component and angio-volume were associated with higher Ki-67 (OR = 1.051; 95% CI: 1.011–1.094; p = 0.013 for delayed-plateau component, OR = 1.178; 95% CI: 1.023–1.356; p = 0.023 for angio-volume).
Conclusion: Of the CAD-assessed kinetic features, higher peak enhancement may correlate with higher histologic grade, and higher delayed-plateau component and angio-volume correlate with higher Ki-67 index. These results support the clinical application of kinetic features in prognosis assessment.
Keywords: Breast Neoplasms; MRI; Prognostic factor; Computer-aided diagnosis (CAD); Kinetic feature
Received August 30, 2018; accepted after revision November 30, 2018.
This study is supported by Guerbet Korea.
Corresponding author: Kyu Ran Cho, MD, PhD, Department of Radiology, Korea University Anam Hospital, Korea University College of Medicine, 73 Inchon-ro, Seongbuk-gu, Seoul 02841, Korea.
• Tel: (822) 920-5673 • Fax: (822) 929-3796 • E-mail: [email protected]
This is an Open Access article distributed under the terms of the Creative Commons Attribution Non-Commercial License (https://
creativecommons.org/licenses/by-nc/4.0) which permits unrestricted non-commercial use, distribution, and reproduction in any medium, provided the original work is properly cited.
enhanced magnetic resonance imaging (DCE-MRI) allows indirect estimation of the tissue vasculature which is thought to be associated with tumor angiogenesis (3). In clinical practice, kinetic profiles of breast DCE-MRI can be assessed using manual measurements or computer-aided
Korean J Radiol 2019;20(3):411-421https://doi.org/10.3348/kjr.2018.0587
diagnosis (CAD). CAD is a post-processing software program that promptly analyzes detailed kinetics (4) and provides quantitative kinetic information (5, 6). Recently, several studies have revealed that kinetic features analyzed using CAD correlated with survival outcomes in invasive breast cancer patients (7-10). One study showed that a higher peak enhancement and a higher washout component were associated with poorer disease-free survival, and peak enhancement enabled differentiation of patients with or without recurrence (7). Another study reported that angio- volume and peak enhancement correlated with poorer survival outcomes (8). CAD-assessed kinetic features were also used to predict response or prognosis in cancer patients undergoing neoadjuvant chemotherapy (NAC) (9- 11). A higher plateau component within a tumor before NAC was reported to have a negative impact on the complete pathologic response of NAC (9), and smaller reductions in both angio-volume and washout component after NAC were reported to be associated with poor overall outcome (10).
Therefore, CAD of DCE-MRI could be not only a diagnostic but also a prognostic tool. For the use of these kinetic features in the development of prognosis prediction model as imaging biomarkers, the association between kinetic features and clinical-pathologic factors should be clearly clarified. To the best of our knowledge, there has been only one study to reveal the association between CAD-assessed kinetic features and several prognostic factors, including lymph node (LN) status, tumor grade, expression statuses of estrogen receptor (ER), progesterone receptor (PR), human epidermal growth factor receptor type 2 (HER2) (12).
In that study, plateau voxel volumes were independent predictors of ER/PR and HER2 statuses, and the strongest peak enhancement predicted negative ER/PR (12). However, there is still lack of evidence regarding the correlation and further studies are needed. Therefore, we investigated the association of CAD-assessed kinetic features in invasive breast cancer patients with a wider spectrum of clinical- pathologic factors and aimed to find kinetic features which could correlate with clinical-pathologic prognostic factors.
MATERIALS AND METHODS
Study Population
This retrospective study was performed with Institutional Review Board (IRB) approval and the requirement for obtaining informed patient consent was waived (IRB number 2018AN0128). Between July 2016 and March 2017,
114 consecutive women with newly diagnosed invasive breast cancers, confirmed with imaging-guided core needle biopsy, underwent preoperative DCE-MRI and CAD. We excluded women who 1) received NAC before surgery (n = 19), 2) had inadequate CAD-assessed images (n = 7), and 3) did not undergo curative surgery at our institution (n = 3). Thus, 85 women (mean age, 54 years; age range, 35–81 years) with 85 invasive breast cancers were enrolled in this study. Of the 85 women, 65 (76.5%) had single lesions, and 20 (23.5%) had multiple lesions. In case of multiple lesions, only the largest lesion was selected for the analysis. Of the 85 women, 60 underwent breast conserving surgeries and 25 underwent mastectomies. The median interval between DCE-MRI and surgery was 7 days (range, 2–29 days).
MRI Technique
All MRI examinations were performed using a MAGNETOM Prisma 3T scanner (Siemens Healthineers, Erlangen, Germany) with a dedicated, phased array breast coil in the axial orientation; patients were placed in the prone position. After a bilateral transverse localizer image was acquired, axial fat-suppressed T2-weighted turbo spin- echo images were obtained. DCE-MRI images including one pre-contrast and five post-contrast enhanced images were acquired with bilateral axial, fat-suppressed, T1-weighted three-dimensional gradient echo sequence (6.0/2.0; matrix, 384 x 384; flip angle, 15°; field of view, 360 x 360 mm;
section thickness, 1.0 mm; no gap). A bolus of 0.1 mmol/
kg gadoterate (Dotarem; Guerbet, Villepinte, France) was intravenously injected. Five contrast-enhanced images were obtained at 60, 120, 180, 240, and 300 seconds.
MR Image Analysis
Two breast radiologists with 17 and 7 years’ experience in breast radiology, respectively, assessed the morphological characteristics of each lesion according to the breast imaging reporting and data system (BI-RADS) MRI atlas of the American College of Radiology (13), reaching a consensus in each case. In accordance with the BI-RADS atlas (13), the following descriptors were used to analyze mass and non-mass enhancement.
CAD Image Analysis
For CAD analysis, all magnetic resonance (MR) images
were transferred to CAD system (CADstream, version
6.0, Confirma, Kirkland, WA, USA) and processed for the
assessment of kinetic parameters. According to previous
studies suggesting that the most appropriate threshold in the CAD system would be 50–60% to balance the sensitivity and specificity (14, 15), we selected a 50% threshold. A color-overlay angio-map was placed at all enhancing lesions above a set threshold of 50%. When one radiologist selected
the largest tumor on angio-map, the following parameters were calculated for each lesion: peak enhancement (highest pixel signal intensity at the first post-contrast images), angio-volume (total enhancing lesion volume), early phase profiles, and delayed phase profiles (Figs. 1, 2). The early phase profiles were summarized as percentage of medium (50–100%), or rapid (> 100%) enhancement components within a tumor. The delayed phase profiles were summarized as persistent, plateau, and washout components within a tumor. The persistent components represented pixel signal intensity with at least a 10% increase; the plateau components indicated pixel signal intensity with a less than 10% increase, and a less than 10% decrease; the washout components represented pixel signal intensity with at least a 10% decrease in the last post-contrast series compared to first post-contrast series.
Clinical-Pathologic Evaluation
Clinical-pathologic data including age, tumor size, histologic type, histologic grade according to the Nottingham combined histologic grading system (16), presence of ductal carcinoma in situ (DCIS), LN status, lymphovascular invasion (LVI), Ki-67 index, ER, PR and HER2 status were collected. The ER or PR positivity was indicated by stained nuclei in > 1% of cancer cells on 10 high-power fields. The HER2 staining intensity was scored as 0, 1+, 2+, or 3+ (17). Tumors with 3+ scores were classified as HER2-positive, whereas those with scores of 0 or 1+ as HER2-negative. Tumors with 2+ scores were further investigated with fluorescence in situ hybridization to determine the HER2 status. For the Ki-67 index status, we used a cutoff value of 14% for classification into low- and high-expression groups (18).
Data and Statistical Analysis
All cases were assigned to one of two groups as per dichotomized clinical-pathologic factors according to the following criteria: age (< 50 years or ≥ 50 years), histologic type (invasive ductal or others), histologic grade (low [I, II] or high [III]), presence of DCIS (absent, focal, or present), tumor size (< 2 cm or ≥ 2 cm), LN status (negative or positive), LVI (absent or present), ER status (negative or positive), PR status (negative or positive), HER2 status (negative or positive), and Ki-67 index (< 14% or ≥ 14%).
Mann-Whitney U tests or Kruskal-Wallis test were used for comparison between two or three groups.
The Spearman rank correlation test was used to acquire
Fig. 1. MR image with CAD angio-map of 48-year-old womanwith right breast cancer. Auto-portfolio of CAD system indicates tumor enhancement kinetics with 295% peak enhancement, 99%
early-rapid component and 45% delayed-plateau component.
Patient underwent modified radical mastectomy. Surgical pathologic examination revealed 2.8-cm invasive ductal carcinoma with histologic grade III that was ER negative, PR negative, and HER2 positive.
Axillary LN metastasis was not found. Ki-67 index was 20%. CAD = computer-aided diagnosis, ER = estrogen receptor, HER2 = human epidermal growth factor receptor type 2, LN= lymph node, MR = magnetic resonance, PR = progesterone receptor
Fig. 2. MR image with CAD angio-map of 66-year-old woman with right breast cancer. Auto-portfolio of CAD system indicates tumor enhancement kinetics with 155% peak enhancement, 70%
early-rapid component and 1% delayed-plateau component. Patient underwent breast-conserving surgery. Surgical pathologic examination revealed 1.6-cm invasive ductal carcinoma with histologic grade I that was ER positive, PR negative, and HER2 negative. Axillary LN metastasis was not found. Ki-67 index was 5%.
the correlation coefficient rho (r) between kinetic features and clinical-pathologic factors which were continuous variables and showed statistical significances in Mann- Whitney U tests.
In order to reveal independent predictor factors, kinetic features with significant differences between clinical- pathologic features in univariate analysis were further assessed using binary logistic regression analysis with backward feature elimination, using dichotomized clinical- pathologic features as dependent variables and kinetic
features as covariates.
All data analyses were performed using SPSS Statistics for Windows, Version 20 (IBM Corp., Armonk, NY, USA); p values < 0.05 were considered significant.
RESULTS
Clinical-Pathologic Factors and Morphologic Characteristics
The vast majority of histologic type of the cancers (75 of
Table 1. CAD-Assessed Peak Enhancement, Angio-Volume, and Early Phase Enhancement Kinetic Features According to Clinical- Pathologic Prognostic Factors of 85 Invasive Breast CancersFeatures
All Patients (n = 85)*
Peak Enhancement (%)
Angio-Volume (cm3)
Early-Rapid Component (%)
Early-Medium Component (%) Number Median Value P Median Value P Median Value P Median Value P
Age (years) 0.173 0.879 0.113 0.109
< 50 39 (45.8) 284 ± 204 1.70 ± 6.12 93 ± 31 7 ± 31
≥ 50 46 (54.2) 258 ± 133 2.70 ± 3.84 82 ± 31 18 ± 31
Histologic type 0.902 0.820 0.412 0.412
Invasive ductal 75 (88.2) 262 ± 178 2.15 ± 4.78 87 ± 31 13 ± 31
Others 10 (11.8) 284 ± 113 1.80 ± 6.49 92 ± 27 7 ± 27
Histologic grade 0.003 0.001 0.707 0.704
I or II 50 (58.8) 237 ± 119 1.50 ± 3.16 89 ± 33 11 ± 33
III 35 (41.2) 323 ± 210 3.70 ± 6.51 88 ± 27 12 ± 27
Presence of DCIS 0.572 0.131 0.832 0.829
Absent or focal 39 (45.9) 254 ± 207 1.60 ± 6.24 89 ± 30 11 ± 30
Present 46 (54.1) 396 ± 136 2.80 ± 3.75 87 ± 31 13 ± 31
Tumor size (cm) 0.034 < 0.001 0.556 0.559
< 2 51 (60.0) 252 ± 169 1.50 ± 2.65 90 ± 29 10 ± 29
≥ 2 34 (40.0) 307 ± 170 4.60 ± 6.55 85 ± 33 14 ± 33
LN status 0.256 0.087 0.931 0.931
Negative 67 (78.8) 264 ± 167 2.00 ± 3.40 87 ± 28 13 ± 28
Positive 18 (21.2) 313 ± 185 3.50 ± 8.42 90 ± 38 9 ± 38
LVI 0.718 0.211 0.599 0.594
Absent Present
75 (88.2) 10 (11.8)
274 ± 172 298 ± 169
2.05 ± 5.02 3.55 ± 5.04
89 ± 30 82 ± 39
11 ± 30 17 ± 39
ER status 0.101 0.002 0.100 0.101
Negative 13 (15.3) 348 ± 130 4.90 ± 5.14 93 ± 24 7 ± 24
Positive 72 (84.7) 259 ± 177 1.70 ± 4.84 85 ± 31 14 ± 31
PR status 0.167 0.011 0.712 0.716
Negative 20 (23.5) 323 ± 230 4.10 ± 4.13 87 ± 23 13 ± 23
Positive 65 (76.5) 255 ± 146 1.65 ± 5.21 90 ± 33 10 ± 33
HER2 status 0.076 0.439 0.071 0.071
Negative 57 (67.1) 248 ± 191 1.90 ± 5.79 84 ± 30 16 ± 30
Positive 28 (32.9) 307 ± 122 3.10 ± 3.62 93 ± 31 6 ± 31
Ki-67 status 0.016 0.012 0.042 0.041
Low (< 14%) 46 (54.1) 233 ± 175 1.60 ± 2.77 79 ± 33 20 ± 33
High (≥ 14%) 39 (45.9) 315 ± 163 3.40 ± 6.54 92 ± 26 8 ± 26
*Data are numbers of cancers with percentages in parentheses. CAD = computer-aided diagnosis, DCIS = ductal carcinoma in situ, ER = estrogen receptor, HER2 = human epidermal growth factor receptor type 2, LN = lymph node, LVI = lymphovascular invasion, PR = progesterone receptor
85, 88.2%) were invasive ductal carcinomas, not otherwise specified, and remaining cancers (10 of 85, 11.8%) included 3 invasive micropapillary carcinomas, 3 invasive lobular carcinomas, 2 invasive cribriform carcinomas, 1 invasive medullary carcinoma, and 1 invasive mucinous carcinoma.
Fifty cancers (58.8%) were histologic grades I or II (11 cancers for grade I, 39 cancers for grade II) and 35 (41.2%) were grade III. Forty-six patients had a DCIS component (54.1%). The mean size of the 85 invasive cancers was 1.8
cm (range: 0.8–4.8 cm); 51 patients had a pT1 (< 2 cm) and 34 had a pT2 (≥ 2 cm). Eighteen patients (21.2%) had positive axillary LNs; 10 (11.8%) had positive LVIs. The cancers of 72 patients (84.7%) were ER-positive, 65 (76.5%) were PR-positive, and 28 (32.9%) were HER2-positive.
Thirty-nine patients (45.9%) had high Ki-67 (Table 1). Of the 85 lesions, 75 (88.2%) were masses, and 10 (11.8%) were non-mass enhancements. Among 75 masses, not circumscribed margin was only associated with positive LN
Table 2. Association of Shape, Margin, and Internal Enhancement Characteristics According to Clinical-Pathologic Prognostic Factors of 75 Invasive Breast Cancers Representing as MassesFeatures All Patients (n = 75)*
Mass Shape Mass Margin Internal Enhancement
Characteristics Oval or
Round (n = 29)
Irregular
(n = 46) P Circumscribed (n = 23)
Not Circumscribed
(n = 52) P
Homogeneous or Heterogeneous
(n = 35)
Rim (n = 17) P
Age (years) 0.245 0.152 0.330
< 50 30 (40.0) 14 (48.3) 16 (34.8) 12 (52.2) 18 (34.6) 23 (65.7) 14 (82.4)
≥ 50 45 (60.0) 15 (51.7) 30 (65.2) 11 (47.8) 34 (65.4) 12 (34.3) 3 (17.6)
Histologic type 0.226 0.443 1.000
Invasive ductal 66 (88.0) 24 (82.8) 42 (91.3) 19 (82.6) 47 (90.4) 31 (88.6) 16 (94.1)
Others 9 (12.0) 5 (17.2) 4 (8.7) 4 (17.4) 5 (9.6) 4 (11.4) 1 (5.9)
Histologic grade 0.858 0.925 0.908
I or II 43 (57.3) 17 (58.6) 26 (56.5) 13 (56.5) 30 (57.7) 20 (57.1) 10 (58.8)
III 32 (42.7) 12 (41.4) 20 (43.5) 10 (43.5) 22 (42.3) 15 (42.9) 7 (41.2)
Presence of DCIS 0.338 0.127 0.378
Absent or focal 37 (50.0) 16 (57.1) 21 (45.7) 14 (63.6) 23 (44.2) 14 (40.0) 9 (52.9)
Present 37 (50.0) 12 (42.9) 25 (54.3) 8 (36.4) 29 (55.8) 21 (60.0) 8 (47.1)
Tumor size (cm) 0.164 0.559 0.778
< 2 57 (76.0) 25 (86.2) 32 (69.6) 19 (82.6) 38 (73.1) 26 (74.3) 12 (70.6)
≥ 2 18 (24.0) 4 (13.8) 14 (30.4) 4 (17.4) 14 (26.9) 9 (25.7) 5 (29.4)
LN status 0.050 0.044 0.076
Negative 57 (76.0) 26 (89.7) 31 (67.4) 21 (91.3) 36 (69.2) 27 (77.1) 9 (52.9)
Positive 18 (24.0) 3 (10.3) 15 (32.6) 2 (8.7) 16 (30.8) 8 (22.9) 8 (47.1)
LVI 0.732 1.000 1.000
Absent Present
65 (86.7) 10 (13.3)
26 (89.7) 3 (10.3)
39 (84.8) 7 (15.2)
20 (87.0) 3 (13.0)
45 (86.5) 7 (13.5)
30 (85.7) 5 (14.3)
15 (88.2) 2 (11.8)
ER status 1.000 1.000 0.413
Negative 11 (14.7) 4 (13.8) 7 (15.2) 3 (13.0) 8 (15.4) 4 (11.4) 4 (23.5)
Positive 64 (85.3) 25 (86.2) 39 (84.8) 20 (87.0) 44 (84.6) 31 (88.6) 13 (76.5)
PR status 0.982 0.760 0.232
Negative 18 (24.0) 7 (24.1) 11 (23.9) 5 (21.7) 13 (25.0) 7 (20.0) 6 (35.3)
Positive 57 (76.0) 22 (75.9) 35(76.1) 18 (78.3) 39 (75.0) 28 (80.0) 11 (64.7)
HER2 status 0.569 0.600 0.330
Negative 52 (69.3) 19 (65.5) 33 (71.7) 15 (65.2) 37 (71.2) 23 (65.7) 14 (82.4)
Positive 23 (30.7) 10 (34.5) 13 (28.3) 8 (34.8) 15 (28.8) 12 (34.3) 3 (17.6)
Ki-67 status 0.307 0.085 0.280
Low (< 14%) 41 (54.7) 18 (62.1) 23 (50.0) 16 (69.6) 25 (48.1) 15 (42.9) 10 (58.8) High (≥ 14%) 34 (45.3) 11 (37.9) 23 (50.0) 7 (30.4) 27 (51.9) 20 (57.1) 7 (41.2)
*Data are numbers of cancers representing as masses with percentages in parentheses.
status (p = 0.044) (Table 2).
CAD-Assessed Kinetic Features According to Clinical- Pathologic Factors
The median peak enhancement was higher in high-grade tumors than in low-grade tumors (323 ± 210% vs. 237 ± 119%, p = 0.003) (Table 1). It was higher according to higher histologic grade at Kruskal-Wallis test (194 ± 141%
in tumors with grade I, 255 ± 113% in tumors with grade II, and 323 ± 210% in tumors with grade III, p = 0.005) (Fig. 3A). The median peak enhancement was also higher in tumors with high Ki-67 index than in tumors with low Ki- 67 index (315 ± 163% vs. 233 ± 175%, p = 0.016), and in tumors ≥ 2 cm than in tumors < 2 cm (307 ± 170% vs. 252
± 167%, p = 0.034).
The median angio-volume was larger in high-grade tumors
than in low-grade tumors (3.70 ± 6.51 cm
3vs. 1.50 ± 3.16 cm
3, p = 0.001), in tumors ≥ 2 cm than in tumors < 2 cm (4.60 ± 6.55 cm
3vs. 1.50 ± 2.65 cm
3, p < 0.001) (Fig. 3B), in ER-negative tumors than in ER-positive tumors (4.90 ± 5.14 cm
3vs. 1.70 ± 4.84 cm
3, p = 0.002), in PR-negative tumors than in PR-positive tumors (4.10 ± 4.13 cm
3vs. 1.65
± 5.21 cm
3, p = 0.011), and in tumors with high Ki-67 index than in tumors with low Ki-67 index (3.40 ± 6.54 cm
3vs.
1.60 ± 2.77 cm
3, p = 0.012).
Of early phase enhancement profiles, the median rapid component was higher in tumors with high Ki-67 index than in tumors with low Ki-67 index (92 ± 26% vs. 79 ± 33%, p = 0.042). Of delayed phase enhancement profiles, the median plateau component was higher in ER-negative tumors than in ER-positive tumors (44 ± 11% vs. 30 ± 12%, p = 0.006) (Fig. 3C), and in tumors with high Ki-67 index than in
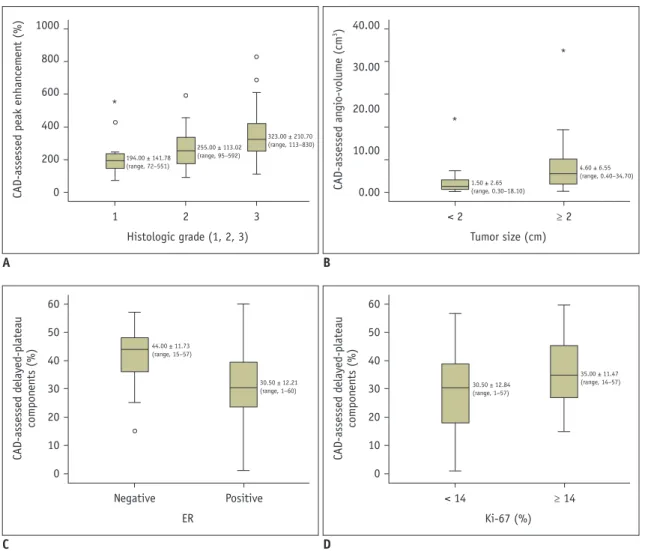
Fig. 3. Boxplots of CAD-assessed kinetic features according to clinical-pathologic factors.
A. Median peak enhancement was significantly higher according to higher histologic grade (p = 0.005). B. Median angio-volume was significantly larger in tumors ≥ 2 cm than in tumors < 2 cm (p < 0.001). C. Median delayed-plateau component was significantly higher in ER-negative tumors than in ER-positive tumors (p = 0.006). D. Median delayed-plateau component was significantly higher in tumors with high Ki-67 index than in tumors with low Ki-67 index (p = 0.030).
1 2 3
Histologic grade (1, 2, 3)
194.00 ± 141.78 (range, 72–551)
255.00 ± 113.02 (range, 95–592)
323.00 ± 210.70 (range, 113–830)
1000 800 600 400 200 CAD-assessed peak enhancement (%) 0
A
*
< 2 ≥ 2
Tumor size (cm)
1.50 ± 2.65 (range, 0.30–18.10)
4.60 ± 6.55 (range, 0.40–34.70)
40.00
30.00
20.00
10.00
3CAD-assessed angio-volume (cm) 0.00
B
*
*
Negative Positive
ER
44.00 ± 11.73 (range, 15–57)
30.50 ± 12.21 (range, 1–60)
60 50 40 30 20 10 0 CAD-assessed delayed-plateau components (%)
C
< 14 ≥ 14
Ki-67 (%)
30.50 ± 12.84 (range, 1–57)
35.00 ± 11.47 (range, 14–57)
60 50 40 30 20 10 0 CAD-assessed delayed-plateau components (%)
D
tumors with low Ki-67 index (35 ± 11% vs. 30 ± 12%, p = 0.030) (Fig. 3D) (Table 3).
Correlation between Kinetic Features and Clinical- Pathologic Factors
On correlation test, both peak enhancement and angio- volume correlated with histologic grade, Ki-67 index, and tumor size (r = 0.355 [p = 0.001], r = 0.330 [p = 0.002], and r = 0.231 [p = 0.033] for peak enhancement, r = 0.410 [p = 0.005], r = 0.341 [p < 0.001], and r = 0.505 [p < 0.001]
for angio-volume) (Fig. 4). Plateau component correlated with Ki-67 index (r = 0.255 [p = 0.019]), however,
correlation coefficient between rapid component and Ki-67 index did not reach statistical significance (r = 0.202 [p = 0.063]) (Table 4).
Binary Logistic Regression Analysis
In binary logistic regression analysis, higher peak enhancement was associated with higher histologic grade (odds ratio [OR] = 1.004; 95% confidence interval [CI]: 1.001, 1.008; p = 0.024), larger angio-volume was associated with larger tumor size (OR = 1.384; 95%
CI: 1.141, 1.679; p = 0.001), higher delayed-plateau component was associated with negative ER status (OR
Table 3. CAD-Assessed Delayed Phase Enhancement Kinetic Features According to Clinical-Pathologic Prognostic Factors of 85 Invasive Breast Cancers
Features Delayed-Persistent Component (%) Delayed-Plateau Component (%) Delayed-Washout Component (%)
Median Value P Median Value P Median Value P
Age (years) 0.154 0.469 0.210
< 50 39 ± 22 35 ± 12 24 ± 20
≥ 50 46 ± 23 30 ± 12 16 ± 20
Histologic type 0.470 0.058 0.504
Invasive ductal 43 ± 21 34 ± 12 17 ± 17
Others 29 ± 34 24 ± 12 26 ± 32
Histologic grade 0.180 0.344 0.165
I or II 44 ± 25 31 ± 13 14 ± 20
III 35 ± 18 34 ± 10 20 ± 19
Presence of DCIS 0.100 0.404 0.338
Absent or focal 35 ± 24 34 ± 14 19 ± 21
Present 46 ± 21 30 ± 11 15 ± 18
Tumor size (cm) 0.317 0.446 0.296
< 2 45 ± 25 31 ± 12 16 ± 20
≥ 2 36 ± 20 34 ± 12 18 ± 20
LN status 0.897 0.230 0.927
Negative 41 ± 24 33 ± 12 18 ± 21
Positive 44 ± 18 36 ± 11 15 ± 15
LVI 0.875 0.087 0.875
Absent 43 ± 23 31 ± 12 17 ± 20
Present 42 ± 17 40 ± 9 16 ± 14
ER status 0.177 0.006 0.502
Negative 35 ± 15 44 ± 11 18 ± 19
Positive 44 ± 24 30 ± 12 17 ± 20
PR status 0.705 0.422 0.690
Negative 36 ± 19 35 ± 15 18 ± 17
Positive 44 ± 24 33 ± 11 16 ± 21
HER2 status 0.940 0.722 0.650
Negative 41 ± 22 33 ± 13 18 ± 18
Positive 45 ± 25 33 ± 11 14 ± 23
Ki-67 status 0.186 0.030 0.711
Low (< 14%) 47 ± 25 30 ± 12 16 ± 20
High (≥ 14%) 37 ± 19 35 ± 11 18 ± 19
= 0.928; 95% CI: 0.877, 0.982; p = 0.010), and both higher delayed-plateau component and angio-volume were associated with higher Ki-67 index (OR = 1.051; 95% CI:
1.011, 1.094; p = 0.013 for delayed-plateau component, OR
= 1.178; 95% CI: 1.023, 1.356; p = 0.023 for angio-volume) (Table 5).
DISCUSSION
In this study, the association of kinetic features acquired using CAD from 3T MRI with clinical-pathologic factors was demonstrated in 85 invasive breast cancer patients. We revealed that higher peak enhancement was associated with
higher histologic grade, larger angio-volume was associated with larger tumor size, higher delayed-plateau component was associated with negative ER status, and both higher delayed-plateau component and angio-volume were associated with higher Ki-67 index.
Increased peak enhancement has been considered indicative of aggressiveness, as highly vascularized cancers may reveal a higher uptake of contrast media due to angiogenesis (12, 19, 20). Indeed, increased peak enhancement has proven to be associated with poorer survival outcomes (7, 8). For the use of peak enhancement as a prognostic tool, it is necessary to understand the relationship with prognostic factors. According to two studies that used manually drawn region-of-interest (ROI) method at the most enhancing part of the tumor from 1T MRI (21, 22), peak enhancement was associated with histologic grade and LN metastasis. However, two other studies that used CAD or ROI method from 1.5T MRI revealed that peak enhancement did not show differences according to the two aforementioned factors (12, 23), but did show a correlation with ER status (12) or with tumor size (23). In our study, peak enhancement increased according to increased histologic grade, tumor size, and Ki- 67 index, but LN metastasis or ER status did not affect the peak enhancement. Considering that the three strongest prognostic factors in operable breast cancers are tumor size, histologic grade, and LN stage (24), our results can explain why peak enhancement differentiates patients with and without recurrence with a 0.728 of area under the receiver operating characteristic curve in a recent study (7). Moreover, in our binary logistic regression analysis,
Table 4. Results of Correlation Test of CAD-Assessed KineticFeatures and Clinical-Pathologic Prognostic Factors Kinetic Features Peak Enhancement
r* P
Histologic grade 0.355 0.001
Ki-67 index 0.330 0.002
Tumor size 0.231 0.033
Kinetic Features Angio-Volume
r* P
Histologic grade 0.410 0.005
Ki-67 index 0.341 < 0.001
Tumor size 0.505 < 0.001
Kinetic Features Early-Rapid Component
r* P
Ki-67 index 0.202 0.063
Kinetic Features Delayed-Plateau Component
r* P
Ki-67 index 0.255 0.019
*Spearman’s correlation coefficient (rho).
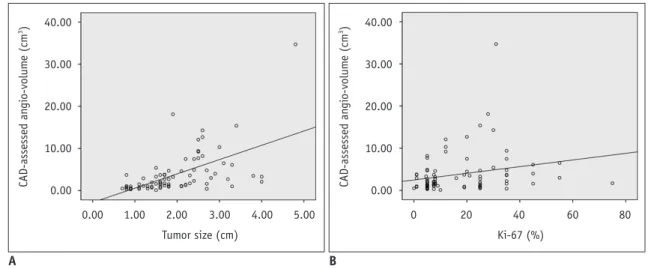
Fig. 4. Scatter plots of angio-volume according to tumor size and Ki-67 index.
A. Angio-volume was significantly correlated with tumor size (Spearman’s rho = 0.505, p < 0.001). B. Angio-volume was significantly correlated with Ki-67 index (Spearman’s rho = 0.341, p < 0.001).
0.00 1.00 2.00 3.00 4.00 5.00 Tumor size (cm)
40.00
30.00
20.00
10.00
3CAD-assessed angio-volume (cm) 0.00
A
0 20 40 60 80
Ki-67 (%) 40.00
30.00
20.00
10.00
3CAD-assessed angio-volume (cm) 0.00
B
higher peak enhancement was independently associated with higher histologic grade. Therefore, peak enhancement can be considered as a useful imaging biomarker reflecting histologic grade for estimating prognosis in breast cancer patients.
Angio-volume has been a known indicator for predicting response of NAC or for survival outcomes (8-10). Another important finding of our study was that larger angio-volume was correlated with larger tumor size and higher Ki-67 index. This result was consistent with the conclusion of a previous study that pathologic tumor size was associated with positivity of Ki-67 index (25). Accordingly, angio- volume which may reflect tumor size can be used as a measurement tool of Ki-67 index. However, it is also worth noting that angio-volume was not significantly associated with higher histologic grade, in spite of fair, positive correlation with histologic grade in correlation test. It might be explained by the peak enhancement, rather than angio-volume, having stronger influence on the histologic grade in regression analysis.
It has been generally known that malignant breast lesions show washout kinetics. However, in this study, there was no association between delayed-washout component and clinical-pathologic prognostic factors. Instead, delayed- plateau component showed correlations with ER status and Ki-67 index. Our result corroborates the previous study result that plateau voxel volume was a predictor of ER status (12).
In addition to ER status, higher delayed-plateau component was also associated with higher Ki-67 index. This result was different from the previous study which highlighted that washout curve may predict a higher level of Ki-67 index (23, 26). Previous studies used the representative qualitative kinetic curve shape rather than the absolute value from small ROI at maximally enhancing tumor (23, 26). However, it might have disregarded delayed-plateau component because most of breast tumors had both of delayed-washout or delayed-plateau component. In our study, 79 of 85 (92.9%) tumors had delayed-washout component and their representative kinetic curve shape was washout, regardless of percentages of delayed-plateau component. Therefore, we used quantitative voxel percentages of kinetic curve in a whole tumor, instead of a representative qualitative kinetic curve shape and our result can be used in the future analysis with reliability and reproducibility.
Ki-67 is a nuclear protein associated with cellular proliferation, which has attracted considerable interests as a prognostic marker. Among the 21 prospectively selected genes, Ki-67 is included in the Oncotype DX
TMassay (27, 28). In our study, most of kinetic features such as peak enhancement, angio-volume, and delayed- plateau component showed positive correlations with Ki- 67 index. This might be explicated by the co-expression of proliferation marker of Ki-67 with endothelial marker of nestin was contributed to microvessel proliferation, a novel
Table 5. Results of Binary Logistic Regression AnalysisFeatures β (SE*) Odds Ratio 95% CI P
Histologic grade†
Peak enhancement 0.004 (0.002) 1.004 1.001–1.008 0.024
Angio-volume 0.121 (0.075) 1.128 0.975–1.306 0.105
Tumor size‡
Peak enhancement 0.001 (0.002) 1.001 0.998–1.004 0.668
Angio-volume 0.325 (0.099) 1.384 1.141–1.679 0.001
ER status§
Angio-volume -0.002 (0.012) 0.998 0.975–1.022 0.892
Delayed-plateau component -0.074 (0.029) 0.928 0.877–0.982 0.010
Ki-67 indexǁ
Peak enhancement 0.001 (0.002) 1.001 0.997–1.004 0.720
Angio-volume 0.164 (0.072) 1.178 1.023–1.356 0.023
Early-rapid component 0.009 (0.009) 1.009 0.992–1.027 0.305
Delayed-plateau component 0.050 (0.020) 1.051 1.011–1.094 0.013
*Standard error of estimate, †Dependent variable was histological grade with grouping 1 and 2 vs. 3; independent variables were peak enhancement and angio-volume, ‡Dependent variable was tumor size with grouping < 2 cm vs. ≥ 2 cm; independent variables were peak enhancement and angio-volume, §Dependent variable was ER status grouping negative vs. positive; independent variables were angio- volume and delayed- plateau component, ǁDependent variable was Ki-67 with grouping < 14% vs. ≥ 14%; independent variables were peak enhancement, angio-volume, early-rapid component, and delayed-plateau component. CI = confidence interval
angiogenesis marker (29). Since tumor enhancement of DCE-MRI is based on angiogenesis (12), Ki-67 which seems to contribute to angiogenesis, may have an essential role in kinetic features of DCE-MRI.
Our study had limitations. First, kinetic features of DCE- MRI can vary depending on the different MR scanners, imaging protocols, and CAD software between different institutions (30-32). Compared to a previous study (12) that used 1.5T MRI with DynaCAD software, we used 3T MRI with CADstream software. Hence, despite the fact that our study result was based on the CAD-assessed semi- automatic evaluation to exclude inter-observer variability, our results can be different from those of previously reviewed literatures. Second, we did not follow patients.
Survival analyses with follow-up data are required to validate our results. Thirdly, our study’s small sample size might have some risk of over parameterization. Fourthly, menstrual cycle was not considered when DCE-MRI was acquired. Background parenchymal enhancement according to menstrual cycle might have affected CAD- assessed semi-automatic evaluation. Lastly, this was a retrospective study performed at a single tertiary academic institution with possibility of selection bias. Accordingly, prospective multicenter studies with larger sample sizes and follow-up data are warranted to validate prognostic value of kinetic features of breast MRI.
In conclusion, among the CAD-assessed preoperative breast MRI kinetic features, higher peak enhancement may correlate with higher histologic grade; larger angio- volume may correlate with larger tumor size; higher plateau component may correlate with negative ER status; and both higher plateau component and angio-volume may correlate with higher Ki-67 index. Further understanding about correlations between kinetic features and clinical- pathologic prognostic factors may help the use of imaging biomarkers acquired from preoperative breast DCE-MRI in the development of prognosis prediction model, thus enabling personalized treatment in breast cancer patients.
Conflicts of Interest
The authors have no potential conflicts of interest to disclose.
ORCID iDs Kyu Ran Cho
https://orcid.org/0000-0002-8936-6468
Sung Eun Song
https://orcid.org/0000-0002-9259-8294 Bo Kyoung Seo
https://orcid.org/0000-0002-9512-5361 Ok Hee Woo
https://orcid.org/0000-0003-3953-933X Seung Pil Jung
https://orcid.org/0000-0003-3967-2974 Deuk Jae Sung
https://orcid.org/0000-0002-5025-3052
REFERENCES
1. Folkman J. Tumor angiogenesis: therapeutic implications. N Engl J Med 1971;285:1182-1186
2. Schneider BP, Miller KD. Angiogenesis of breast cancer. J Clin Oncol 2005;23:1782-1790
3. Hylton N. Dynamic contrast-enhanced magnetic resonance imaging as an imaging biomarker. J Clin Oncol 2006;24:3293- 3298
4. Dorrius MD, Jansen-van der Weide MC, van Ooijen PM, Pijnappel RM, Oudkerk M. Computer-aided detection in breast MRI: a systematic review and meta-analysis. Eur Radiol 2011;21:1600-1608
5. Wood C. Computer aided detection (CAD) for breast MRI.
Technol Cancer Res Treat 2005;4:49-53
6. Hylton NM. Vascularity assessment of breast lesions with gadolinium-enhanced MR imaging. Magn Reson Imaging Clin N Am 1999;7:411-420
7. Kim JJ, Kim JY, Kang HJ, Shin JK, Kang T, Lee SW, et al.
Computer-aided diagnosis-generated kinetic features of breast cancer at preoperative MR imaging: association with disease- free survival of patients with primary operable invasive breast cancer. Radiology 2017;284:45-54
8. Dietzel M, Zoubi R, Vag T, Gajda M, Runnebaum IB, Kaiser WA, et al. Association between survival in patients with primary invasive breast cancer and computer aided MRI. J Magn Reson Imaging 2013;37:146-155
9. Kim H, Kim HH, Park JS, Shin HJ, Cha JH, Chae EY, et al.
Prediction of pathological complete response of breast cancer patients undergoing neoadjuvant chemotherapy: usefulness of breast MRI computer-aided detection. Br J Radiol 2014;87:20140142
10. Yi A, Cho N, Im SA, Chang JM, Kim SJ, Moon HG, et al.
Survival outcomes of breast cancer patients who receive neoadjuvant chemotherapy: association with dynamic contrast-enhanced MR imaging with computer-aided evaluation. Radiology 2013;268:662-672
11. Kim Y, Kim SH, Song BJ, Kang BJ, Yim KI, Lee A, et al. Early prediction of response to neoadjuvant chemotherapy using dynamic contrast-enhanced MRI and ultrasound in breast cancer. Korean J Radiol 2018;19:682-691
12. Baltzer PA, Vag T, Dietzel M, Beger S, Freiberg C, Gajda M, et al. Computer-aided interpretation of dynamic magnetic resonance imaging reflects histopathology of invasive breast cancer. Eur Radiol 2010;20:1563-1571
13. D’Orsi CJ, Sickles EA, Mendelson EB, Morris EA. ACR BI-RADS atlas, breast imaging reporting and data system. Reston, VA:
American College of Radiology, 2013
14. Lehman CD, Peacock S, DeMartini WB, Chen X. A new automated software system to evaluate breast MR examinations: improved specificity without decreased sensitivity. AJR Am J Roentgenol 2006;187:51-56 15. Levman JE, Causer P, Warner E, Martel AL. Effect of the
enhancement threshold on the computer-aided detection of breast cancer using MRI. Acad Radiol 2009;16:1064-1069 16. Elston CW, Ellis IO. Pathological prognostic factors in breast
cancer. I. The value of histological grade in breast cancer:
experience from a large study with long-term follow-up. C.
W. Elston & I. O. Ellis. Histopathology 1991;19:403-410.
Histopathology 2002;41(3A):151-152, discussion 152-153 17. Moeder CB, Giltnane JM, Harigopal M. Quantitative
justification of the change from 10% to 30% for human epidermal growth factor receptor 2 scoring in the American Society of Clinical Oncology/College of American Pathologists guidelines: tumor heterogeneity in breast cancer and its implications for tissue microarray based assessment of outcome. J Clin Oncol 2007;25:5418–5425
18. Goldhirsch A, Winer EP, Coates AS, Gelber RD, Piccart- Gebhart M, Thürlimann B, et al. Personalizing the treatment of women with early breast cancer: highlights of the St Gallen International Expert Consensus on the primary therapy of early breast cancer 2013. Ann Oncol 2013;24:2206-2223 19. Buadu LD, Murakami J, Murayama S, Hashiguchi N, Sakai
S, Masuda K, et al. Breast lesions: correlation of contrast medium enhancement patterns on MR images with histopathologic findings and tumor angiogenesis. Radiology 1996;200:639-649
20. Kuhl CK, Schild HH. Dynamic image interpretation of MRI of the breast. J Magn Reson Imaging 2000;12:965-974 21. Tuncbilek N, Karakas HM, Okten OO. Dynamic magnetic
resonance imaging in determining histopathological prognostic factors of invasive breast cancers. Eur J Radiol
2005;53:199-205
22. Mussurakis S, Buckley DL, Horsman A. Dynamic MR imaging of invasive breast cancer: correlation with tumour grade and other histological factors. Br J Radiol 1997;70:446-451 23. Lee SH, Cho N, Kim SJ, Cha JH, Cho KS, Ko ES, et al.
Correlation between high resolution dynamic MR features and prognostic factors in breast cancer. Korean J Radiol 2008;9:10-18
24. Rakha EA, El-Sayed ME, Lee AH, Elston CW, Grainge MJ, Hodi Z, et al. Prognostic significance of Nottingham histologic grade in invasive breast carcinoma. J Clin Oncol 2008;26:3153-3158 25. González-Sistal A, Sánchez AB, Del Rio MC, Arias JI,
Herranz M, Ruibal A. Association between tumor size and immunohistochemical expression of Ki-67, p53 and BCL2 in a node-negative breast cancer population selected from a breast cancer screening program. Anticancer Res 2014;34:269-273 26. Szabó BK, Aspelin P, Kristoffersen Wiberg M, Tot T, Boné B.
Invasive breast cancer: correlation of dynamic MR features with prognostic factors. Eur Radiol 2003;13:2425-2435 27. Paik S, Tang G, Shak S, Kim C, Baker J, Kim W, et al. Gene
expression and benefit of chemotherapy in women with node- negative, estrogen receptor-positive breast cancer. J Clin Oncol 2006;24:3726-3734
28. Paik S, Shak S, Tang G, Kim C, Baker J, Cronin M, et al. A multigene assay to predict recurrence of tamoxifen-treated, node-negative breast cancer. N Engl J Med 2004;351:2817- 2826
29. Krüger K, Stefansson IM, Collett K, Arnes JB, Aas T, Akslen LA. Microvessel proliferation by co-expression of endothelial nestin and Ki-67 is associated with a basal-like phenotype and aggressive features in breast cancer. Breast 2013;22:282-288 30. Pabst T, Kenn W, Kaiser WA, Hahn D. Understanding why
contrast enhancement in dynamic MRI is not reproducible:
illustration with a simple phantom. Breast J 2001;7:166-170 31. Seo M, Ryu JK, Jahng GH, Sohn YM, Rhee SJ, Oh JH, et al.
Estimation of T2* relaxation time of breast cancer: correlation with clinical, imaging and pathological features. Korean J Radiol 2017;18:238-248
32. Chen SQ, Huang M, Shen YY, Liu CL, Xu CX. Abbreviated MRI protocols for detecting breast cancer in women with dense breasts. Korean J Radiol 2017;18:470-475