territories of Vilnius city. Concentrations of heavy metals were measured using Thermo Fisher Scientific Niton® XL2 X-ray fluorescence spectrometer. Maximum allowable and background concentrations that are given in Lithuanian hygiene standard and Lithuania geochemical atlas are used to compare and evaluate concentrations of heavy metals. Concentrations of heavy metals and their spatial distribution were analysed in order to exclude the most contaminated areas relating with different functional areas of the city. Geo-statistical analysis and maps of spatial distribution were developed using IDW interpolator in ArcMap software. Detail soil surveys helps to assess the extent of anthropogenic impact in different parts of the city which can be harmful to the soil ecosystem and human health. Such researches can help to change or select different function for city areas in territorial planning process.
Key words : Heavy metals, Soil contamination, Kindergartens, Spatial distribution, X-ray fluorescence spectrometer
1. Introduction 1)
High concentration of human activities which is typical to cities leads to the formation of anthropogenic urban landscape (Baubinas et al., 2003). Eventually cities fill with densely urbanized areas where com -ponents of the environment get high load of pollution. One of the most important components of the living environment is the soil. It is a physical basis for settlements and is a result of a dynamic human activity (Davidson et al., 2006; Miguel et al., 1999).
Common changes and different use of urban areas leads to the inclusion of different physical and chemical substances from a variety of sources
(Davidson H. et al., 2006). High amounts of chemical elements exceeding background levels are constantly released from transport and industrial objects which are dispersed into the environment through air and various types of waste (Taraskevicius, 2011). Soil in urbanized territories is technogenically affected due to the constant pollution therefore it loses charac -teristics of a natural soil and eventually becomes a depositing medium, which accumulates a variety of pollutants (Taraskevicius, 2003). Due to all of these processes in general, each city occurs as a characteristic and specific geochemical sub-region (Taraskevicius and Zinkute, 2011).
Most of the pollution sources concentrate in cities and also these areas are densely populated. For this
Received 9 November, 2015; Revised 9 November, 2015;
Accepted 16 November, 2015
*
Corresponding author : Vaidotas Valskys, Ecology and Environment Center, Vilnius University, Vilnius, Ciurlionis st. 21/27, Lithuania Phone: +370-6700-3460
E-mail: [email protected]
ⓒ The Korean Environmental Sciences Society. All rights reserved.
This is an Open-Access article distributed under the terms of the Creative Commons Attribution Non-Commercial License (http://
creativecommons.org/licenses/by-nc/3.0) which permits unrestricted
non-commercial use, distribution, and reproduction in any medium,
provided the original work is properly cited.
reason human health is closely linked to the urban environment soil quality (Davidson et al., 2006;
Morais et al., 2012). Results of researches of foreign and Lithuanian scientists show that surface layer of soil in urban and suburban areas are often enriched with heavy metals (Taraskevicius, 2011; Siu et al., 2006). The group of heavy metals have a negative impact on environment and is particularly dangerous to human especially children (Jarup, 2003; Dulskiene, 2003).
Results of studies of heavy metals (Pb, Cu, Zn, Ca) in contaminated areas of Lithuania showed that morbidity of adults and adolescent is 1.4-1.5 times higher and morbidity of children younger than 14 years 1.5-3.9 times higher than average morbidity of children with the same disease in uncontaminated regions of Lithuania (Juozulynas et al., 2008).
In order to prevent possible health problems concentrations of hazardous substances are restricted by hygiene standards. Soil contamination by chemicals (including heavy metals) is regulated by HN:60 (hygiene norm) in Lithuania and synergistic effects of elements is expressed as a total contamination index Z
d(Lithuanian hygiene standard HN 60:2004).
In cities where the architecture is dominated by apartment buildings children most of their free time spend playing in outdoor playgrounds. It is clear that most urban soils tend to accumulate a variety of contaminants including heavy metals and is recog -nized that ingestion of contaminated soil has an important impact on health of children recently safety of playgrounds has taken an interest (Bordajandi et al., 2004; Hemond, 2004; Zagury, 2005).
Contamination studies of playgrounds of children often reveals that more than one third (Bergen, Norway - 45%, Zagreb, Croatia - 30%) of playgrounds do not meet the hygienic and other environmental requirements therefore pose a threat to health of children ( Ottesen et al., 2008; Miko et al., 2009).
In order to select territories for cleaning and to
provide a framework for future permanent condition monitoring the investigation of soil and ground was started in Vilnius 2006-2007. Kindergartens as one of the least affected by contamination incidents were included in mentioned investigation for the first time in 2008 (Taraskevicius R., 2008).
Fifty samples for heavy metals and petroleum products analysis were taken from kindergartens, 8 different Vilnius city territories. The results of geo-hygienic evaluation revealed that soils form 36%
(18) of kindergartens do not meet hygiene standards and were attributed to moderate hazard level. In terms of the total contamination index Z
d42% (21) of investigated soils of kindergartens were not attributed to the category of permissible contamination (exceeded the allowable limit for total contamination index Z
d>16) (Taraskevicius R., 2008).
Commonly Zn, Pb, Ag, Cu and Sn concentrations are exceeding maximum allowable concentrations in soil of Vilnius kindergartens. The most polluted areas are mainly located on the former industrial territory as well as near major highways and railways (Taraskevicius R., 2008, 2010).
Despite the investigation of soil pollution that was started in Vilnius kindergartens this area of research is insufficiently examined. A small part of kinder -gartens soil has been investigated for this time which are mainly in the central part of city and such research is carried out only once in a few years.
There is a lack of reliable information on soil quality and safety of kindergartens in different sub-districts of Vilnius.
The aim of this work was to analyse and evaluate soil contamination by heavy metals in playgrounds of kindergartens in different territories of Vilnius city.
2. Materials and methods
Research was carried out in forty kindergartens in
Vilnius city (from 2014-10-17 to 2014-11-07). Forty
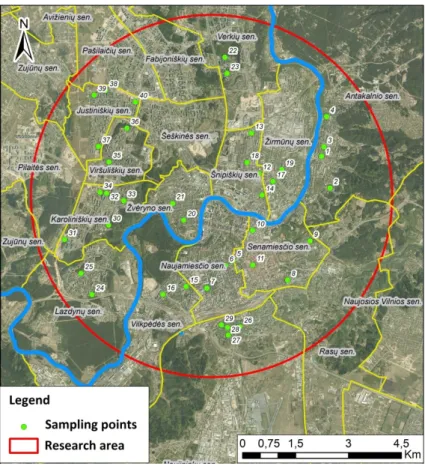
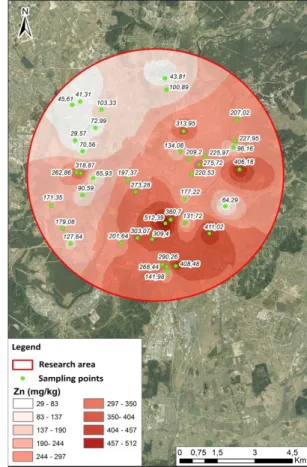
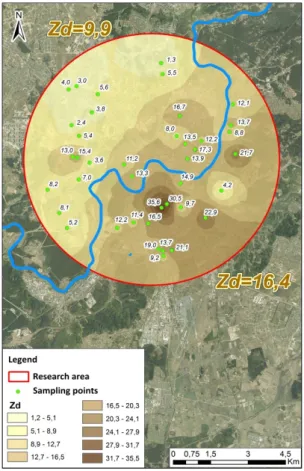
Fig. 1. Sampling points in Vilnius city 2014.
soil samples were taken from playgrounds of kinder -gartens that are located in 13 districts of Vilnius (Fig. 1.).
Previously conducted studies formed the basis of this study and selection of sampling points. 18 kindergartens were selected from studies that were carried out in 2009 and 22 kindergartens from 6 districts that were not investigated previously.
Coordinates of sampling points and geometric centres of plots of kindergartens were calculated using the ArcMap software. The distribution of kindergartens in districts of Vilnius city is given in Fig. 1.
2.1. Sampling
Soil samples were taken from the whole territory of playgrounds of kindergartens. Every 10-15 meters
(depending on the area of playgrounds of kinder -gartens) pre-samples from the surface soil layer using stainless unpainted steel trowel were taken using principle of “envelope” and placed in the clear plastic bucket (for food use). 6-7 pre-samples taken from playground of kindergarten were then homo -genized mixing the overall content of samples for 10-15 minutes.
300 grams of homogenized sample was taken from different places of bucket and was placed in plastic bag. The sample is recorded indicating sampling location sample number and other relevant information.
All sampling equipment is thoroughly cleaned in order to avoid cross-contamination.
Potential pollution sources in the playground of
kindergartens were taken into account during the collection of samples. The most common potential pollution sources were streets, roads and parking lots also painted components in playgrounds of kinder -gartens like swings, benches, arbour and other equipment.
Soil samples were taken in accordance with the Lithuanian hygiene standard HN 60:2004 “Maximum allowable concentrations of dangerous substances in soil” and Requirements for eco-geological research (Regulation for eco-geological research, 2008).
2.2. Preparation of samples
Samples were transported to the laboratory, placed in “petri” dishes and dried in a drying oven for 9 hours at 110o C to the constant weight. Dry samples were grinded in porcelain mortar until homogenous mass. Obtained mass was filtered through three-chamber sieves - 2.00 mm, 250 µm and 125 µm. Filtrate was placed in special caps which were put into the X-ray fluorescence spectrometer. Samples were analysed using Thermo Scientific Niton XL2 Series X-ray fluorescence spectrometer. 28 elements can be detected using this type of fluorescence spectrometer (As, Hg, Cd, Ba, Sb, Sn, Ag, Pd, Zr, Sr, Rb, Pb, Se, Au, Zn, W, Cu, Ni, Co, Fe, Mn, Cr, V, Ti, Sc, Ca, K, S). The further analysis of the results was performed for those metals that are potentially anthropogenic and indicating certain human activity impact on the soil ecosystem.
The total relative analytical error was 5%.
2.3. Calculation of contamination coefficient (K
0) and total contamination index (Z
d)
Contamination coefficient (K
0) is calculated using the concentration of chemical element in soil with the maximum allowable concentration:
(1) C Concentration of chemical element detected in
the sample (mg/kg);
MAC Maximum allowable concentration in soil (mg/kg).
According to the results degree of hazard is determined: <1 - permissible, 1-3 - moderate hazard, 3-10 - hazardous, >10 - particularly hazardous.
Z
dindex is used when soil is contaminated with several substances or chemical elements (Lithuanian hygiene standard 60:2004). Total contamination index (Z
d) is calculated according to the formula:
(2) n The number of chemical elements;
K
KThe concentration coefficient of chemical element:
(3) C Concentration of chemical element detected in
the sample (mg/kg);
C
fBackground concentration of the chemical element (mg/kg);
*