한국표면공학회지 J. Korean Inst. Surf. Eng.
Vol. 49, No. 6, 2016.
https://doi.org/10.5695/JKISE.2016.49.6.507
<연구논문>
ISSN 1225-8024(Print) ISSN 2288-8403(Online)
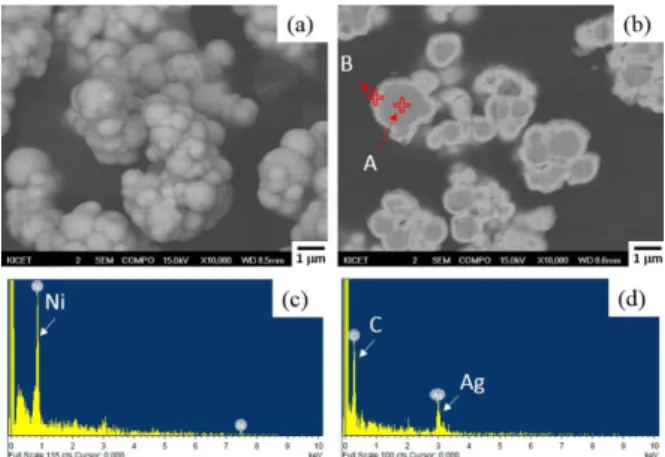
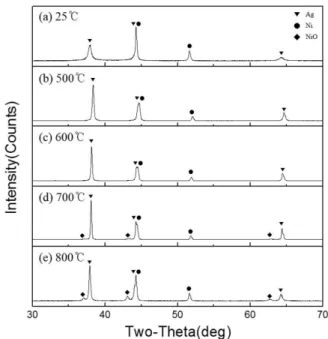
Sintering Behavior of Ag-Ni Electrode Powder with Core-shell Structure
Kyung Ho Kim
a, Jun-Mo Koo
a, Sung-Soo Ryu
a, Sang Hun Yoon
b, Yoon Soo Han
a,*a
Engineering Ceramic Center, Korea Institute of Ceramic Engineering and Technology , Icheon, 17303, Korea
b
![Fig. 8. Phase diagram of Ag-Ni alloy system [14].](https://thumb-ap.123doks.com/thumbv2/123dokinfo/5301576.379286/4.892.92.423.135.473/fig-phase-diagram-ag-ni-alloy.webp)

