Association between body mass index and 1-year outcome after acute myocardial infarction
Dae-Won Kim1, Sung-Ho HerID1*, Ha Wook Park1, Mahn-Won Park1, Kiyuk Chang2, Wook Sung Chung2, Ki Bae Seung2, Tae Hoon Ahn3, Myung Ho Jeong4, Seung-Woon Rha5, Hyo- Soo Kim6, Hyeon Cheol Gwon7, In Whan Seong8, Kyung Kuk Hwang9, Shung
Chull Chae10, Kwon-Bae Kim11, Young Jo Kim12, Kwang Soo Cha13, Seok Kyu Oh14, Jei Keon Chae15, on behalf of KAMIR-NIH registry investigators
1 The Catholic University of Korea, Daejeon St. Mary’s Hospital, Seoul, Republic of Korea, 2 The Catholic University of Korea, Seoul St. Mary’s Hospital, Seoul, Republic of Korea, 3 Gachon University, Gil Medical Center, Incheon, Republic of Korea, 4 Chonnam National University Hospital, Gwangju, Republic of Korea, 5 Korea University, Guro Hospital, Seoul, Republic of Korea, 6 Seoul National University Hospital, Seoul, Republic of Korea, 7 Sungkyunkwan Universtiy, Samsung Medical Center, Seoul, Republic of Korea, 8 Chungnam National University Hospital, Daejeon, Republic of Korea, 9 Chungbuk National University Hospital, Cheongju, Republic of Korea, 10 Kyungpook National University Hospital, Daegu, Republic of Korea, 11 Keimyung University Dongsan Medical Center, Daegu, Republic of Korea, 12 Yeungnam University Hospital, Daegu, Republic of Korea, 13 Pusan National University Hospital, Busan, Republic of Korea, 14 Wonkwang University Hospital, Iksan, Republic of Korea, 15 Chonbuk National University Hospital, Jeonju, Republic of Korea
¶ Complete membership of the author group can be found in the Acknowledgments.
Abstract
Objectives
Beneficial effects of overweight and obesity on mortality after acute myocardial infarction (AMI) have been described as “Body Mass Index (BMI) paradox”. However, the effects of BMI is still on debate. We analyzed the association between BMI and 1-year clinical out- comes after AMI.
Methods
Among 13,104 AMI patients registered in Korea Acute Myocardial Infarction Registry- National Institute of Health (KAMIR-NIH) between November 2011 and December 2015, 10,568 patients who eligible for this study were classified into 3 groups according to BMI (Group 1;<22 kg/m2, 22�Group 2<26 kg/m2, Group 3;�26 kg/m2). The primary end point was all cause death at 1 year.
Results
Over the median follow-up of 12 months, the event of primary end point occurred more fre- quently in the Group 1 patients than in the Group 3 patients (primary endpoint: adjusted haz- ard ratio [aHR], 1.537; 95% confidence interval [CI] 1.177 to 2.007, p = 0.002). Especially, a1111111111
a1111111111 a1111111111 a1111111111 a1111111111
OPEN ACCESS
Citation: Kim D-W, Her S-H, Park HW, Park M-W, Chang K, Chung WS, et al. (2019) Association between body mass index and 1-year outcome after acute myocardial infarction. PLoS ONE 14(6):
e0217525.https://doi.org/10.1371/journal.
pone.0217525
Editor: Chiara Lazzeri, Azienda Ospedaliero Universitaria Careggi, ITALY
Received: February 18, 2019 Accepted: May 12, 2019 Published: June 14, 2019
Copyright:© 2019 Kim et al. This is an open access article distributed under the terms of the Creative Commons Attribution License, which permits unrestricted use, distribution, and reproduction in any medium, provided the original author and source are credited.
Data Availability Statement: The present study analyzed the KAMIR-NIH data in South Korea. The data are accessible to any researchers after permission of the Disease Control and Prevention and the Korea Health Technology R & D Project, Ministry of Health & Welfare (NIH URLhttp://icreat.
nih.go.kr).
Funding: This study was supported by a fund (2016-ER6304-01) from Research of Korea Centers for Disease Control and Prevention and the
cardiac death played a major role in this effect (aHR, 1.548; 95% confidence interval [CI]
1.128 to 2.124, p = 0.007).
Conclusions
Higher BMI appeared to be good prognostic factor on 1-year all cause death after AMI. This result suggests that higher BMI or obesity might confer a protective advantage over the life- quality after AMI.
Introduction
The prevalence and socio-economic influence of obesity are dramatically increasing over the globe. In general, obesity is well known to be related to aggravated cardiovascular disease [1–
6]. However, several studies showed restrictive impacts on cardiovascular outcomes in patients undergoing percutaneous coronary intervention (PCI) [7–9]. Clinical effects of body mass index (BMI) after PCI in acute myocardial infarction (AMI) are still controversial. Some previ- ous reports revealed that obesity paradox was observed but not reached to the significant dif- ference after the multivariate analysis [10,11], whereas other studies showed that obese patients with AMI had an improved prognosis after primary PCI [9,12,13]. Therefore, the aim of the present study ought to evaluate the clinical outcome in patients with AMI undergo- ing PCI in accordance with weight status.
Methods
Study design and population
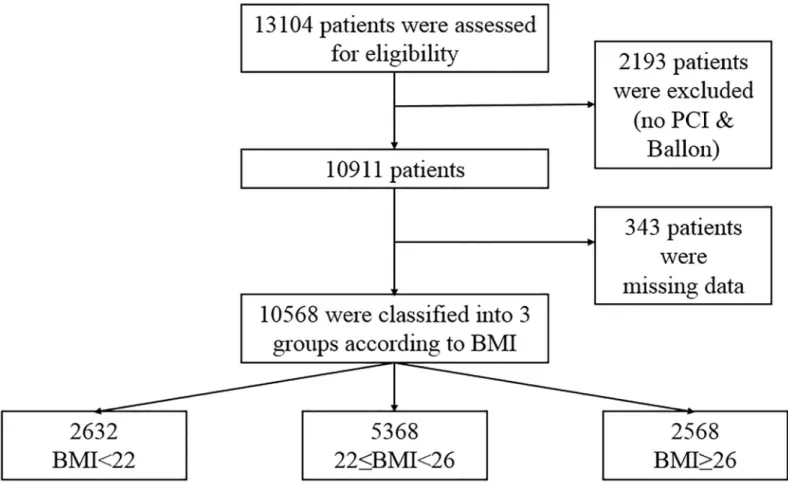
Fig 1is a flow chart of this study. We consecutively enrolled 13,104 patients with AMI who had successful PCI from the database of the Korea Acute Myocardial Infarction Registry–
National Institutes of Health (KAMIR-NIH). The KAMIR-NIH is a prospective, multicenter, web-based observational cohort study to develop the prognostic and surveillance index of Korean patients with AMI from 15 centers in Korea and was supported by a grant of Korea Centers for Disease Control and Prevention from May 2010 to June 2015. Among them, 2,193 patients who did not undergo PCI or PTCA and 343 patients with missing data were excluded.
The remaining 10,568 patients were divided into three groups according to the BMI.
All participated centers are high-volume centers for coronary angiography with PCI and have used the same study protocol. This study was approved by the institutional review board (IRB) of each participating institution (IRB of the Catholic University of Korea, Daejeon, St. Mary’s hospital, IRB of the Catholic University of Korea, Seoul, St. Mary’s hospital, Gachon Gil Medical Center, IRB of Chonnam National University, Korea University Guro IVD Sup- port Center, Seoul National University Hospital Biomedical Research Institute, Samsung Med- ical Center Clinical Trial Center, IRB of Chungnam National University Hospital, IRB of Chungbuk National University Hospital, IRB of Kyungpook National University Hospital, Clinical Trial Center of Keimyung University Dongsan Medical Center, Clinical Trial Center for Medical Devices of Yeungnam University Hospital, Clinical Trial Center of Pusan National University Hospital, IRB of Wonkwang University Hospital and IRB of Chonbuk National University Hospital) and was conducted according to the Declaration of Helsinki with pa- tients’ written informed consent. Trained study coordinators at each participating institution
Korea Health Technology R & D Project, Ministry of Health & Welfare (HI13C1527), Republic of Korea.
Competing interests: The authors have declared that no competing interests exist.
Abbreviations: CAD, coronary artery disease; DM, diabetes mellitus; BMI, body mass index; AMI, acute myocardial infarction; PCI, percutaneous coronary intervention; DES, drug-eluting stents;
HR, hazard ratio; CI, confidence interval; CKD, chronic kidney disease; proBNP, pro B-type natriuretic peptide; Hb, hemoglobin; GpIIb/IIIa inhibitor, glycoprotein GpIIb/IIIa inhibitor; LVEF, left ventricular ejection fraction; ACE inhibitor, angiotensin-converting enzyme inhibitor; ARB, angiotensin II receptor blocker.
collected the data using a standardized format. Standardized definitions of all variables were determined by steering committee board of KAMIR-NIH.
Percutaneous coronary intervention procedure and medical treatment
PCI for AMI was performed according to the standard practical guidelines, as previously described [14]. The application of predilatation, postdilatation and the selection of a specific type of implanted stent were at the discretion of the operator. Antiplatelet therapy and admin- istration of periprocedural anticoagulation were carried out in accordance with the standard regimens. Aspirin (loading dose, 200mg) plus clopidogrel (loading dose, 300 or 600 mg) or ticagrelor (loading dose 180mg) or prasugrel (loading dose 60mg) were prescribed for all patient before or during PCI. After the procedure, aspirin (100-200mg/day) was maintained indefinitely. Patients with drug-eluting stents were prescribed clopidogrel (75mg/day), ticagre- lor (90mg twice/day), prasugrel (10mg/day) for at least 12 months. Other cardiac medications were administered at the discretion of treating physicians.Definitions and study end-points
The diagnosis of AMI was based on detection of a raise and/or fall of cardiac biomarker (creat- inine kinase-MB and troponin I or T) with at least one value above the 99th percentile upper reference limit and with at least one of the following: symptoms of ischemia, new or presumed new significant ST segment T wave changes or new left bundle branch block, development of
Fig 1. Overview of the study population. BMI = body mass index; PCI = percutaneous coronary intervention.
https://doi.org/10.1371/journal.pone.0217525.g001
pathological Q waves in the ECG, and imaging evidence of new loss of viable myocardium or new regional wall motion abnormality [15].
BMI was calculated at baseline by dividing the patient’s measured weight (in kg) by the square of the height (in m). The patients were divided into 3 groups stratified by BMI into quartiles: < 22 kg/m2(Group 1), 22 to < 26 kg/m2(Group 2), and � 26 kg/m2(Group 3) with supplementary grouping (Group 4: BMI � 26 < 30 kg/m2) & (Group 5: BMI �30 kg/m2) for additional analysis. The glomerular filtration rate was calculated according to the abbreviated Modification of Diet and Renal Disease Study formula [16]. Chronic kidney disease (CKD) was defined as a glomerular filtration on admission of < 60ml/min per 1.73m2[16]. Diabetes mellitus was defined as a fasting glucose concentration of � 7.0 mmol/L, a blood glucose con- centration of � 11.0 mmol/L on a 75g, 2hr oral glucose tolerance test, or the use of antidiabetic therapy. Hypertension was defined as a history of a systolic blood pressure of � 140mmHg, a diastolic pressure of � 90mmHg, or the use of antihypertensive therapy. Hyperlipidemia was defined as a fasting total cholesterol concentration of � 220mg/dL, a fasting triglyceride con- centration of � 150mg/dL, or the use of antihyperlipidemic therapy.
The primary outcome was an all cause death at 1 year. All deaths were considered as cardiac unless an unequivocal noncardiac cause could be established. Meanwhile, cardiac death (CD) was defined as any death due to a proximate cardiac cause such as myocardial infarction (MI), low-output failure, arrhythmia, unwitnessed death and all procedure-related deaths, including those related to conconmittant treatment [17]. MI was defined as newly developed Q wave, raised myocardial muscle creatinine kinase (CK-MB), Tn-I or T above the normal ranges, typi- cal ischemic symptom accompanied with ST elevation. Target vessel revascularization (TVR) was defined as percutaneous or surgical revascularization of the stented lesion including 5mm margin segments and more proximal or distal, newly developed lesion. Also, cerebrovascular events were defined as a stroke or cerebrovascular accident with loss of neurological function caused by an ischemic or hemorrhagic event with residual symptoms at least 24 hours after onset or leading to death.
The other clinical outcome was heart failure, stent thrombosis and Thrombolysis in Myocar- dial Infarction (TIMI) minor bleeding [18] at 1 year. Heart failure was defined as sudden wors- ening of the signs and symptoms of heart failure, which was measured as an ejection fraction of less than 40% during follow-up. Stent thrombosis was evaluated according to the Academic Research Consortium Definitions [19]. TIMI minor bleeding was defined as overt clinical bleeding associated with a fall in hemoglobin of 3 to less than or equal to 5 g/dL (0.5 g/L) or in hematocrit of 9% to less than or equal to 15% (absolute). All adverse events were confirmed through the source documents, including medical records and telephone interviews, and were also adjudicated by the Steering Committee of Chonnam National University Hospital.
Statistical analyses
Continuous variables were expressed as mean± standard deviation, median (interquartile range) if strong positive skewness and categorical variables were presented as frequencies and percentage. Comparisons among the groups were calculated with an analysis of variance (ANOVA) and Kruskal-Wallis test for continuous variables and Pearson’s chi-square test for categorical variables. Also, post-hoc test was done with Bonferroni test. The incidences of the primary endpoints in the BMI groups were estimated at 12 month and were displayed in tables and Kaplan-Meier curves. The log-rank test was performed to compare the incidences of the endpoints between the 3 groups.
Meanwhile, Cox proportional hazard model was used to estimate the hazard ratio (HR) with 95% confidence interval (CI) for the statistical influence of low BMI after PCI on the
clinical events. All of the variables in Tables1&2were included and analyzed to perform uni- variate analysis. The proportional hazard assumption was checked for all screened covariates, and no relevant violations were found. On the basis of the variables that were significant (P < 0.05) according to univariate analysis, a multivariate Cox proportional hazard model was constructed. Also, multivariable logistic regression analyses were carried out to identify inde- pendent predictors for overall mortality and on the basis of the variables that were significant (P < 0.05) according to univariable logistic regression analysis, a multivariable logistic regres- sion model was performed. And, the consistency of treatment effects in subgroups was assessed with the use of Cox regression models with tests for interaction. P values <0.05 were considered as statistically significant. All statistical analyses were performed using a Statistical Analysis Software (SAS, version 9.2, SAS Institute, Cary, NC, USA).
Results
Baseline characteristics of study population
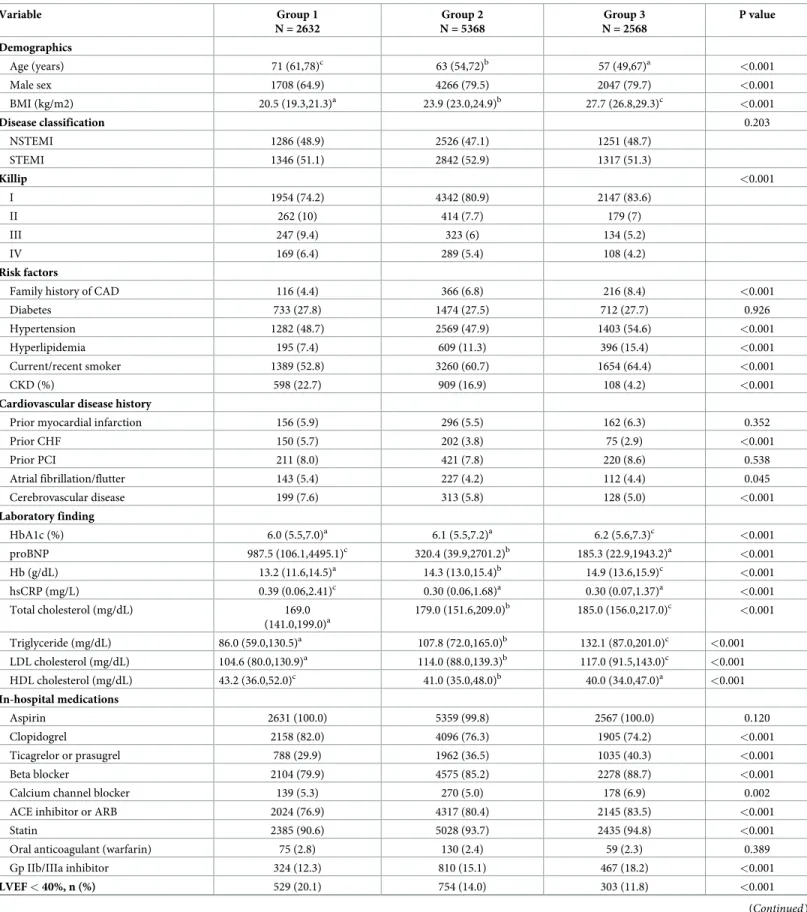
Baseline demographic, clinical and laboratory characteristics are presented according to the weight status (Table 1). Patients were classified into 3 groups according to the quartile: Group 1 (n = 2632, 24.9% of total subjects, BMI < 22 kg/m2), Group 2 (n = 5368, 50.8% of total sub- jects), Group 3 (n = 2568, 24.3% of total subjects). The population distributions for age, sex, Killip classification, family history of CAD, hypertension, hyperlipidemia, current/recent smoker, CKD, prior congestive heart failure (CHF), atrial fibrillation/flutter, cerebrovascular disease, HbA1c, proBNP, hemoglobin (Hb), hsCRP, lipid profile, the use of antiplatelet agents, beta blocker, calcium channel blocker, statin, glycoprotein (Gp) IIb/IIIa inhibitor and left ven- tricular ejection fraction (LVEF) significantly differed among the three groups. Group 1 was the oldest and Group 3 was the youngest. The proportion of male was the lowest in Group 1 and Group 1 showed higher incidences of aggravated heart failure indicating relatively higher proportion of killip classification of III and IV as well as pro-brain natriuretic peptide
(proBNP) and LVEF < 40%. However, regarding risk factors, several factors such as CAD his- tory, hypertension, hyperlipidemia and smoking history were significantly higher in Group 3 than those in Group 1 & 2, whereas CKD, prior CHF, atrial fibrillation/flutter and cerebrovas- cular disease in Group 2 were significantly higher than those in the other groups. Also, Hb in Group 1 was the lowest and hsCRP in the Group 1 was the highest among the groups. Mean- while, although Group 3 showed significantly worse lipid profiles than other groups, the pro- portions of medications such as strong antiplatelet agents (ticagrelor or prasugrel), beta blocker, angiotensin-converting enzyme inhibitor (ACE inhibitor) or angiotensin II receptor blocker (ARB), statin and Gp IIb/IIIa inhibitor were relatively higher in Group 3 than in the other groups. There were no significant statistical differences between the three groups in other characteristics (Table 1).
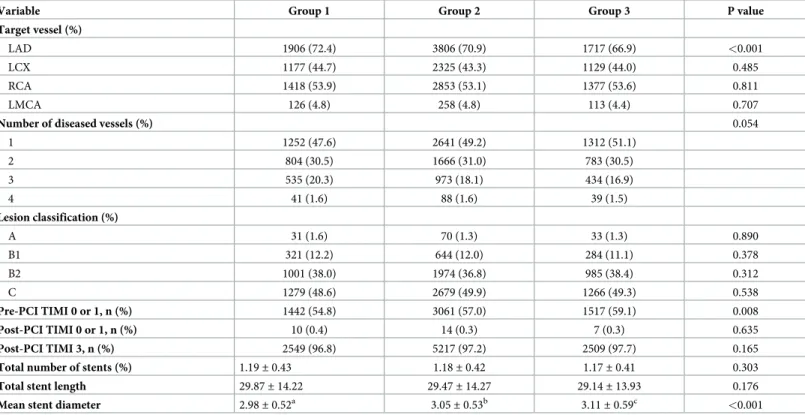
The angiographic characteristics of Group 1 showed relatively higher proportion of LAD among target vessels and higher rates in the number of disease vessels. In addition, the mean stent diameter in Group 1 was the smallest among the groups, while there were no significant differences in the total number of stents and stent lengths among the groups (Table 2).
Clinical outcomes of the study population
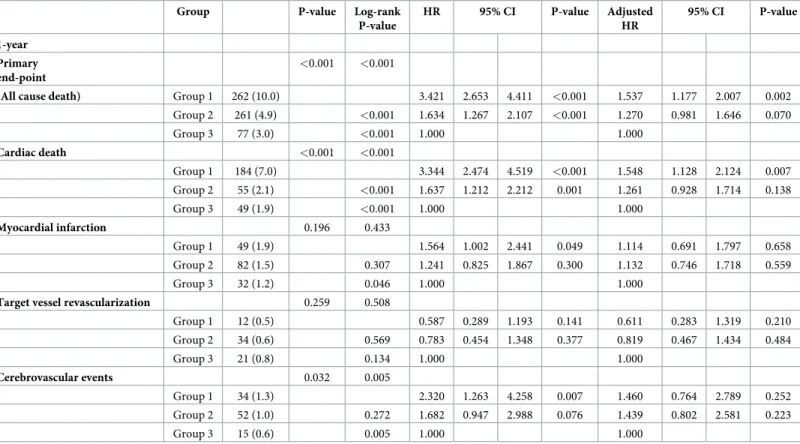
The median follow-up duration was 12 month. Among the AMI patients undergoing PCI, classified by BMI, the cumulative rate of primary outcome for all cause death was significantly higher in the low BMI group (BMI < 22 kg/m2) than in the high BMI group (BMI � 26 kg/
m2) at 12 month (262 [10.0%] vs. 77 [3.0%], P<0.001,Table 3). Multivariate Cox regression analysis revealed that low BMI in AMI patients undergoing PCI is a predictor for these events
Table 1. Baseline demographic, clinical and laboratory characteristics in patients with MI undergoing primary PCI stratified by BMI.
Variable Group 1
N = 2632
Group 2 N = 5368
Group 3 N = 2568
P value
Demographics
Age (years) 71 (61,78)c 63 (54,72)b 57 (49,67)a <0.001
Male sex 1708 (64.9) 4266 (79.5) 2047 (79.7) <0.001
BMI (kg/m2) 20.5 (19.3,21.3)a 23.9 (23.0,24.9)b 27.7 (26.8,29.3)c <0.001
Disease classification 0.203
NSTEMI 1286 (48.9) 2526 (47.1) 1251 (48.7)
STEMI 1346 (51.1) 2842 (52.9) 1317 (51.3)
Killip <0.001
I 1954 (74.2) 4342 (80.9) 2147 (83.6)
II 262 (10) 414 (7.7) 179 (7)
III 247 (9.4) 323 (6) 134 (5.2)
IV 169 (6.4) 289 (5.4) 108 (4.2)
Risk factors
Family history of CAD 116 (4.4) 366 (6.8) 216 (8.4) <0.001
Diabetes 733 (27.8) 1474 (27.5) 712 (27.7) 0.926
Hypertension 1282 (48.7) 2569 (47.9) 1403 (54.6) <0.001
Hyperlipidemia 195 (7.4) 609 (11.3) 396 (15.4) <0.001
Current/recent smoker 1389 (52.8) 3260 (60.7) 1654 (64.4) <0.001
CKD (%) 598 (22.7) 909 (16.9) 108 (4.2) <0.001
Cardiovascular disease history
Prior myocardial infarction 156 (5.9) 296 (5.5) 162 (6.3) 0.352
Prior CHF 150 (5.7) 202 (3.8) 75 (2.9) <0.001
Prior PCI 211 (8.0) 421 (7.8) 220 (8.6) 0.538
Atrial fibrillation/flutter 143 (5.4) 227 (4.2) 112 (4.4) 0.045
Cerebrovascular disease 199 (7.6) 313 (5.8) 128 (5.0) <0.001
Laboratory finding
HbA1c (%) 6.0 (5.5,7.0)a 6.1 (5.5,7.2)a 6.2 (5.6,7.3)c <0.001
proBNP 987.5 (106.1,4495.1)c 320.4 (39.9,2701.2)b 185.3 (22.9,1943.2)a <0.001
Hb (g/dL) 13.2 (11.6,14.5)a 14.3 (13.0,15.4)b 14.9 (13.6,15.9)c <0.001
hsCRP (mg/L) 0.39 (0.06,2.41)c 0.30 (0.06,1.68)a 0.30 (0.07,1.37)a <0.001
Total cholesterol (mg/dL) 169.0
(141.0,199.0)a
179.0 (151.6,209.0)b 185.0 (156.0,217.0)c <0.001
Triglyceride (mg/dL) 86.0 (59.0,130.5)a 107.8 (72.0,165.0)b 132.1 (87.0,201.0)c <0.001
LDL cholesterol (mg/dL) 104.6 (80.0,130.9)a 114.0 (88.0,139.3)b 117.0 (91.5,143.0)c <0.001
HDL cholesterol (mg/dL) 43.2 (36.0,52.0)c 41.0 (35.0,48.0)b 40.0 (34.0,47.0)a <0.001
In-hospital medications
Aspirin 2631 (100.0) 5359 (99.8) 2567 (100.0) 0.120
Clopidogrel 2158 (82.0) 4096 (76.3) 1905 (74.2) <0.001
Ticagrelor or prasugrel 788 (29.9) 1962 (36.5) 1035 (40.3) <0.001
Beta blocker 2104 (79.9) 4575 (85.2) 2278 (88.7) <0.001
Calcium channel blocker 139 (5.3) 270 (5.0) 178 (6.9) 0.002
ACE inhibitor or ARB 2024 (76.9) 4317 (80.4) 2145 (83.5) <0.001
Statin 2385 (90.6) 5028 (93.7) 2435 (94.8) <0.001
Oral anticoagulant (warfarin) 75 (2.8) 130 (2.4) 59 (2.3) 0.389
Gp IIb/IIIa inhibitor 324 (12.3) 810 (15.1) 467 (18.2) <0.001
LVEF < 40%, n (%) 529 (20.1) 754 (14.0) 303 (11.8) <0.001
(Continued )
(primary outcome, aHR 1.537 [1.177–2.007], P = 0.002 at 12 month,Table 3). In particular, these primary events would be driven by cardiac death (cardiac death, aHR 1.548 [1.128–
2.124], P = 0.007 at 12 month,Table 3). Also, TIMI minor bleeding also occurred more fre- quently in the low BMI group (BMI < 22 kg/m2) than in the high BMI group (BMI � 26 kg/
m2) at 12 month (122 [4.6%] vs. 56 [2.2%], P<0.001; aHR 1.881 [1.337–2.646], P<0.001 at 12 month,S2 Table). Meanwhile, after further adjustment, stent thrombosis was associated with low BMI (BMI < 22 kg/m2), comparing to the high BMI group (BMI � 26 kg/m2) at 12 month, that reached marginal significance (stent thrombosis, aHR 2.891 [0.949–8.812],
Table 1. (Continued)
Variable Group 1
N = 2632
Group 2 N = 5368
Group 3 N = 2568
P value
LVEF 51.0 (43.0,58.0)a 53.0 (46.0,59.5)b 54.0 (47.0,60.2)c <0.001
Data are presented as median (interquartile range), and number (percentage) where appropriate. Group was stratified by BMI quartiles (Group1 < 22 kg/m2, Group 2
�22 < 26 kg/m2 and Group 3 �26 kg/m2). In ANOVA analysis, values labeled with the different superscripts in a row indicate significant differences between groups based on Bonferroni’s multiple comparison test. BMI = body mass index, STEMI = ST segment elevation myocardial infarction, NSTEMI = non-ST segment elevation myocardial infarction, CAD = coronary artery disease, CKD = chronic kidney disease, CHF = congestive heart failure, PCI = percutaneous coronary intervention, Hb = hemoglobin, hsCRP = high sensitivity C-reactive protein, LDL cholesterol = low density lipoprotein cholesterol, HDL cholesterol = high density lipoprotein Cholesterol, ACE inhibitor = angiotensin-converting enzyme inhibitor, ARB = angiotensin receptor blocker, Gp IIb/IIIa inhibitor = glycoprotein IIb/IIIa inhibitor, LVEF = left ventricular ejection fraction
https://doi.org/10.1371/journal.pone.0217525.t001
Table 2. Baseline angiographic characteristics in patients with MI undergoing primary PCI stratified by BMI.
Variable Group 1 Group 2 Group 3 P value
Target vessel (%)
LAD 1906 (72.4) 3806 (70.9) 1717 (66.9) <0.001
LCX 1177 (44.7) 2325 (43.3) 1129 (44.0) 0.485
RCA 1418 (53.9) 2853 (53.1) 1377 (53.6) 0.811
LMCA 126 (4.8) 258 (4.8) 113 (4.4) 0.707
Number of diseased vessels (%) 0.054
1 1252 (47.6) 2641 (49.2) 1312 (51.1)
2 804 (30.5) 1666 (31.0) 783 (30.5)
3 535 (20.3) 973 (18.1) 434 (16.9)
4 41 (1.6) 88 (1.6) 39 (1.5)
Lesion classification (%)
A 31 (1.6) 70 (1.3) 33 (1.3) 0.890
B1 321 (12.2) 644 (12.0) 284 (11.1) 0.378
B2 1001 (38.0) 1974 (36.8) 985 (38.4) 0.312
C 1279 (48.6) 2679 (49.9) 1266 (49.3) 0.538
Pre-PCI TIMI 0 or 1, n (%) 1442 (54.8) 3061 (57.0) 1517 (59.1) 0.008
Post-PCI TIMI 0 or 1, n (%) 10 (0.4) 14 (0.3) 7 (0.3) 0.635
Post-PCI TIMI 3, n (%) 2549 (96.8) 5217 (97.2) 2509 (97.7) 0.165
Total number of stents (%) 1.19± 0.43 1.18± 0.42 1.17± 0.41 0.303
Total stent length 29.87± 14.22 29.47± 14.27 29.14± 13.93 0.176
Mean stent diameter 2.98± 0.52a 3.05± 0.53b 3.11± 0.59c <0.001
Data are presented as mean± SD and number (percentage) where appropriate. Group was stratified by BMI quartiles (Group 1 < 22 kg/m2, Group 2 �22 < 26 kg/m2 and Group 3 �26 g/m2). Lesion based on American College of Cardiology/American Heart Association lesion classification. LAD = left anterior descending artery, LCX = left circumflex artery, LMCA = left main coronary artery, TIMI = Thrombolysis In Myocardial Infarction
https://doi.org/10.1371/journal.pone.0217525.t002
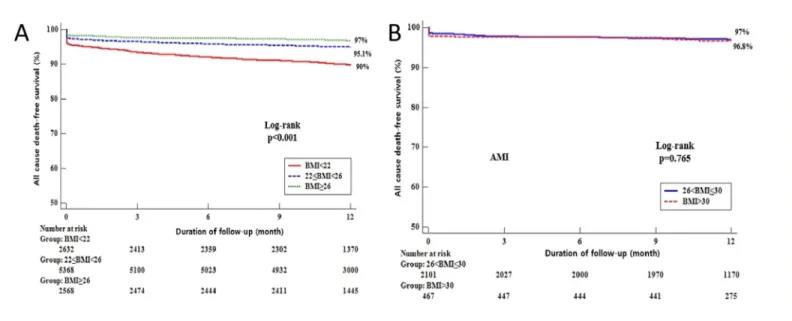
P = 0.062 at 12 month,S2 Table). In addition, we analyzed the association between patients with BMI �26 < 30 kg/m2and BMI �30 kg/m2in this study. There was no significant differ- ences in the primary outcome for all cause death (S1 Table). The event-free Kaplan-Meier curve for the primary outcome is shown inFig 2B. Also, we analyzed the events in AMI patients not performing PCI, followed by no significant differences in the primary outcome as well as other individual components of outcomes (S4 Table).
Predictors of the overall mortality
Univariable and multivariable logistic regression analyses were performed to identify indepen- dent predictors of mortality in patients with AMI undergoing PCI. In the multivariable logistic regression model, age, Killip classification, CKD, cerebrovascular disease, use of ß-blocker, ACE inhibitor/ARB, statin, Hb, HDL cholesterol, preprocedural suboptimal flow (TIMI 0 or 1 flow) and LVEF were independent predictors of overall mortality (Table 4).
Subgroup analyses
The effect of BMI on the primary outcome was consistent across the subgroups except with respect to diabetes status and CKD, in which a trend toward a treatment-by-subgroup interac- tion was found (Fig 3) Among patients with diabetes, the rate of the primary outcome was sig- nificantly higher among those assigned to the low BMI group than among those assigned to
Table 3. Clinical outcomes in AMI patients stratified by BMI at 1-year.
Group P-value Log-rank
P-value
HR 95% CI P-value Adjusted
HR
95% CI P-value
1-year Primary end-point
<0.001 <0.001
(All cause death) Group 1 262 (10.0) 3.421 2.653 4.411 <0.001 1.537 1.177 2.007 0.002
Group 2 261 (4.9) <0.001 1.634 1.267 2.107 <0.001 1.270 0.981 1.646 0.070
Group 3 77 (3.0) <0.001 1.000 1.000
Cardiac death <0.001 <0.001
Group 1 184 (7.0) 3.344 2.474 4.519 <0.001 1.548 1.128 2.124 0.007
Group 2 55 (2.1) <0.001 1.637 1.212 2.212 0.001 1.261 0.928 1.714 0.138
Group 3 49 (1.9) <0.001 1.000 1.000
Myocardial infarction 0.196 0.433
Group 1 49 (1.9) 1.564 1.002 2.441 0.049 1.114 0.691 1.797 0.658
Group 2 82 (1.5) 0.307 1.241 0.825 1.867 0.300 1.132 0.746 1.718 0.559
Group 3 32 (1.2) 0.046 1.000 1.000
Target vessel revascularization 0.259 0.508
Group 1 12 (0.5) 0.587 0.289 1.193 0.141 0.611 0.283 1.319 0.210
Group 2 34 (0.6) 0.569 0.783 0.454 1.348 0.377 0.819 0.467 1.434 0.484
Group 3 21 (0.8) 0.134 1.000 1.000
Cerebrovascular events 0.032 0.005
Group 1 34 (1.3) 2.320 1.263 4.258 0.007 1.460 0.764 2.789 0.252
Group 2 52 (1.0) 0.272 1.682 0.947 2.988 0.076 1.439 0.802 2.581 0.223
Group 3 15 (0.6) 0.005 1.000 1.000
Data are presented as n (%), CI, confidence interval; HR, hazard ratio. Group was stratified by BMI quartiles (Group 1 < 22 kg/m2, Group 2 �22 < 26 kg/m2 and Group 3 �26 kg/m2). All of the variables in Tables1&2were included and analyzed to perform univariate analysis. On the basis of the variables that were significant (P < 0.05) according to univariate analysis, a multivariate Cox proportional hazard model was constructed
https://doi.org/10.1371/journal.pone.0217525.t003
the high BMI group (HR 2.200 [1.535–3.154], P<0.001,Fig 3). Among patients without diabe- tes, there was consistently significant difference in the rate of the primary outcome between the low BMI and the high BMI groups (HR 4.957 [3.428–7.168], P<0.001,Fig 3) (P = 0.005 for interaction). Meanwhile, among patients with CKD, the rate of the primary outcome was sig- nificantly higher among those assigned to the low BMI group than among those assigned to the high BMI group (HR 1.982 [1.421–2.765], P<0.001,Fig 3). Among patients without CKD, there was consistently significant difference in the rate of the primary outcome between the
Fig 2. Kaplan-Meier Curve for the 12-month probability of all cause death-free survival in patients with MI undergoing primary PCI stratified by BMI. 12-month probability of all cause death-free survival stratified by BMI quartiles (A) (Group 1 < 22 kg/m2, Group 2 � 22 < 26 kg/m2 and Group 3 � 26 kg/m2) and (B) (Group 4 � 26 < 30 kg/m2 and Group 5 � 30 kg/m2).
https://doi.org/10.1371/journal.pone.0217525.g002
Table 4. Multivariate analysis for overall mortality.
NSTEMI Adjusted OR 95% CI p-value
Lower Upper
Age 1.045 1.034 1.057 <0.001
Killip classification 1.334 1.213 1.468 <0.001
CKD 1.335 1.046 1.703 0.020
Cerebrovascular disease 1.421 1.031 1.959 0.032
Use of b-blocker 0.405 0.322 0.511 <0.001
Use of ACE inhibitor/ARB 0.446 0.355 0.559 <0.001
Use of statin 0.170 0.133 0.217 <0.001
Hb 0.912 0.862 0.966 0.002
HDL cholesterol 0.990 0.981 1.000 0.044
Pre-PCI TIMI 0 or 1 0.884 0.811 0.963 0.005
LVEF 0.986 0.977 0.995 0.003
OR = odds ratio, CI = confidence interval, CKD = chronic kidney disease, ACE inhibitor = angiotensin-converting enzyme inhibitor, ARB = angiotensin receptor blocker, Hb = hemoglobin, HDL cholesterol = high density lipoprotein cholesterol, TIMI = Thrombolysis In Myocardial Infarction, LVEF = left ventricular ejection fraction. multivariable logistic regression analyses were carried out to identify independent predictors for overall mortality and on the basis of the variables that were significant (P < 0.05) according to univariable logistic regression analysis
https://doi.org/10.1371/journal.pone.0217525.t004
low BMI and the high BMI groups (HR 4.310 [2.905–6.395], P<0.001,Fig 3) (P = 0.012 for interaction). The interaction between the BMI groups, diabetes and renal status was also mar- ginally observed with respect to the end points of age (P = 0.064 for interaction) and hyperten- sion (P = 0.059 for interaction) (Fig 3).
Discussion
The present study unearthed that the group with low BMI had poor clinical profiles including older age, a higher proportion of female, CKD, prior CHF, cerebrovascular disease and atrial fibrillation/flutter, lower Hb, higher inflammation marker as well as aggravated heart failure.
On the other hand, although the group with high BMI had patients with younger age, a higher proportion of male and greater use of medications, it had relatively worse lipid profiles and risk factors including family history of CAD, hypertension, hyperlipidemia and current/recent smoker. Nevertheless, our clinical results demonstrated that the high BMI group is associated with better clinical outcomes in long-term follow-up in patients with AMI undergoing PCI.
The present study provides significant findings that AMI patients with low BMI had a sig- nificant correlation with the all cause death. Addressing this matter, our findings have impor- tant implications because we provide strong evidence with solid data and large sample size.
First, the adverse associations of weighted-patients with adverse primary outcome were more prominent in patients with the lowest BMI quartile, compared to those with the highest BMI quartile. This result was consistent by the adverse effects of cardiac death, even after adjust- ments for several confounding factors (Table 3). More to the point, this study showed that the incidence of clinical outcomes according to the BMI quartiles was more prominent in the low- est BMI quartile than in the highest BMI quartile among all subgroups (Table 3andFig 3). Not only patients with STEMI but those with NSTEMI had consistent effects on primary endpoint and even patients with diabetes mellitus and CKD as well as old age and aggravated heart fail- ure also showed comparable trends. Second, consistent with a previous finding [12], there was a lower percentage of acute anterior AMI presentation in patients with the higher BMI group (Table 2). Less incidence of anterior infarction in higher BMI group might affect favorable out- come in this study. Third, another remarkable points in the present study were proportion of CKD and level of Hb. A difference was already taken notice at the baseline characteristics (Table 1). One of the causes of anemia to take account is the prevalence of CKD across the BMI quartiles (Table 1), consistent to a previous study [12]. The higher incidences of anemia and CKD in the lowest BMI group could be strongly associated with poor clinical outcomes, as noted before [20,21]. Fourth, patients with higher BMI quartiles were more frequently taking guideline-recommended therapies on admission including aspirin, new P2Y12 inhibitors (ticagrelor or prasugrel), b-blockers, ACE inhibitor or ARB, statin and Gp IIb/IIIa inhibitor.
This wide-range use of optimal management in AMI patients undergoing PCI must be related with favorable results in patients with the higher BMI quartile. Fifth, one of crucial clinical fac- tors influencing the results in the present study is age. Younger patients were more frequently observed in the higher BMI group. Previous studies demonstrated that coronary intervention in aged population is still challenging due to complex clinical situations such as comorbidities, side effects associated with multiple drug administration and greatly reduced cardiac function with serious coronary disease [22–24]. Our multivariate analysis (Table 4) showed the results consistent with the findings of previous studies. Advanced age, higher killip classification,
Fig 3. Subgroup analysis of the primary outcome. Hazard ratios and 95% confidence intervals are shown for the primary end point of all cause death in subgroups of patients assigned to BMI group. The P value for interaction represents the likelihood of interaction between the variable and the relative BMI effect.
https://doi.org/10.1371/journal.pone.0217525.g003
lower left ventricular ejection fraction, a higher prevalence of CKD and a lower level of Hb as well as lower use of b-blocker, ACE inhibitor/ARB and statin were independent predictors of overall mortality. Additionally, we analyzed the association between patients with BMI
�26 < 30 kg/m2and BMI �30 kg/m2in this study. Up to now, no study has been conducted in Asian countries to assess the patients with extremely higher BMI quartile (BMI > 30 or 35 kg/m2). Intriguingly, the individual components of other clinical outcome as well as primary end-point did not reach the significance between patients with BMI �26 < 30 kg/m2and BMI � 30 kg/m2in this study (S1 TableandFig 2B). Although our data showed no significant differences in outcomes (S1 Table), it should be taken into consideration for relatively small sample size. Nevertheless, the result in Asian population would warrant further trial for extremely obese population. Also, clinical outcomes in patients with MI not undergoing pri- mary PCI or ballooning stratified by BMI showed interesting results. There were no significant differences not only in the event of all cause death but in the events of other clinical outcomes such as CD, MI, TVR, cerebrovascular events, heart failure and TIMI minor bleeding (S4 Table). Actually, this result would be driven from relatively small sample size. Accordingly, the analysis could be underpowered for detecting clinically relevant differences of clinical end- points in this analysis. However, the discrepancy of clinical outcome subject to PCI or balloon- ing stratified by BMI would be worthwhile for further investigation.
Several potential mechanisms accounting for protective effects of obesity on clinical out- comes after AMI have been proposed; greater metabolic reserves, less cachexia, younger ages, more aggressive medical therapy, more aggressive diagnostic and revascularization proce- dures, increased muscle mass and strength, diminished hormonal response including the renin-angiotensin-aldosterone system, and unmeasured confounders, including selection bias [25]. Another possible explanation is that lower BMIs do not distinguish well between lean body mass and adipose tissue. It would be better predictive of amount of adipose tissue at higher BMIs [26]. Central adiposity or body fat content might be more clinically important than BMI, itself. The exact estimation of excess adipose tissue in accordance with weight status would be helpful to assess this issue.
There are several limitations in our study. First, although potentially clinical confounding covariates were adequately adjusted, the comparative results might be vulnerable to unmea- sured confounders. Second, it was a nonrandomized observational registry and results are prone to be influenced by inherent limitations. Thus, large, prospective trials will be needed for further evaluation. Third, no consensus exists on what the optimal cutoff point of BMI is to determine obesity in Asians. Asians generally have a higher percentage of body fat than Euro- peans. Asian populations have also been shown to have an elevated risk of DM, hypertension, and hyperlipidemia at a relatively low level of BMI. Therefore, the BMI cutoff points for obe- sity should be lower for Asian populations than they are for European populations [27].
Fourth, we did not have the data related to the change in BMI or weight during the follow-up period. Therefore, we could not determine the impact of weight reduction on outcomes after PCI. Finally, the fact that the trial included only Korean populations could affect the generaliz- ability of the findings.
Conclusion
The current analysis of the KAMIR-NIH registry showed the clinical implications of BMI in patients with AMI undergoing PCI. Patients with higher levels of baseline BMI had better risk- profiles of baseline clinical, laboratory, and angiographic characteristics and also had favorable clinical outcomes. Further studies are required to address the optimal cut-off value in Asian population and long-term effects for patients with AMI and various BMI. Also, further clinical
trials to evaluate beneficial effects of central obesity would be helpful to give an explanation of obesity paradox.
Supporting information
S1 Fig. Kaplan-Meier curve for the 12-month probability of all cause death-free survival in patients with MI not undergoing primary PCI stratified by BMI.
(DOCX)
S1 Table. Clinical outcomes between Group 4 (BMI �26 < 30 kg/m2) and Group 5 (BMI
�30 kg/m2) in patients with MI undergoing primary PCI at 1-year.
(DOCX)
S2 Table. Other clinical outcomes in AMI patients stratified by BMI at 1-year.
(DOCX)
S3 Table. Baseline demographic, clinical and laboratory characteristics in patients with MI not undergoing primary PCI or ballooning stratified by BMI.
(DOCX)
S4 Table. Clinical outcomes in patients with MI not undergoing primary PCI or ballooning stratified by BMI.
(DOCX)
S1 Dataset. Raw clinical data with a fully anonymized data set.
(XLSX)
Acknowledgments
Korean Acute Myocardial Infarction Registry National Institutes of Health (KAMIR-NIH) Investigators: Myung Ho Jeong MD, Young Keun Ahn MD, Sung Chull Chae MD, Kiyuk Chang MD, WookSung Chung MD, TaeHoon Ahn MD, Seung Woon Rha MD, Hyo-Soo Kim MD, HyeonCheol Gwon MD, InWhan Seong MD, KyungKuk Hwang MD, Kwon-Bae Kim MD, Kwang Soo Cha MD, SeokKyu Oh MD, JeiKeon Chae MD.
Author Contributions
Conceptualization: Myung Ho Jeong.Formal analysis: Dae-Won Kim, Sung-Ho Her.
Funding acquisition: Myung Ho Jeong.
Investigation: Dae-Won Kim.
Methodology: Ha Wook Park.
Project administration: Myung Ho Jeong.
Resources: Myung Ho Jeong.
Supervision: Sung-Ho Her, Mahn-Won Park, Kiyuk Chang, Wook Sung Chung, Ki Bae Seung, Tae Hoon Ahn, Seung-Woon Rha, Hyo-Soo Kim, Hyeon Cheol Gwon, In Whan Seong, Kyung Kuk Hwang, Shung Chull Chae, Kwon-Bae Kim, Young Jo Kim, Kwang Soo Cha, Seok Kyu Oh, Jei Keon Chae.
Writing – original draft: Dae-Won Kim.
Writing – review & editing: Dae-Won Kim.
References
1. Hubert HB, Feinleib M, McNamara PM, Castelli WP. Obesity as an independent risk factor for cardio- vascular disease: a 26-year follow-up of participants in the Framingham Heart Study. Circulation. 1983;
67: 968–977. PMID:6219830
2. Berentzen TL, Jakobsen MU, Halkjaer J, Tjonneland A, Overvad K, Sorensen TI. Changes in waist cir- cumference and mortality in middle-aged men and women. PloS one. 2010; 5.https://doi.org/10.1371/
journal.pone.0013097PMID:20927346
3. Cameron AJ, Magliano DJ, Soderberg S. A systematic review of the impact of including both waist and hip circumference in risk models for cardiovascular diseases, diabetes and mortality. Obesity reviews:
an official journal of the International Association for the Study of Obesity. 2013; 14: 86–94.https://doi.
org/10.1111/j.1467-789X.2012.01051.xPMID:23072327
4. Carmienke S, Freitag MH, Pischon T, Schlattmann P, Fankhaenel T, Goebel H, et al. General and abdominal obesity parameters and their combination in relation to mortality: a systematic review and meta-regression analysis. European journal of clinical nutrition. 2013; 67: 573–585.https://doi.org/10.
1038/ejcn.2013.61PMID:23511854
5. Stegger JG, Schmidt EB, Obel T, Berentzen TL, Tjonneland A, Sorensen TI, et al. Body composition and body fat distribution in relation to later risk of acute myocardial infarction: a Danish follow-up study.
International journal of obesity (2005). 2011; 35: 1433–1441.https://doi.org/10.1038/ijo.2010.278 PMID:21285940
6. Nilsson G, Hedberg P, Leppert J, Ohrvik J. Basic Anthropometric Measures in Acute Myocardial Infarc- tion Patients and Individually Sex- and Age-Matched Controls from the General Population. Journal of obesity. 2018; 2018: 3839482.https://doi.org/10.1155/2018/3839482PMID:30533220
7. Gruberg L, Weissman NJ, Waksman R, Fuchs S, Deible R, Pinnow EE, et al. The impact of obesity on the short-term and long-term outcomes after percutaneous coronary intervention: the obesity paradox?
J Am Coll Cardiol. 2002; 39: 578–584. PMID:11849854
8. Gurm HS, Brennan DM, Booth J, Tcheng JE, Lincoff AM, Topol EJ. Impact of body mass index on out- come after percutaneous coronary intervention (the obesity paradox). The American journal of cardiol- ogy. 2002; 90: 42–45. PMID:12088778
9. Gurm HS, Whitlow PL, Kip KE, Investigators B. The impact of body mass index on short- and long-term outcomes inpatients undergoing coronary revascularization. Insights from the bypass angioplasty revascularization investigation (BARI). J Am Coll Cardiol. 2002; 39: 834–840. PMID:11869849 10. Kosuge M, Kimura K, Kojima S, Sakamoto T, Ishihara M, Asada Y, et al. Impact of body mass index on
in-hospital outcomes after percutaneous coronary intervention for ST segment elevation acute myocar- dial infarction. Circ J. 2008; 72: 521–525. PMID:18362419
11. Herrmann J, Gersh BJ, Goldfinger JZ, Witzenbichler B, Guagliumi G, Dudek D, et al. Body mass index and acute and long-term outcomes after acute myocardial infarction (from the Harmonizing Outcomes With Revascularization and Stents in Acute Myocardial Infarction Trial). The American journal of cardiol- ogy. 2014; 114: 9–16.https://doi.org/10.1016/j.amjcard.2014.03.057PMID:24846807
12. Nikolsky E, Stone GW, Grines CL, Cox DA, Garcia E, Tcheng JE, et al. Impact of body mass index on outcomes after primary angioplasty in acute myocardial infarction. Am Heart J. 2006; 151: 168–175.
https://doi.org/10.1016/j.ahj.2005.03.024PMID:16368312
13. Mehta L, Devlin W, McCullough PA, O’Neill WW, Skelding KA, Stone GW, et al. Impact of body mass index on outcomes after percutaneous coronary intervention in patients with acute myocardial infarc- tion. The American journal of cardiology. 2007; 99: 906–910.https://doi.org/10.1016/j.amjcard.2006.
11.038PMID:17398181
14. Levine GN, Bates ER, Blankenship JC, Bailey SR, Bittl JA, Cercek B, et al. 2011 ACCF/AHA/SCAI Guideline for Percutaneous Coronary Intervention. A report of the American College of Cardiology Foundation/American Heart Association Task Force on Practice Guidelines and the Society for Cardio- vascular Angiography and Interventions. J Am Coll Cardiol. 2011; 58: e44–122.https://doi.org/10.
1016/j.jacc.2011.08.007PMID:22070834
15. Thygesen K, Alpert JS, Jaffe AS, Simoons ML, Chaitman BR, White HD, et al. Third universal definition of myocardial infarction. Eur Heart J. 2012; 33: 2551–2567.https://doi.org/10.1093/eurheartj/ehs184 PMID:22922414
16. Brosius FC 3rd, Hostetter TH, Kelepouris E, Mitsnefes MM, Moe SM, Moore MA, et al. Detection of chronic kidney disease in patients with or at increased risk of cardiovascular disease: a science advisory from the American Heart Association Kidney And Cardiovascular Disease Council; the Councils on High Blood Pressure Research, Cardiovascular Disease in the Young, and Epidemiology and
Prevention; and the Quality of Care and Outcomes Research Interdisciplinary Working Group: devel- oped in collaboration with the National Kidney Foundation. Circulation. 2006; 114: 1083–1087.https://
doi.org/10.1161/CIRCULATIONAHA.106.177321PMID:16894032
17. Cutlip DE, Windecker S, Mehran R, Boam A, Cohen DJ, van Es GA, et al. Clinical end points in coronary stent trials: a case for standardized definitions. Circulation. 2007; 115: 2344–2351.https://doi.org/10.
1161/CIRCULATIONAHA.106.685313PMID:17470709
18. Wiviott SD, Antman EM, Gibson CM, Montalescot G, Riesmeyer J, Weerakkody G, et al. Evaluation of prasugrel compared with clopidogrel in patients with acute coronary syndromes: design and rationale for the TRial to assess Improvement in Therapeutic Outcomes by optimizing platelet InhibitioN with pra- sugrel Thrombolysis In Myocardial Infarction 38 (TRITON-TIMI 38). Am Heart J. 2006; 152: 627–635.
https://doi.org/10.1016/j.ahj.2006.04.012PMID:16996826
19. Laskey WK, Yancy CW, Maisel WH. Thrombosis in coronary drug-eluting stents: report from the meet- ing of the Circulatory System Medical Devices Advisory Panel of the Food and Drug Administration Center for Devices and Radiologic Health, December 7–8, 2006. Circulation. 2007; 115: 2352–2357.
https://doi.org/10.1161/CIRCULATIONAHA.107.688416PMID:17470710
20. Best PJ, Lennon R, Ting HH, Bell MR, Rihal CS, Holmes DR, et al. The impact of renal insufficiency on clinical outcomes in patients undergoing percutaneous coronary interventions. J Am Coll Cardiol. 2002;
39: 1113–1119. PMID:11923033
21. Blackman DJ, Pinto R, Ross JR, Seidelin PH, Ing D, Jackevicius C, et al. Impact of renal insufficiency on outcome after contemporary percutaneous coronary intervention. Am Heart J. 2006; 151: 146–152.
https://doi.org/10.1016/j.ahj.2005.03.018PMID:16368308
22. De Gregorio J, Kobayashi Y, Albiero R, Reimers B, Di Mario C, Finci L, et al. Coronary artery stenting in the elderly: short-term outcome and long-term angiographic and clinical follow-up. J Am Coll Cardiol.
1998; 32: 577–583. PMID:9741496
23. Tse G, Gong M, Nunez J, Sanchis J, Li G, Ali-Hasan-Al-Saegh S, et al. Frailty and Mortality Outcomes After Percutaneous Coronary Intervention: A Systematic Review and Meta-Analysis. Journal of the American Medical Directors Association. 2017; 18: 1097.e1091–1097.e1010.https://doi.org/10.1016/j.
jamda.2017.09.002PMID:29079033
24. Alexander KP, Newby LK, Armstrong PW, Cannon CP, Gibler WB, Rich MW, et al. Acute coronary care in the elderly, part II: ST-segment-elevation myocardial infarction: a scientific statement for healthcare professionals from the American Heart Association Council on Clinical Cardiology: in collaboration with the Society of Geriatric Cardiology. Circulation. 2007; 115: 2570–2589.https://doi.org/10.1161/
CIRCULATIONAHA.107.182616PMID:17502591
25. Jahangir E, De Schutter A, Lavie CJ. The relationship between obesity and coronary artery disease.
Transl Res. 2014; 164: 336–344.https://doi.org/10.1016/j.trsl.2014.03.010PMID:24726461 26. Kotchen TA. Obesity-related hypertension: epidemiology, pathophysiology, and clinical management.
Am J Hypertens. 2010; 23: 1170–1178.https://doi.org/10.1038/ajh.2010.172PMID:20706196 27. Consultation WHOE. Appropriate body-mass index for Asian populations and its implications for policy
and intervention strategies. Lancet. 2004; 363: 157–163.https://doi.org/10.1016/S0140-6736(03) 15268-3PMID:14726171