ATMOSPHERIC CORRECTION FOR ASTER THERMAL RADIOMETRY USING MODIS ATMOSPHERIC PROFILES
Park Wook, Jaewon Choi, Yoonkyung Lee
Department of Earth System Sciences, Yonsei University E-mail: [email protected]
ABSTRACT: The goal of this study is to retrieve ASTER thermal radiometry using a radiative transfer model. The MODTRAN is used for the model because it is easy to use with high spatial resolution and it is possible to specify input parameters such as profiles of temperature, water vapor density, ozone, aerosols and any of the other gasses. Most of parameters such as temperature and water vapor profiles were obtained from the Terra MODIS. The selected ASTER scene images land and coastal area. The surface radiance of ASTER TIR bands were retrieved by MODTRAN and extracted atmospheric profiles from MOD07 and US standard 76 models. Radiance estimated using MOD07 data was systematically lower by about 0.5-1.0 W/m2∙sr∙μm than that by US standard 76 model between the two cases.
KEY WORDS: ASTER, thermal infrared, atmospheric correction, MODTRAN, MODIS
1. INTRODUCTION
The sensor radiance is measured by the Advanced Spaceborne Thermal Emission and Reflection Radiometer (ASTER) instrument. The purpose of the atmospheric correction method is to remove atmospheric effects providing estimates of the radiation emitted and reflected at the surface (Palluconi et al., 1999). A standard atmospheric correction algorithm is based on a radiative transfer model named Moderate Resolution Atmospheric Radiance and Transmittance Model (MODTRAN), which allows the retrieval of at-surface radiance using estimated atmospheric parameters.
Absolute radiometric correction needs in-situ measurement atmospheric parameters with satellite image acquisition time and location. It is usually difficult to obtain all parameters. Therefore, it is often practical to calculate it using standard atmosphere model such as US standard 76, mid-latitude summer, etc. In many cases, the standard model is suitable for atmospheric correction.
However, if atmospheric conditions are different from the standard model then it causes error.
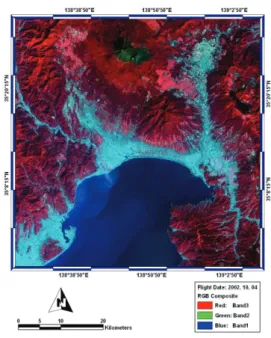
The test area in this study is around of Mt. Fuji on 14.October 2002. The size of the original scene is 830 ⅹ 700 pixels (about 74 ⅹ 63 km). Figure.1 is the radiance image of VNIR.
The Moderate Resolution Imaging Spectroradiometer (MODIS) Atmospheric Profiles product (MOD07) data was used as input parameters. Since the two payloads of ERS-Terra observe the Earth simultaneously, it is the best to use for improving correction accuracy. Some atmospheric parameters should be simplified. Most gas components do not significantly affect in the thermal infrared except water vapor. And ozone absorption band also exists at about 9 to 10μm region. Generally the atmosphere transmittance and path radiance is computed by MODTRAN using standard atmosphere profiles. In this study, MOD07 product was used for atmospheric profiles such as a mean of air temperature, water vapor, total ozone amount, etc.
Figure 1. The test ASTER image around Mt. Fuji acquired on 14 October 2002.
2. DATA AND INSTRUMENT 2.1 ASTER TIR Image
The ASTER is a high spatial resolution multispectral imager on the Terra satellite—the first platform of the National Aeronautics and Space Administration’s (NASA) Earth Observing System (EOS)—launched in December 1999 (Yamaguchi et al., 1998). The ASTER instrument consists of three subsystems according to spectral range: the visible and near-infrared (VNIR), the shortwave infrared (SWIR), and the thermal infrared (TIR) subsystems. The ASTER/TIR instrument has five
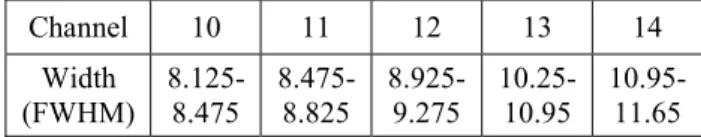
spectral bands (bands 10–14) with the spatial resolution of 90 m. These bands allow retrieval of both temperature and spectral emissivity of the Earth’s surface, which can be used in a wide variety of studies such as environmental monitoring, geological mapping, and hazard prediction. A summary of the characteristics of the ASTER/TIR instrument is given in Table.1.
Table 1 TIR Channel Full-Width-At-Half Maximum Spectral Response (μm) (Palluconi et al., 1999).
Channel 10 11 12 13 14
Width
(FWHM) 8.125-
8.475 8.475-
8.825 8.925-
9.275 10.25-
10.95 10.95- 11.65
2.2 MODIS atmospheric profile product
The MODIS Atmospheric Profiles product (MOD 07) consists of atmospheric parameters: they are total-ozone amount, air temperature moisture and atmospheric water vapor (Seemann et al., 2006). The MODIS total-ozone amount is an estimate of the total-column tropospheric and stratospheric ozone content. The MODIS temperature and moisture profiles are produced at 20 vertical levels for temperature and moisture. For using profile data, we computed to mean air temperature and moisture at each layer and total ozone amount.
2.3 MODTRAN
MODTRAN is very fast and useful for the radiative transfer simulations. The MODTRAN band model uses a stored spectral data base for 12 (H2O, CO2, O3, N2O, CO, CH4, O2, NO, SO2, NO2, NH3, and HNO3) of the 13 (N2 is handled more simply) molecules included, with band model parameters calculated for 1cm -1 spectral bins at temperatures between 200 to 300 K (A. Berk et al., 2003).
The MODTRAN transfer model allows user specification for profiles of temperature, water vapour density, ozone, aerosols and any of the other gasses which may vary with time.
2.3.1 Temperature and Water Vapor
The most important factors in determining the broad band atmospheric transmission and path radiance for the five ASTER TIR channels are atmospheric water vapor and temperature. The temperature profile (20 levels, 5 km spatial resolution) and water vapor profile (20 levels, 5 km spatial resolution) of MOD07 provides an overall estimate of the amount of water in the column however they are listed with an uncertainty of >20% or 5 mm.
2.3.2 Ozone
In five ASTER TIR channels, ozone is not a important factor in atmospheric correction except for channels 11 and 12, which are the closest channels to the ozone
absorption band between 9 and 10μm. The MODIS product MOD07 provides O3 total burden (5 km spatial resolution).
2.3.3 Surface Elevation
The total water vapour amount is changed by surface elevation and these distributions are decreased in high elevation area. The MODIS product MOD07 provides surface elevation (5 km spatial resolution).
3. THEORETICAL BASIS
In the TIR region, the solar radiation is much smaller than the Earth radiation: about 1% at wavelength 10 μm for the Earth surface at 300 K assuming no atmosphere.
In addition, the atmospheric downward radiance at ground level is smaller than the surface radiance, and the surface reflectance in this region is generally small, so that the assumption that the surface is a Lambertian surface does not produce a large error (Z. Wan et al., 1997). TIR observations of the earth’s surface are commonly corrected for atmospheric effects with the following model:
Lsat =Lsur⋅τ+Lpath (1) Where, Lsat is radiance observed by the sensor, Lsuris surface radiance (which is a combination of both emission and reflection), Lpath is the upwelling atmospheric radiance,
τ
is atmospheric transmissivity.The transmittance and the path radiance are generically called the atmospheric effect parameters. The approach proposed here for atmospheric correction in the thermal infrared involves two fundamental elements: 1) the use of a radiation transfer model capable of estimating the radiative energy of atmospheric emission, absorption and scattering and 2) the acquisition of all the necessary atmospheric parameters (e.g. temperature, water vapor, ozone, aerosol profiles) at the time and location of the measurement to be atmospheric corrected (F. Palluconi et al., 1999).
4. DATA PROCESSING
ASTER TIR bands were corrected by two cases. At the fist case, atmospheric profiles with temperature, moisture, height, surface elevation and total ozone were extracted from MOD07. These data were clipped by 640 x 640 sizes with a 90 m spatial resolution. Path radiance and transmittance were computed by MODTRAN using individual atmospheric profile mean. At the seconds’ case, path radiance and transmittance were computed by MODTRAN using US standard 76 models. Surface radiance of ASTER TIR bands were retrieved by radiative transfer model (equation.1) using individual
model. For estimate, individual result was plotted by 2D scattering method, and flow chat as bellow.
MODIS Atmospheric Profiles (MOD07) 9 Retrieved Temperature Profile 9 Retrieved Moisture Profile 9 Retrieved Height Profile 9 Surface Elevation 9 Total Ozone
ASTER TIR image 9 Band 10~14
MODTRAN
9 Compute Path Radiance 9 Compute Transmittance
Radiometry Correction 9 ASTER TIR Band 10~14 Data
Data
Compute Parameters Compute Parameters
Retrieve Surface Radiance Retrieve Surface Radiance
Figure 2. This figure shows flow chart for atmospheric correction.
5. RESULTS AND DISCUSSION
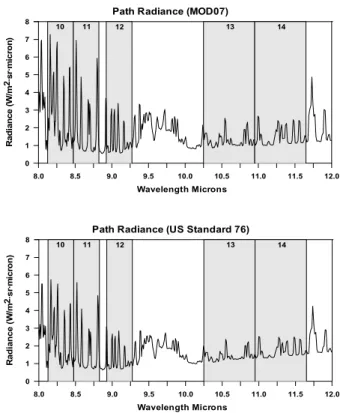
The surface radiance of ASTER TIR bands were retrieved by MODTRAN using extracted atmospheric profile from MOD07 and US standard 76 models. In case of transmittance (Figure 3), the results of extracted atmospheric profile from MOD07 higher value more than the result of US Standard 76 model shows and the path radiance (Figure 4) show different results. ASTER TIR Band 10, 11, 12 shows low path radiance value in extracted atmospheric profile from MOD07. Therefore these results show different the atmospheric effect than standard model in the test area (Table 2). For comparative analysis, 30 random points were created, and the retrieved
8.0 8.5 9.0 9.5 10.0 10.5 11.0 11.5 12.0
Wavelength Microns 0.0
0.1 0.2 0.3 0.4 0.5 0.6 0.7 0.8 0.9 1.0
Transmission
Transmission (MOD07)
10 11 12 13 14
8.0 8.5 9.0 9.5 10.0 10.5 11.0 11.5 12.0
Wavelength Microns 0.0
0.1 0.2 0.3 0.4 0.5 0.6 0.7 0.8 0.9 1.0
Transmission
Transmission (US Standard 76)
10 11 12 13 14
Figure 3. This figure illustrates transmission in thermal infrared region and filled rectangular area is the ASTER thermal bandwidth.
8.0 8.5 9.0 9.5 10.0 10.5 11.0 11.5 12.0
Wavelength Microns 0
1 2 3 4 5 6 7 8
Radiance (W/m2.sr
. micron)
Path Radiance (US Standard 76)
10 11 12 13 14
8.0 8.5 9.0 9.5 10.0 10.5 11.0 11.5 12.0
Wavelength Microns 0
1 2 3 4 5 6 7 8
Radiance (W/m2.sr
. mi
cron)
Path Radiance (MOD07)
10 11 12 13 14
Figure 4. This figure illustrates path radiance in thermal infrared region and filled rectangular area is the ASTER thermal bandwidth.
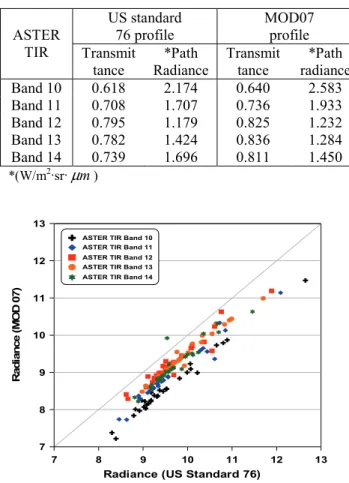
Surface radiance values of ASTER TIR bands were extracted by 30 random points. Scatter plots are shown for general comparison (Figure 5). As the results show, regression slope shift to downward direction. This result shows radiance difference about 0.5-1.0 (W/m2∙sr∙μm) between the two cases. However, these result limits verification between the second case and actual surface radiance value. Therefore it is need more tests with obtained in-situ measurement data.
Table 2. Transmittance and path radiance calculate results by the MODTRAN using MOD07 and US standard 76 profile data.
US standard 76 profile
MOD07 profile ASTER
TIR Transmit
tance *Path
Radiance Transmit
tance *Path radiance
Band 10 0.618 2.174 0.640 2.583
Band 11 0.708 1.707 0.736 1.933
Band 12 0.795 1.179 0.825 1.232
Band 13 0.782 1.424 0.836 1.284
Band 14 0.739 1.696 0.811 1.450
*(W/m2∙sr∙μm)
7 8 9 10 11 12 13
Radiance (US Standard 76) 7
8 9 10 11 12 13
Radiance (MOD 07)
ASTER TIR Band 10 ASTER TIR Band 11 ASTER TIR Band 12 ASTER TIR Band 13 ASTER TIR Band 14
Figure 5. This figure is 2D scattering graph with retrieved surface radiance by MODTRAN using MOD07 and US standard 76 profile data.
6. REFERENCE
A. Berk, G. P. AndersonP. K. Acharya,, M. L. Hoke, J. H.
Chetwynd, L. S. Bernstein, E. P. Shettle, M. W.
Matthew and S. M. Adler-Golden, 2003, MODTRAN4 Version 3 Revision 1 User’s Manual, Air Force Research Laboratory Space Vehicles Directorate, Air Force Materiel Command Hanscom AFB, MA 01731-3010.
F. Palluconi, G. Hoover, R. Alley, M. J. Nilsen, and T.
Thompson, 1999, An atmospheric correction method for ASTER thermal radiometry over land, ASTER algorithm theoretical basis document (ATBD), Revision 3, Jet Propulsion Lab., Pasadena, CA.
H. Tonooka and F. Palluconi, 2005, Validation of ASTER/TIR standard atmospheric correction using water surfaces, IEEE Transactions on Geoscience and Remote Sensing, vol. 43, no. 12, pp. 2769–2777.
S. W. Seemann, E. E. Borbas, J. Li, W. P. Menzel and L.
E.Gumley, 2006, MODIS atmospheric profile retrieval algorithm theoretical basis document, Cooperative Institute for Meteorological Satellite Studies University of Wisconsin-Madison 1225 W.
Dayton St. Madison, WI 53706
Y. Yamaguchi, A. B. Kahle, H. Tsu, T. Kawakami, and M. Pniel, 1998, Overview of the Advanced Spaceborne Thermal Emission and Reflectance Radiometer (ASTER), IEEE Transactions on Geoscience and Remote Sensing, vol. 36, no. 4, pp.
1062–1071.
Z. Wan and Z.-L. Li, 1997, Physics-based algorithm for retrieving land-surface emissivity and temperature from EOS/MODIS data, IEEE Transactions on Geoscience and Remote Sensing, vol. 35, pp. 980–
996.