ANALYSIS ON COASTAL TOPOGRAPHY CHANGE IN HAEUNDAE BEACH USING LIDAR DATA
Ji-Yong Kim, Chul-Uong Choi, Gi-Ho Jin, Hyon-Duk Seo
CHUNG-ANG AEROSURVEY CO. LTD, [email protected] PUKYONG NATIONAL UNIVERSITY, [email protected] CHUNG-ANG AEROSURVEY CO. LTD, ghjin124@ applemap.co.kr
CHUNG-ANG AEROSURVEY CO. LTD, seohd@ applemap.co.kr
ABSTRACT : This study chooses the HAEUNDAE Beach located in BUSAN as the target region of research and analyzes LiDAR data and GPS survey data to utilize basic data for costal management.
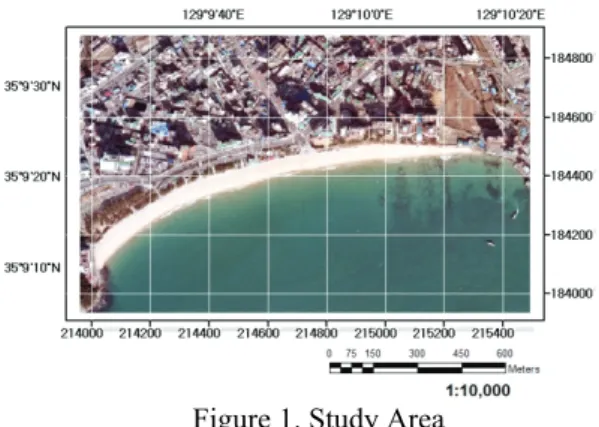
Since HAEUNDAE Beach is topographically open to the south and adjoins the open sea, it is subject to direct influences of waves from the open sea. The beach seems to have been both directly and indirectly affected by the typhoons between 2005 and 2007 due to such geographical features, and it is presumed that it has a great deal of sand deposited through beach nourishment projects, which led to a quantitative analysis in this study. To analyze such changes, both GPS survey data for the month of August 2005 and airborne LiDAR data for the month of August 2007 were collected, and DEM data were produced. Changes in the cross-section of the beach were investigated with a comparative analysis of data for the two periods of time.
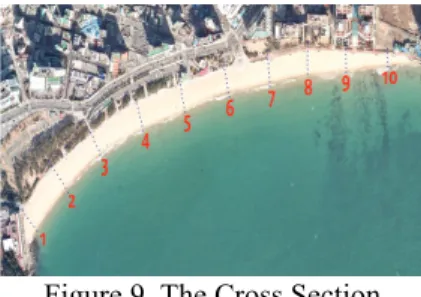
The analysis shows that there occurred a deposit of around 0.75 m/year with a change in the altitude of the beach between 2005 and 2007, and according to a sectional analysis, such changes were largely found in both ends of the beach.
KEY WORDS: LiDAR, GPS Survey, DEM
1. INTRODUCTION
The HAEUNDAE Beach in BUSAN is one of the most famous beaches in Korea with a high preservation value as a tourism goods. However, coast-related projects such as the work to cover a river in CHUNCHEON, land reclamation around the coast, and road construction were individually performed without a review of combined influence on the nature, which have caused serious changes in the Beach.
Various researches were carried out to see the changes.
Most of the previous researches were based on field surveys such as leveling and GPS survey (Ho-sik Jang et at, 2003), or based on the production of a coastline map using aerial ortho photography (Cheol-woong Choi et al, 2001).
However, the ways to gain information from field surveys have disadvantages that it is difficult to get data from areas such as military zones, sea cliffs, and mud- flats, while the ways by aerial photography have disadvantages of errors since coastlines are largely determined through subjective judgments of eyesight.
Thus, studies on LiDAR technology to minimize such disadvantages have been active. This technology leads to easy acquisition of data from the areas that are difficult to access through aerial surveys, and has advantages of rare errors since it creates a precise 3D information by calculating the flying time and distance of laser pulses returning from a target point (Seong-jun Kim et al, 2006).
In addition, as it has been shown that it is possible to extract coastlines more efficiently through an algorithm that enables automatic extraction of coastlines using
LiDAR data (Gwang-jae Wi et al, 2006), more smooth analysis of changes in coastlines has become available.
Figure 1. Study Area
The topographical map based on the current Survey Act prescribes for a high-water line as coastline, while the marine chart based on Hydrography Service Act prescribes for an approximate highest high water as coastline. As such, the reference difference causes confusion in determining coastlines. In the meantime, since aerial photography for the production of a topographical map prescribes for readable boundaries between land and sea as the coastline, readers’ subjective judgments may intervene. Thus, a point of reference for coastlines is required.
Aerial LiDAR surveys may define more precise coastlines through the property that LiDAR equipments are not able to penetrate the water, even though they vary.
Using the LiDAR data, this study produced a precise
DEM for the white beach with a clearer reference of
coastline, and analyzed changes in the cross section of the beach by comparing them with the 2005 GPS survey data. As the results of analysis show that it is possible to forecast what the changes of the coast will be in the future, it is considered that they can be used as useful data for more efficient management of coasts.
2. MATERIALS AND METHODS
Prior to analysis, preprocessing of LiDAR data was performed. LiDAR data were utilized for the production of the DEM in this study after filtering the ground surfaces, which had been classified in the course of preprocessing and creating TIN data.
2.1 LiDAR Data
The resolution of LiDAR data for the HAEUNDAE Beach, the target region of this study, is rated 1 m with a total of 599.353 points.
Figure 2. LiDAR Data Figure 3. File Information These LiDAR data exist as point data, which includes the information regarding reflection strength and multi-eco as well as altitude, which provide an integration of information, including the altitude of ground surfaces, and the altitudes of buildings, trees, and other ground objects (Jeong-ho Lee et al, 2005).
Of the information, altitudes related information provides the greatest advantage from LiDAR data, which helps enable 3D spatial modeling.
However, since the information includes wrong reflection, distortion of reflected wave, and detection of strange objects due to poor precision, depending on the penetrations of the lasers used for LiDAR equipments, the process of eliminating errors is needed. Furthermore, since data representing the ground surface and information representing ground objects such as trees and buildings coexist, it is required to classify the data by height values.
In addition, since such information includes non-ground surfaces such as trees and low buildings, it is also required to eliminate them through filtering process.
Figure 4 shows the LiDAR data processing, for which the Microstation made by Bentley and the Terrascan were used.
Figure 4. Flow Chat 2.2 Noise Remove
In general, LiDAR data include high errors, which are derived from the reflection of objects such as birds and airplanes, and low errors, which are derived from multi- reflections. These errors should surely be eliminated because they greatly affect data processing.
As shown in Figure 5, since low errors might create images of hollow pools in producing DEMs, and high errors might create cone-shaped buildings, it is very important to eliminate them (Electronics and Telecommunications Research Institute, 2004).
In this study, the errors from the target region were eliminated by selectively removing the points, which were greatly different from surrounding ones after gaining average altitudes from the digital map and determining search areas in consideration of the intervals between points.
2.3 Classify Ground
To extract ground surfaces, MLS (maximum local slope) filtering method using slant angles between surrounding points was applied. In MLS filtering, a slant angle is determined between one point and another within a specific area, and if the angle is smaller than the established value, it is classified into a point on the ground surface (Sithole et al, 2000).
Figure 5. Conditional Element of Ground Point
Extraction
Figure 6. Ground Layer 2.4 Filtering
Since there may be height values of trees or buildings even on the layer, which is classified into a point on the ground surface, they were eliminated through filtering process.
Of the points, which had been classified to be on the ground surface, points within a certain scope are grouped, and a mean value was gained by calculating the difference in height between the grouped points. If a point was larger than the mean value, it was considered as non-ground point, being replaced by the mean value.
As such, non-ground points are filtered through the relation between the points included in the calculation operation after grouping ground points in turn and eliminating them (trees or low buildings).
TIN data were produced using pure ground points, which had been identified through the filtering, and DEMs were finally created.
2.5 Using Costal Survey data
As GPS surveys provide 3D location information regardless of time and the weather, they are used for geodetic surveys, which require a precision level less than some centimeters as well as control survey (Hyun Jung Hong et al, 2006).
Taking full advantages of the merits of GPS surveys, the HAEUNDAE Beach, the target region, was surveyed through post-processing.
Figure 7. GPS Survey
The survey was carried out for 12 hours from 4 pm, August 20 to 4 am, August 21, 2005 with the date of August 21, 2005 as a datum point.
For the beach survey, 3 first-class precision GPS devices (1 Ashtech Z-FX and 2 Trimble 5700s) were installed on the 4-wheel motorcycle running across the white beach. Data from the survey were processed using the Trimble Geomatics Office program.
Figure 8. Survey Drawing 3. RESULT
Using the spatial data for the beach topography through the GPS survey in 2005, which had been organized at our research center in 2005, and the pre- processed LiDAR data, the average altitude, the area and volume of the HAEUNDAE Beach topography for the last 2 years were calculated, and the changes in the cross section were also analyzed.
According to the statistical analysis of the DEMs for the beach, the HAEUNDAE Beach topography shows a deposit of 1.94m in altitude, 58.543 ㎡ in area, and 11.238 ㎥ in volume for the year 2007 from the statistical data for the year 2005.
Table 1. The Statistical Summary(MSL Based on 0m)
Year Point Study Area
Cell Size
Ave.
height Area Vol
2005 69823 1426ⅹ407 1ⅹ1 1.89m 56,537㎡ 106,959㎥
2007 78025 1504ⅹ452 1ⅹ1 2.04m 59,543㎡ 110,238㎥
Change