EVALUATION OF SEA FOG DETECTION USING A REMOTE SENSED DATA COMBINED METHOD
Ki-Young Heo
1, Kyung-Ja Ha
1*, Jae-Hwan Kim
1, Jae-Seol Shim
2, and Ae-Sook Suh
31 Division of Earth Environmental System, College of Natural Science, Pusan National University
2 Coastal Disaster Prevention Research Division, Korea Ocean Research & Development Institute
3 Environmental and Meteorological Satellite Division, Korean Meteorological Administration
*Corresponding author: Kyung-Ja Ha, [email protected] ABSTRACT
Steam and advection fogs are frequently observed in the Yellow Sea located between Korea and China during the periods of March-April and June-July respectively. This study uses the remote sensing (RS) data for monitoring sea fog.
Meteorological data obtained from the Ieodo Ocean Research Station provided an informative synopsis for the occurrence of steam and advection fogs through a ground truth. The RS data used in this study was GOES-9, MTSAT- 1R images and QuikSCAT wind data. A dual channel difference (DCD) approach using IR and near-IR channel of GOES-9 and MTSAT-1R satellites was applied to estimate the extension of the sea fog.
For the days examined, it was found that not only the DCD but also the texture-related measurement and the weak wind condition are required to separate the sea fog from the low cloud. The QuikSCAT wind is used to provide a weak wind area less than threshold under stable condition of the surface wind around a fog event. The Laplacian computation for a measurement of the homogeneity was designed. A new combined method of DCD, QuikSCAT wind speed and Laplacian was applied in the twelve cases with GOES-9 and MTSAT-1R. The threshold values for DCD, QuikSCAT wind speed and Laplacian are -2.0 K, 8 m s-1 and 0.1, respectively. The validation methods such as Heidke skill score, probability of detection, probability of false detection, true skill score and odds ratio show that the new combined method improves the detection of sea fog rather than DCD method.
KEY WORDS: Sea fog; Low cloud; Remote sensing; Laplacian; Homogeneity
1. INTRODUCTION
Monitoring methods with the use of satellite data to detect sea fog over the Yellow Sea were examined. Fog is defined as a phenomenon with a horizontal visibility of less than 1 km near the surface over both ocean and land.
The monitoring and forecasting of fog is an imperative task, because fog is responsible for automobile accidents, aircraft takeoff and landing problems, and marine accidents due to poor visibility.
In Korea it has been reported that the occurrence of sea fog in the southwestern sea or the Yellow Sea is maximum in July, mainly due to air-sea temperature differences, as the result of warm air advection and formation of cold water pool. For the observation, station observations in the coastal zone and the IORS (Ieodo Ocean Research Station) are provided as ground truth.
The IORS data has been especially useful in formulating the synopsis for fog formation in the Yellow Sea with sea surface temperature, wind, air temperature, and humidity as well as visibility. The time evolution of fog event was informed by the IORS data.
Methods using station observations, however, are limited, due to the lack of an observation network.
Remote sensing (RS) monitoring via satellite observation is required to locate the area covered by fog. Eyre et al.
(1984) introduced a method using dual-channel radiometers with two infrared channels, shortwave IR
(3.7μm) and longwave IR (11μm) of the National Oceanic and Atmospheric Administration (NOAA) Advanced Very High Resolution Radiometer (AVHRR) to detect nocturnal fog and low stratus. The use of two channels was introduced as the dual channel difference (DCD) method in the study by Park et al. (1997) on the fog detection using NOAA/AVHRR data in the Korean Peninsula. This method took advantages of the differential emissivity of two channels at 3.7 ㎛ and 10.9
㎛. However, it was limited to monitoring the temporal variation of a fog event at 12 hour intervals due to the low earth orbit of the NOAA satellite. Since 2003 GOES- 9 (Geostationary Operational Environmental Satellite) data was serviced, this study examines the monitoring method of DCD using 3.9 ㎛ and 10.7 ㎛ of GOES-9 in 2004 for sea fog in the Yellow Sea, which is comprised of snapshots at 30-minute intervals. Since the channels of MTSAT-1R (the Multi-functional Transport Satellite-1 Replacement) launched on 26 February 2005, operational satellite of KMA, are almost the same as those of GOES- 9, the application of DCD on GOES-9 will be useful for comparison with the MTSAT-1R results.
In the present study, a new combined method of DCD, QuikSCAT wind speed and Laplacian is evaluated to detect sea fog. The QuikSCAT surface wind is provided as wind conditions for the fog event, and a Laplacian method for splitting of sea fog and low cloud is proposed
after applications of DCD and QuikSCAT wind. In addition, it is examined that the similarities and differences for this fog detection method between GOES- 9 and MTSAT-1R images.
2. DATA AND METHED 2.1 DATA
We used the satellite data from GOES-9 and MTSAT- 1R with the SWIR (3.9 ㎛ for GOES-9 and 3.8 ㎛ for MTSAT-1R) and LWIR (10.7 ㎛ for GOES-9 and 10.8
㎛ for MTSAT-1R) channels to monitor the area of the fog with time. The IORS, which is an installed artificial ocean platform located in the middle of the Yellow Sea, provides the synoptic time series of visibility, sea surface temperature, air temperature, humidity, wind, and surface fluxes.For the purpose to detect weak wind area, the QuikSCAT data with a spatial resolution of 25 km was used.
2.2 Method
Usually fog occurs during nocturnal time, when the satellite IR channels are available. During the nighttime, the detection of fog using IR images is difficult since the temperature of fog and the underlying surfaces are similar. Therefore, a dual-channel method is used to detect foggy areas during the nighttime, as suggested by Eyre et al. (1984), Ellrod (1995, 2000). Basically this dual-channel difference (DCD) method uses the difference in emissivity of SWIR and LWIR of GOES-9 for opaque water clouds. At around 11 μm, the brightness temperature (BT) is almost equal to the cloud top temperature (CTT) because opaque water clouds emit radiation as a black body (ε≈1). At around 3.7 μm, the BT is significantly lower than CTT due to lower emissivity of 0.8 – 0.9 (Eyre et al., 1984; Park et al., 1997). Therefore, the difference between the BT from the two channels is sensitive to the presence of fog or low clouds (Anthis and Cracknell, 1999).
Heo and Ha (2004) reported that the strong winds could dissipate fog or cause it to rise and become stratus.
To discriminate between fog and low cloud, first the wind speed criteria with QuikSCAT and automatic weather station (AWS) were used after application of DCD method.
In this study, it should be noted that the primary responsibility of fog is homogeneous in the horizontal distribution of the BT compared to low cloud. The Laplacian operation of BT distribution of channels was developed to separate an area of fog from a large spatial area of negative DCD. The Laplacian operator of BT, which is represented by ∇2(BT), was defined as the divergence of the BT gradient and used as a measure of uniformity. That uses the following equation:
j i, j
1, i j 1, i 1 j i, 1 j i,
2 2 2 2 2
BT 4 BT BT BT BT
y (BT) x
(BT) (BT)
×
− + + +
=
∂ +∂
∂
=∂
∇
+
− +
−
(1)
where BTi,j means brightness temperature at position (i, j) in the x (zonal) and y (meridional) direction.
3. THE CASES AND DCD METHOD 3.1 Fog cases
For the day examined, the steam fog on 7 April 2004 appears to be due to the temperature difference between the air and water, which is abrupt and is caused by change in wind direction, wind speed and relative humidity. This steam fog has a reverse air-sea temperature difference compared with advection fog. In the present study, to examine the fog detection using GOES-9 and MTSAT-1R images, the twelve cases are evaluated. The twelve fog cases include five cases of advection fog and a case of steam fog. The results of fog detection are verified based on surface observations collected at the 27 stations.
3.2 DCD method
Fogs formed in nighttime over the Yellow Sea during the period from April to July 2004 were examined for obtaining the threshold values of the DCD. The criteria are shown in the range of -3.8 to -2.0 K and total hourly mean is -2.8 K. In addition, the hourly mean of DCD from MTSAT-1R has the range of -3.0 to -2.5 K and total hourly mean is -2.8 K.
We attempted to design the DCD method for the first step of detection. To decide the area that fog can occur, we took the threshold of -2.0 K. The case of steam fog occurred at 03 LST 7 April 2004 was applied to the DCD method.
4. THE COMBINATION OF DCD WITH THE USE OF QUIKSCAT AND THE LAPLACIAN METHOD 4.1 The classification of fog and low cloud with the use of QuikSCAT
Both the wind direction and wind speed are important for the formation of sea fog. To separate fog area from the results of DCD, we used wind speed criteria. For the coastal fog, Heo and Ha (2004) reported the proper wind conditions for fog formation, which are less than 8 m s-1 in the southwestern part of the Yellow Sea, through a synoptic analysis. From the analysis of IORS data, it was found that the sea fog in the Yellow Sea was not dissipated in the wind condition less than 8 m s-1. This wind speed criteria is applicable to the separation of fog from low cloud.
4.2 The homogeneity and Laplacian
The top surface of fog area has a homogeneous aspect, compared to cloud (Bader et al., 1995). Therefore, a
Laplacian method can be used to differentiate between low clouds and sea fog under the fog conditions determined by the DCD method. To compare the texture for homogeneity between the fog and the low cloud, we tried to analyze the frequency distribution of BTs for the cases of fog and low cloud. The results show that the fog is homogeneous rather than low cloud. In this study, we attempt to use the homogeneity measurement to distinguish the fog.
In the Laplacian of BT for LWIR and SWIR, Laplacian smaller than the threshold indicates the foggy area, which is mainly due to homogeneous distribution for fog rather than cloud. The threshold value for Laplacian was found to be 0.1 through comparison of visibility less than 1 km with ground fog observations for the cases from this study. The number of fog observation used in this study is 28. Figure 1 shows the horizontal Laplacian of BT of GOES-9 LWIR (a), SWIR (b) over the negative DCD (less than -2.0). Symbols such as ‘ ’,
‘○’ and ‘ ’ represent fog observation points, fog free stations, and missing data stations, respectively.
A Laplacian method can be used to differentiate between low clouds and sea fog under the fog conditions determined by the DCD method. The threshold value of Laplacian operator in this study, 0.1, is empirically determined to discriminate the two. However, the threshold values for the Laplacian should be more precisely defined with time-space variations in additional cases.
(a) (b)
Figure 1. Detection of fog and low cloud using the horizontal Laplacian distribution of (a) BTCH 4 and (b) BTCH 2 at 2030 UTC 6 April 2004 from GOES-9 satellite. The symbols of ‘ ’, ‘○’ and ‘ ’ represent the station where the visibility is less than 1 km (fog), larger than 1 km and not available, respectively.
5. THE EVALUATION OF THE COMBINED DCD METHOD
5.1 The Separation of foggy area with the check list method
In section 3 and 4, we described DCD, the use of QuikSCAT wind speed, and texture. In the present study,
to determinate the fog area, we made the check list table.
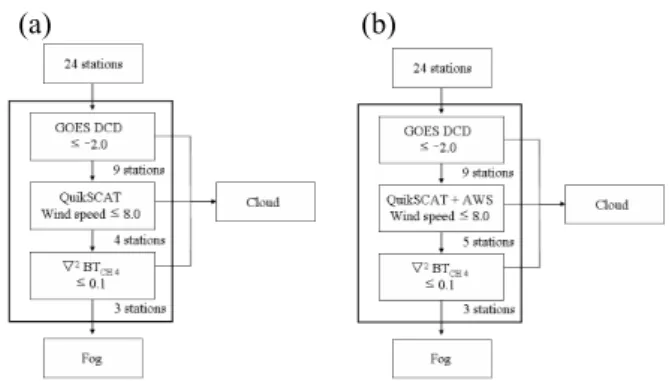
The check lists for the detecting sea fog consist of the DCD method, QuikSCAT wind speed and Laplacian of BTLWIR. Through three steps, the three stations were obtained as fog stations. The stations selected by the check lists method are Ieodo, Sorido and Udo. Figure 2 shows the flow chart of fog detection using the check lists method for the case same as figure 1.
(a) (b)
Figure 2. Flow chart of check list method (a) with only QuikSCAT wind and (b) with QuikSCAT + AWS wind for steam fog case on 7 April 2004.
5.2 The Evaluation in the GOES-9 and MTSAT-1R satellite
In order to use the combined DCD method to the foggy area detection, we made a simple check list for the three steps. To measure the accuracy of the check list method in determining foggy area, we used the validation statistics of skill scores. The first type, exemplified by the Heidke skill score (HSS), tests the effectiveness in specifying the occurrence of fog. The HSS is 0.43 that means a 43% improvement in detection accuracy when compared to random chance. The second type, probability of detection (POD) and probability of false detection (POFD), are fractions of observed events that were correctly predicted to exist and estimated events that are non-events, respectively. Slightly 61% of fogs that occurred were correctly detected to occur (POD = 0.61) and 15% of fog detections turned out to be false detection (no fog observed) (POFD = 0.15). The third type, true skill score (TSS) (Hanssen and Kuipers discriminant, Pierce's skill score) examines the ability of the check list to separate fog events from non-fog events, with scores ranging from -1.0 to +1.0. The 46% of fog detections were able to separate the "yes" cases from the
"no" cases. The last type, odds ratio (OR) is greater than one when the hit rate (POD/1-POD) exceeds the false alarm rate (POFD/1-POFD). The odds of a “yes”
detecting being correct are over 8.86 times greater than the odds of a “yes” detecting being incorrect in this result (OR = 8.86).
To validate the check list method in determining foggy area using MTSAT-1R images, we used the scoring method of the same as the validation method of GOES-9 images. Total number of N is 390, and fogs were
observed on 61 of these cases. The number of hits was FC = 304 whereas the number of EX is 236. Therefore, the HSS is 0.46, which means a 46% improvement in detection accuracy when compared to random chance. In addition, POD = 0.60, POFD = 0.14, TSS = 0.46 and OR
= 9.21.
It induces a simultaneous increase (decrease) of POD and POFD for the threshold value of Laplacian selected in a higher (lower) value than 0.1. Eventually, an accuracy of fog detection is decreased because an increase (decrease) of POFD (POD) is larger than that of POD (POFD). Therefore, the optimal threshold value of Laplacian is chosen as 0.1 to discriminate fog from low cloud.
In order to compare DCD method with the combined DCD method, the skill scores of fog detection using only DCD method are evaluated. It is evident in the HSS of both GOES-9 and MTSAT-1R satellites that the results of the present method increase a 5 ~ 6 % improvement in detection accuracy when compared to random chance rather than DCD. In addition, In the POFD, the present method has improved the discrimination of fog from low cloud. From the result of verifications, the present method is effective for fog detection and discrimination between fog and stratus.
In the bad performance case, we found that it can be noted that the check list method yields a poor performance over fog area when a low cloud case with coverage over 60% and ceiling heights between 300 m and 1200 m, or a 100% total cloud amount is observed.
6. SUMMARY AND CONCLUSION
Monitoring methods with the use of satellite data to detect sea fog over the Yellow Sea were examined. The monitoring by satellite data is strongly recommended for the detection of sea fog since numerical forecast skill and the MOS method have a limited utility for micro-scale and meso-scale structures of fog. In the present study, DCD method using the shortwave and longwave infrared channels of GOES-9 and MTSAT-1R satellites was applied to detect the foggy area. First, we used a radiation transfer model to investigate the possibility of fog detection with DCD method. In order to improve the detection method with the DCD, we designed combination method using the texture-related measurement and the weak wind condition as well as the DCD. The following threshold values are drawn from this study.
• We used the DCD method for the first step of detection. To decide the probable area of sea fog, we took the threshold of -2.0 K based on twelve cases over the Yellow Sea. This threshold value was used as a criteria to determine fog and low cloud.
• The wind data of QuikSCAT were examined as weak wind conditions less than threshold of 8 m s-1 under stable condition of the surface wind around a fog event. This wind speed criteria is applicable to the separation of fog from low cloud.
• A Laplacian calculation in the horizontal distribution of brightness temperature is proposed as a measure of homogeneity for the sea fog which is homogeneous rather than low cloud. The threshold values of Laplacian of BT are obtained as 0.1 from sea fog cases over the Yellow Sea.
To validate the new combined DCD method in determining fog area, we applied the scoring methods such as Heidke skill score, probability of detection, probability of false detection, true skill score and odds ratio. The validation results reveal that the present method improves the sea fog detection and quantitatively separating fog from low cloud, which is seen in the scores of POFD. However, for the fog case with the high densed low cloud, the present method does not act to improve the separation of fog.
References
Anthis, A. L., and A. P. Cracknell, 1999. Use of satellite images for fog detection (AVHRR) and forecast of fog dissipation (METEOSAT) over lowland Thessalia, Hellas.
Int. J. Remote Sensing, 20, pp.1107-1124.
Bader, M. J., J. R. Forbes, J. R. Grant, R. B. Lilley, and Waters, A. J., 1995. Images in weather forecasting:
practical guide for interpreting satellite and radar data.
University Press, Cambridge.
Ellord, G. P., 1995: Advances in the detection and analysis of fog at night using GOES multispectral infrared imagery. Wea. Forecasting, 10, 606-619.
_____, 2000: Proposed improvements to the GOES nighttime fog product to provide ceiling and visibility information. Preprints, 10th Conf. on Satellite Meteorology and Oceanography, Long Beach, CA, Amer.
Meteor. Soc., 454-456.
Eyre, J. R., J. L. Brownscombe, and R. J. Allam, 1984:
Detection of fog at night using Advanced Very High Resolution Radiometer(AVHRR) imagery. Meteorol.
Mag., 113, 265-271.
Heo, K. Y., K. J. Ha, 2004: Classification of Synoptic Pattern Associated with Coastal Fog around the Korean Peninsula. J. Korean Metor. Soc., 40, 541-556 (in Korean with English abstract).
Park, H. S., Y. H. Kim, A. S. Suh, and H. H. Lee, 1997:
Detection of fog and the low stratus cloud at night using derived dual channel difference of NOAA/AVHRR data.
Proceeding of the 18th Asian conference on remote sensing, 20-24 Oct. Kuala lumpur, Malaysia.
Acknowledgements
This work was supported by grant of “Eco-Technopia 21 Project” by Korean Ministry of Environment. This work was also supported by the Brain Korea 21 Project in 2006 and the Korean Ocean Research Development Institute via a project on Utilization of Marine Meteorological Data in Ieodo Ocean Research Station.