Printed in the Republic of Korea
http://dx.doi.org/10.5012/jkcs.2011.55.5.733
Statistical Study For The prediction of pKa Values of Substituted Benzaldoxime Based on Quantum Chemicals Methods
Emad A.S. Al-Hyali*, Nezar A. Al-Azzawi, and Faiz M.H. Al-Abady
†Department of Chemistry, College of Education, University of Mosul, Mosul, Iraq.
*E-mail: [email protected]
†
Department of Chemistry, College of Science, University of Tikrit, Tikrit, Iraq (Received October 19, 2010; Accepted August 4, 2011)
ABSTRACT. Multiple regression analysis was used for the calculation of pKa values of 15 substituted benzaldoximes by using various types of descriptors as parameters. These descriptors are based on quantum mechanical treatments. They were derived by employing semi-empirical calculation represented by the PM3 model and an Abinitio method expressed by Har- tree-Fock(HF) model performed at the 6-311 G(d, p) level of theory. The parameters tested for their ability to represent the variations observed in the experimental pKa(s) are atomic and structural properties including Muliken charges on the atoms of hydroxyl group and C=N bond, the angle C
6-C
1-C
7, and length of O-H bond. Molecular properties are also used like ener- gies of HOMO and LUMO, hardness(η), chemical potential(µ), total energy(TE), dipole of molecule(DM), and elec- trophilicity index(W). The relation between pKa values and each of these parameters of the studied compounds is investigated. Depending on these relations, two sets of parameters were constructed for comparison between the PM3 and HF methods. The results obtained favor the Abinitio method for such applications although both models proved to have high pre- dictive power and have sufficient reliability to describe the effect of substituents on pKa values of benzaldoxime compounds under consideration which is clear from the values of correlation coefficient R
2obtained and the consistency between the experimental and the calculated values.
Key words: pKa value, Benzaldoxime, PM3, Ab initio
INTRODUCTION
Oximes are well known compounds with a general functional group (-C=N-OH). They are the condensation products of hydroxyl amines with aldehydes (forming aldoxime), ketones (forming ketoxime), or quinone. The aldoxime exists only as a syn isomer, where as benzal- doxime as (aromatic aldoximes) exist in syn and anti iso- mers. These two geometrical isomers have very different properties.
Oximes are very important compounds. They have wide application and were used in various fields. They were used as analytical reagents.
1Cyclohexanone oxime is converted into its isomer epsilon-caprolactam which represents the raw material for the synthesis of nylon-6.
2The amides obtained by Beckmann rearrangement can be converted into amine by hydrolysis, which could be employed as starting materials for the manufacture of dyes, plastic, fibers and pharmaceuticals.
Oximes can be used as peel-preventing additives in paints and lacquers. They act as antioxidants against oxi- dative drying materials which form sticky skin with air oxygen.
Another effect of anti-skinning offers drying time delay
which can be used in formulating paints. Oximes are also used as chemical building block for the synthesis of agro- chemicals and pharmaceuticals.
In medicine application, oxime structure is found to be effective in cholinesterase reactivators to treat the poi- soning by organo-phosphates.
3Oximes are used as ligands in transition metal complex
catalyst chemistry. Oxime acts as anti oxidant, radical
scavenger which found applications in textile, plastic,
paint, detergent, and rubber industry. They have there-
fore, long been the goal of many researchers in different
areas of chemistry. The knowledge of pKa values pro-
vides a basis for understanding the chemical reactions
between the compound of interest and pharmacological
target. Additionally, they play a major role in acid-base
titration, complex formation and many other analytical
procedures.
4The pKa value of a compound is therefore, a
very important chemical phenomenon (among others)
that influences many characteristics such as its reactivity
and spectral properties. Its importance lies in that such
value is affected by the nature and location of substituents
present on the compound.
5The pKa values are therefore
sensitive to the variation of inductive effect (which may
result from formal charges or dipole within a molecule)
and steric effect that arise from spatial interaction between adjacent groups within the molecule. Since such effects can be evaluated by quantum chemical methods,
8-11cer- tain parameters might serve as useful descriptors for understanding the physical and chemical effects of sub- stituents on the pKa values of the benzaldoxime com- pounds under consideration.
In order to find how far experimental finding are reflected in theoretical predictions and what kind of infor- mation can be extracted from such investigation, the present work examines the applicability of quantum chemical parameters derived from PM3 and HF methods as descriptors for substituents effects on the pKa values of benzaldoximes. Several sets of parameters were derived for the theoretical predictive of pKa values by regression analysis.
METHODS
In order to determine the conformation of the lowest energy for each molecule of the fifteen benzaldoxime compounds listed in Table 1, full geometrical optimiza- tion was carried out at the level of semi-empirical PM3 methods as well as Hartree-Fock(HF) using gradient technique
13,14and 6-311 G(d,p) basis set. At the semi-
empirical PM3 level, geometries of all possible conform- ers were optimized, while Ab initio [HF/6-311 G(d,p)]
optimization was performed only for the most stable con- former found with PM3 method. In all cases, the com- pletion of optimization in order to ensure obtaining geometry with minimum energy was examined.
The optimized geometries were used for evaluation of natural atomic charges and structural parameters such as total energy (TE), dipole moment (DM), Angles, O-H bond length, the highest occupied molecular orbital energy (E
HOMO), the lowest unoccupied molecular orbital energy (E
LUMO). The values of E
HOMOand E
LUMOwere used for the calculation of other molecular properties, namely; hardness ( η),
15chemical potential ( µ),
16and elec- trophilicity index (W) as illustrated in the following equa- tion:
µ = (E
HOMO+ E
LUMO)/2 (1)
η = (E
HOMO– E
LUMO)/2 (2)
W = ( µ
2/2 η) (3)
The Chem. Office Program (V.11, 2008 of Cambridge Software, USA) was employed for the performance of conformational analysis and determination of final equi- librium geometries and the calculations of all the quan- tum chemical descriptors.
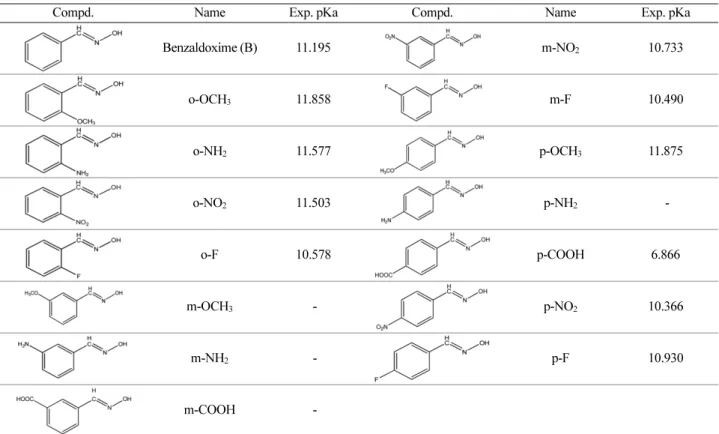
Table 1. Structure and experimental pKa values of the benzaldoximes considered for this study
Compd. Name Exp. pKa Compd. Name Exp. pKa
Benzaldoxime (B) 11.195 m-NO
210.733
o-OCH
311.858 m-F 10.490
o-NH
211.577 p-OCH
311.875
o-NO
211.503 p-NH
2-
o-F 10.578 p-COOH 6.866
m-OCH
3- p-NO
210.366
m-NH
2- p-F 10.930
m-COOH -
Multiple Linear Regression(MLR)
18MLR analyses were carried out in order to correlate the experimental pKa values to the electronic and structural variables obtained by quantum chemical calculations. The MLR can be expressed by the following equation:
pKa = b + Σa
ix
i(4)
Where b is a constant and represents a reference value, x
i(s) the parameters selected for the regression and a
i(s) the coefficients of the parameters. The MLR calculations were performed by the SPSS package V.12 for windows.
The correlation coefficient (R) and standard error (SE) were utilized as an indication of the linearity and stability of the chosen model.
RESULTS AND DISCUSSION
The assessment of pKa values of hypothetical com- pounds is of prime interest. The knowledge strength of acid which required to protonate a compound is of great importance for the investigation of the kinetic and mech- anism of organic reactions.
19,20The protonated fraction is also of special significance in the studies of absorption, distribution and eventual excretion of drugs, depending on the active substance which contains acidic of basic functional groups, which are ionized to varying degrees at physiological pHs. The influence of acidity constant on biological activity has been reviewed by many researcher groups.
21-23In this paper the experimental pKa values of benzal- doxime derivatives considered have been evaluated using a half integral potentiometric method.
12These values are correlated with some descriptors derived by the help of quantum chemical calculation which are basically elec- tronic and energy related values and they are thought to be capable of describing the effect of substituents on pKa values successfully. The parameters used as descriptors for pKa variation in this work are derived by two methods namely, PM3 (as a semi empirical method, RMS gradient
= 0.1, Algorithm=Beeman) and HF carried out at base set [6-311 G(d,p)] as an Ab initio model.
In developing pKa models, it is reasonable to expect that variations in the pKa should be correlated in some way with the electronic charges at the dissociating posi- tions.
24For the benzaldoximes, we found that atomic charges on the functional group heavy atoms (O of the OH) and the acidic hydrogen in OH can serve as good regression parameters.
9-11The pKa values of OH group vary with substitution, increasing with electron donating
groups and decreasing with electron withdrawing groups.
The substitution on the benzene ring affect the charge on the C=N group in addition to the length of O-H bond and determine the type of interactions that OH group under- goes (specially at the ortho position) which in turn affect the energy and geometry of the molecules and pKa value as a result.
A variety of parameters were used for the calculation of pKa theoretically.
8,25,26These parameters are based on quantum chemical methods (non of these studies used these parameters for the calculation of pKa of benzal- doximes) namely PM3 and HF. The Muliken partial atomic charges on the H and O atoms (of the OH group), N and C (of the C=N group) are thought to correlate well to the pKa values of the studied compounds in spite of their shortcoming.
26The other parameters considered as descrip- tors for the pKa values and employed in this analysis are the total energy of molecule (TE), dipole of molecule (DM) and angle (C
6-C
1-C
7) (see the structure below):
The Benzaldoxime Structure
Additional parameters were also tested such as the energy of HOMO and LUMO orbitals and the values of µ, η and W which are calculated as illustrated in equations (1), (2), and (3) respectively.
The values of all the mentioned descriptors calculated by PM3 and HF methods are given in Tables 2 and 3 respectively.
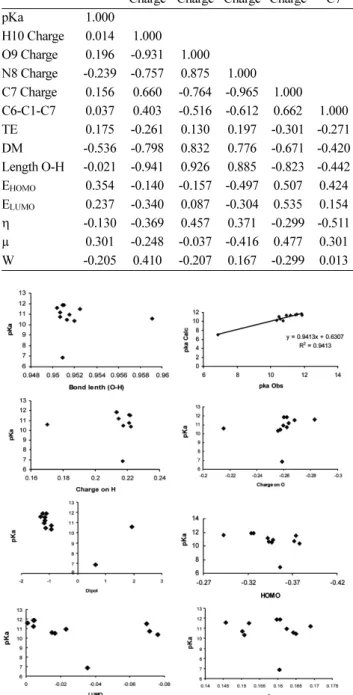
As a primary step, correlation among the selected parameters and the pKa values of the benzaldoxime com- pounds and among the parameters themselves are per- formed. The statistics results obtained for the performance of these parameters are listed in Table 4.
The correlation coefficient assumes a value between(-1) and (+1). If one variable tends to increase the other decrease, the correlation coefficient is negative. Conversely, if the variables tend to increase together the correlation coeffi- cient is positive.
The results of Table 4 show weak simple relations among
the pKa values and the other parameters. As expected sub-
stituents cause changes in the electronic density at the dis-
sociating functional groups in benzaldoximes. Good correlation
among the atomic charges of the hydroxyl group (O
9and
H
10) and the C=N group (C
7and N
8) are noticed. The rela-
tions among the atomic charges of these groups and the length of O-H bond were also strong. Additionally, sat- isfactory relations are seen between charges and the dipole of the molecules. Observation of the global elec- trophilicity index values show that, substitution of ben- zaldoxime with electron acceptor group increases its electrophilic activity, while, substitution with electron donor group results in electrophilic deactivation.
Table 4 and Fig. 1 show that, the relation between the pKa values and the global electrophilicity index is neg- ative slope. This is because, strong electrophilic reagent leads to low substrate selectivity in the form of low pKa
value. According to these variations we expected to find these parameters effective in the calculation of pKa val- ues statistically. The theoretical estimation of the pKa val- ues of the 15 substituted benzaldoximes considered in this study based on the quantum chemical parameters as descriptors for pKa are carried out statistically by multi- ple regression analysis method.
Depending on this statistical method, two predictive models have been build up for comparison between the Ab initio [HF/6-311 G(d,p)] and semi empirical(PM3) meth- ods, with the help of the variables used as descriptors and presented in Tables 2 and 3.
Table 2. Values of descriptors calculated by PM3 method Compd. H10
Charge O9 Charge
N 8 Charge
C 7 Charge
Angle
C6-C1-C7 TE DM O-H
Length (A) E
HOMO(ev)
E
LUMO(ev)
η (ev)
µ (ev)
W (ev) B 0.214 -0.263 -0.020 -0.053 122.581 -4.229 -1.159 0.9507 -0.342 -0.004 0.169 -0.173 -0.082 o-OCH3 0.213 -0.262 -0.031 -0.043 120.292 4.695 -1.229 0.950 -0.326 -0.004 0.160 -0.165 -0.078 o-NH2 0.221 -0.283 -0.066 -0.002 129.807 0.320 -1.305 0.950 -0.292 -0.001 0.145 -0.146 -0.072 o-NO2 0.221 -0.268 0.018 -0.133 120.168 4.108 -1.167 0.952 -0.373 -0.069 0.152 -0.221 -0.052 o-F 0.170 -0.215 0.071 -0.140 119.375 -0.897 1.928 0.959 -0.343 -0.014 0.164 -0.179 -0.075 m-OCH3 0.173 -0.218 0.065 -0.144 122.951 2.921 1.378 0.957 -0.331 -0.007 0.162 -0.169 -0.077 m-NH2 0.213 -0.261 -0.033 -0.044 123.908 -5.340 -1.154 0.951 -0.297 -0.009 0.148 -0.148 -0.074 m-COOH 0.215 -0.258 -0.016 -0.057 122.615 -3.232 0.642 0.950 -0.355 -0.026 0.164 -0.191 -0.070 m-NO2 0.221 -0.262 -0.007 -0.058 124.004 -5.690 -0.939 0.950 -0.372 -0.071 0.150 -0.221 -0.050 m-F 0.217 -0.257 -0.017 -0.055 123.801 -2.213 -1.126 0.951 -0.346 -0.016 0.165 -0.181 -0.074 p-OCH3 0.213 -0.260 -0.035 -0.038 124.349 3.567 -1.110 0.951 -0.323 -0.004 0.159 -0.164 -0.077 p-NH2 0.211 -0.263 -0.052 -0.024 124.259 -5.331 -1.170 0.951 -0.293 0.004 0.148 -0.144 -0.076 p-COOH 0.217 -0.258 -0.006 -0.067 122.682 -3.274 0.632 0.950 -0.356 -0.035 0.160 -0.195 -0.065 p-NO2 0.222 -0.255 0.005 -0.075 124.741 -6.131 -0.925 0.952 -0.377 -0.076 0.150 -0.226 -0.050 p-F 0.216 -0.259 -0.023 -0.048 124.159 -2.284 -1.182 0.951 -0.340 -0.023 0.162 -0.185 -0.071 Table 3. Values of the descriptors used as parameters calculated by HF method
Compd. H10 Charge O9
Charge N8 Charge C7 Charge
Angle
C6-C1-C7 TE DM O-H E
HOMO(ev)
E
LUMO(ev) η µ W
B 0.415 -0.601 -0.127 0.108 121.100 -398.320 -1.159 0.945 0.086 -0.315 -0.200 -0.114 -0.032
o-OCH3 0.414 -0.604 0.098 0.098 116.270 -512.130 -1.229 0.945 0.086 -0.315 -0.201 -0.114 -0.032
o-NH2 0.411 -0.603 -0.206 0.194 117.380 -453.350 -1.305 0.945 0.096 -0.281 -0.188 -0.092 -0.022
o-NO2 0.425 -0.591 -0.072 0.109 118.050 -601.720 -1.167 0.946 0.051 -0.352 -0.201 -0.150 -0.056
o-F 0.420 -0.601 -0.080 0.101 118.480 -497.170 1.928 0.945 0.079 -0.325 -0.202 -0.122 -0.037
m-OCH3 0.420 -0.601 -0.080 0.101 119.290 -497.170 1.378 0.945 0.081 -0.310 -0.196 -0.114 -0.033
m-NH2 0.418 -0.596 -0.122 0.106 119.480 -585.880 -1.154 0.943 -0.009 -0.297 -0.148 -0.148 -0.074
m-COOH 0.421 -0.596 -0.122 0.106 119.480 -585.880 0.642 0.943 0.048 -0.340 -0.194 -0.146 -0.055
m-NO2 0.421 -0.593 -0.125 0.199 118.890 -601.740 -0.939 0.945 0.032 -0.345 -0.188 -0.156 -0.064
m-F 0.419 -0.597 -0.120 0.110 119.240 -497.180 -1.126 0.945 0.073 -0.328 -0.200 -0.127 -0.040
p-OCH3 0.413 -0.603 -0.138 0.116 119.630 -512.180 -1.110 0.945 0.092 -0.299 -0.196 -0.103 -0.027
p-NH2 0.410 -0.606 -0.148 0.119 119.760 -453.350 -1.170 0.944 0.004 -0.293 -0.148 -0.144 -0.070
p-COOH 0.420 -0.596 -0.113 0.105 119.410 -585.900 0.632 0.945 -0.035 -0.356 -0.160 -0.195 -0.119
p-NO2 0.423 -0.592 -0.106 0.105 119.240 -601.740 -0.925 0.945 -0.076 -0.377 -0.150 -0.226 -0.170
p-F 0.417 -0.599 -0.127 0.111 119.110 -497.180 -1.182 0.945 -0.023 -0.340 -0.158 -0.181 -0.103
The first MLR model generated by variables based on the PM3 method. The results and the multiple regressions are given in Table 5.
Looking at the results of Table 5, the relation between pKa and the charges on O
9, N
8, length of O-H bond, and DM are of negative slope, which means that, the increase of the values of these descriptors increases the value of
Table 4. Correlation coefficients among the parameters evaluated by PM3 method Parameters pKa H10
Charge O9 Charge
N 8 Charge
C 7 Charge
C6-C1-
C7 TE DM O-H
Length E
HOMO(ev)
E
LUMO(ev) η µ W
pKa 1.000
H10 Charge 0.014 1.000 O9 Charge 0.196 -0.931 1.000 N8 Charge -0.239 -0.757 0.875 1.000 C7 Charge 0.156 0.660 -0.764 -0.965 1.000 C6-C1-C7 0.037 0.403 -0.516 -0.612 0.662 1.000 TE 0.175 -0.261 0.130 0.197 -0.301 -0.271 1.000 DM -0.536 -0.798 0.832 0.776 -0.671 -0.420 0.080 1.000 Length O-H -0.021 -0.941 0.926 0.885 -0.823 -0.442 0.274 0.771 1.000 E
HOMO0.354 -0.140 -0.157 -0.497 0.507 0.424 0.092 -0.193 -0.080 1.000 E
LUMO0.237 -0.340 0.087 -0.304 0.535 0.154 0.197 0.034 0.065 0.857 1.000 η -0.130 -0.369 0.457 0.371 -0.299 -0.511 0.193 0.426 0.270 -0.291 0.243 1.000 µ 0.301 -0.248 -0.037 -0.416 0.477 0.301 0.149 -0.083 -0.008 0.964 0.963 -0.027 1.000 W -0.205 0.410 -0.207 0.167 -0.299 0.013 -0.229 -0.127 -0.136 -0.687 -0.962 -0.492 -0.854 1.000
Table 5. Summary of the regression analysis results between pKa values and descriptors calculated by PM3 method
Parameter a b R S.E
C7 N8
-23.59
-34.901 8.825 0.325 1.468 O9
H10
-82.173
-80.352 6.626 0.420 1.409 Angl
TE
0.195
0.106 -2.137 0.528 1.318 Len O-H
H10
-31.294
-3.503 41.262 0.026 1.552 DM
O9
-1.658
70.192 27.743 0.702 1.105 DM
O9 TE
-1.584 71.080 0.151
28.189 0.815 0.961 DM
O9 Len O-H
-2.006 -7.954 709.092
-667.708 0.885 0.773 DM
O9 Len O-H
H10
-2.247 -36.785 355.361 -109.984
-315.128 0.970 0.434
DM O9
W H10
-2.499 -47.041
47.006 -203.749
43.545 0.991 0.245
DM O9
W H10
N8
-2.498 -45.962
48.129 -204.321
-0.804
44.015 0.991 0.268
DM O9 N8 H10 Angl η
-2.443 -20.750
5.993 -159.064
-0.046 -62.042
53.226 0.994 0.249 Fig. 1. Relations among pKa values and selected descriptors cal-
culated by PM3 method (Step interval = 2.0fs, Frame interval =
10fs, Period = 38-42 seconds).
pKa and decrease the ionization efficiency of the mole- cules. The values of the coefficients of O
9, N
8and length of O-H bond indicate great influence of such descriptors on pKa values, which suppose that, the withdrawing sub- stituents increase the ionization efficiency of the mole- cules.
The charge on the atoms C
7, H
10, angle and TE have opposite effect on the pKa values. The simple correlation coefficients obtained from correlating the pKa values and each of these descriptors found separately are weak but was found to increase significantly in the multiple regres- sion analysis. The results of the regression analysis of pKa values build up with the help of the parameters calculated by the PM3 method are summarized in Table 5. In this model we have generated various equations by employ- ing the entire variables shown in Table 2. The best fitted equations of this class are the following two in which 4 and 6 variables are used respectively.
pKa = 43.545 - 2.499 DM - 47.041 Charge of O
9+ 47.006 W - 203.749 charge of H
10(5)
pKa = 53.226 - 2.443 DM - 20.750 charge of O
9+ 5.993 charge of N
8- 159.064 charge of H
10- 0.046 Angle - 62.042 η (6)
Preference is given to Eq. (5) in which less number of parameters is used to describe the substituents effect on pKa with negligible differences to that of 6 parameters.
This model (eq. 5) includes the partial Muliken charges on the atoms of OH group, DM and W. these values are elec- tronic and molecular properties and have been tested as
pKa descriptors for other types of compounds in previous studies.
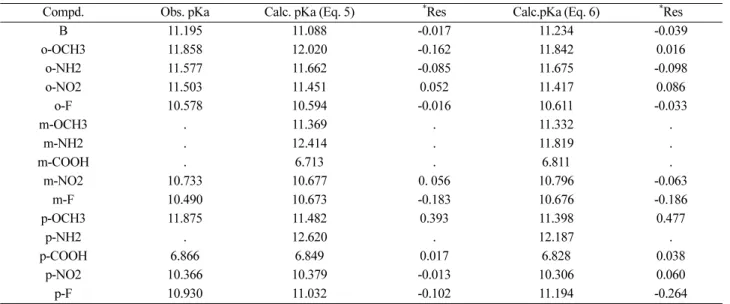
26-28The values of the experimental and calculated pKa using (eq. 5 and 6) with comparison between the exper- imental and predicted values of pKa of the considered benzaldoximes are reported in Table 6. On the basis of the statistical quality of result, it is clear that, one can use this equation to predict the pKa values of hypothetical com- pounds of similar type as was done for the compounds m- OCH
3, m-NH
2, m-COOH and P-NH
2which were not included in the regression analysis.
A linear relation is obtained (with R > 0.97) from the plot of the experimental pKa versus the calculated values indicating to high prediction power and reliable method for such applications.
The second MLR model has been formed with the help of the descriptors derived by HF [6-311 G(d, p)] method.
In this model, various equations have been generated (Table 7). The best fitted equations are the following two:
pKa = -1665.177 - 195.988 Charge of O
9- 2.435 DM + 1632.195 Length of O-H - 0.007 TE (7)
pKa = -1660.158 - 2.436 DM - 0.007 TE + 1637.221 Length of OH - 196.374 Charge of O
9- 0.059 W (8) Preference may be given to Eq. (8) since better corre- lation effect is noticed even though one more parameter (W) is used. The predicted pKa values from Eq. (7) and (8) are given in Table 8. On the basis of this model, we can also justify the validity of the selected descriptors for such applications.
Table 6. Comparison between the observed and calculated pKa values evaluated by the PM3 method
Compd. Obs. pKa Calc. pKa (Eq. 5)
*Res Calc.pKa (Eq. 6)
*Res
B 11.195 11.088 -0.017 11.234 -0.039
o-OCH3 11.858 12.020 -0.162 11.842 0.016
o-NH2 11.577 11.662 -0.085 11.675 -0.098
o-NO2 11.503 11.451 0.052 11.417 0.086
o-F 10.578 10.594 -0.016 10.611 -0.033
m-OCH3 . 11.369 . 11.332 .
m-NH2 . 12.414 . 11.819 .
m-COOH . 6.713 . 6.811 .
m-NO2 10.733 10.677 0. 056 10.796 -0.063
m-F 10.490 10.673 -0.183 10.676 -0.186
p-OCH3 11.875 11.482 0.393 11.398 0.477
p-NH2 . 12.620 . 12.187 .
p-COOH 6.866 6.849 0.017 6.828 0.038
p-NO2 10.366 10.379 -0.013 10.306 0.060
p-F 10.930 11.032 -0.102 11.194 -0.264
*Res = Calc. pKa - Obs. pKa
A linear relationship (Fig. 2) is obtained from the plot of the experimental pKa against the calculated values with high correlation coefficient (R > 0.99). A final conclusion can be driven in which, the comparison between the Ab initio [HF/6-311 G(d,p)] and the semi empirical(PM3) indicates reasonable correspondence between the two methods. Both of them gave high correlation coefficients and acceptable deviation.
CONCLUSION
The predictive powers of a semi empirical(PM3) and ab initi (HF) methods have been successfully conducted for the determination of the substituents effect on the pKa val- Table 7. Results of the regression analysis between the pKa values
and parameters estimated by HF method
Parameter a b R S.E
C7 N8
25.607
8.057 8.562 0.416 1.412
O9 H10
-2.994
-111.474 55.575 0.356 1.451 Angl
TE
0.009
-0.414 64.643 0.524 1.232 Len O-H
H10
-212.919
2820.015 -2565.641 0.638 1.196 H10
Len O-H O9
-245.976 2849.371 33.978
-2559.222 0.640 1.127 C7
O9 DM
-3.656 -75.296
-2.335
-35.898 0.924 0.636 O9
DM H10
-158.188 -2.430 107.067
-130.811 0.933 0.598 O9
DM Len O-H
-116.713 -2.174 1703.647
-1671.245 0.981 0.345 O9
DM N8 H10
-73.368 -2.419
4.553 16.208
-41.559 0.955 0.530
O9 DM Len O-H
W
-134.270 -2.213 1881.176
-2.135
-1849.723 0.982 0.343
O9 DM Len O-H
TE
-195.988 -2.435 1632.195
-0.007
-1655.177 0.999 0.076
N8 O9 H10 DM Ang
1.887 -107.679
63.614 -2.429 -0. 229
-55.050 0.940 0.482
DM TE Len O-H
O W
-2.436 -0.007 1637.221
-196.374 -0.059
-1660.158 0.999 0.0837
Table 8. Comparison between the observed and calculated pKa values estimated by the HF method
Compd. Obs. pKa Calc. pKa (Eq. 8)
*
Res Calc. pKa (Eq. 7)
*