1. Introduction
Land subsidence due to groundwater depletion is a global phenomenon occurred due to over-exploitation of sub-surface groundwater for domestic and industrial supply. In recent years, due to the rapid development of major cities in terms of industries and population, both surface and groundwater are becoming inadequate to satisfy the industrial, domestic and irrigational water needs. In the Kathmandu basin, the capital of Nepal having dense population has undergone severe groundwater extraction in the recent years (Pandey et al., 2010). Previous studies have reported that the
groundwater extraction rate is much higher than the aquifer’s recharge rate in the basin (Pandey et al., 2010). These trends may lead to the land subsidence in the sedimentary basin.
Land subsidence due to the groundwater extraction can be monitored using several techniques. Ground- based methods such as Leveling (Chen et al., 2007) and Global Positioning System (GPS) (Abidin et al., 2001) are able to measure accurate ground motions.
However, Leveling requires adequate manpower and time consuming to observe displacements over sparse points. Whereas, permanent GPS stations can provide reliable vertical and horizontal displacements
Subsidence Due to Groundwater Withdrawal in Kathmandu Basin Detected
by Time-series PS-InSAR Analysis
P.V.Suresh Krishnan*, and Duk-jin Kim *†
*School of Earth and Environmental Sciences, Seoul National University
Abstract : In recent years, subsidence due to excessive groundwater withdrawal is a major problem in the Kathmandu Basin. In addition, on 25 April 2015, the basin experienced large crustal displacements caused by Mw 7.8 Gorkha earthquake. In this study, we applied StaMPS- Persistent Scatterer InSAR (StaMPS PS-InSAR) technique to estimate the spatio-temporal displacements in the basin after the mainshock. 34 Sentinel-1 C-band SAR data are used for measuring subsidence velocity during 2015-2017. We found the maximum subsidence velocity of about 9.02 cm/year and mean subsidence rate of about 8.06 cm/year in the line of sight direction, respectively, in the central part of the basin.
Key Words : Subsidence, Groundwater, Kathmandu, PS-InSAR Korean Journal of Remote Sensing, Vol.34, No.4, 2018, pp.703~708
http://dx.doi.org/10.7780/kjrs.2018.34.4.12 ISSN 1225-6161 ( Print )
ISSN 2287-9307 (Online)
Article
Received July 30, 2018; Revised August 14, 2018; Accepted August 27, 2018; Published online August 29, 2018
†Corresponding Author: Duk-jin Kim ([email protected])
This is an Open-Access article distributed under the terms of the Creative Commons Attribution Non-Commercial License (http://creativecommons. org/licenses/by-nc/3.0) which permits unrestricted non-commercial use, distribution, and reproduction in any medium, provided the original work is properly cited.
continuously only at the station for a period of time.
In recent years, space-borne earth observations using interferometric synthetic aperture radar (InSAR) technique is applied to measure the ground motions caused by various geohazards (Tomás and Li, 2017).
Previous studies (Pandey et al., 2012; Pandey and Kazama, 2011) have monitored the land subsidence caused by over-exploitation of groundwater. In this study, we applied time-series persistent scatterer interferometric analysis (PS-InSAR) to monitor the land subsidence in the Kathmandu basin, Nepal.
2. Study Area
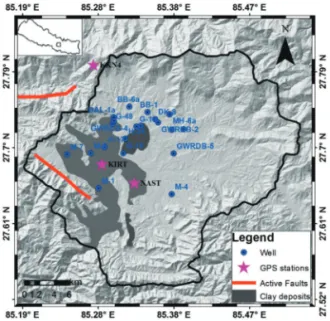
The Kathmandu basin located in the lesser Himalayas is a densely populated city in Nepal (Fig. 1). The basin is mainly composed of fluvio-lacustrine and fluvio-deltaic sediments, which consists of peat, clay, carbonaceous clay, sand, gravel and boulders (Moribayashi and Maruo, 1980). Based on the gravimetric survey carried out by (Cresswell et al., 2001; Moribayashi and Maruo, 1980), the thickness of fluvio-deltaic sediments is about 650 m (Fig. 1). The
basin is divided into the following lithostratigraphic units (Fig. 1): The Lukundol and Itachi in the south, the Gokarna, and Thimi in the north and Bagmati, Kalimati and Patan in the center. There are two active faults are located around the Kathmandu valley. Considering the hydrogeological conditions in the basin, groundwater for domestic and industrial use is mainly extracted from shallow and deep aquifers separated by a thick clay layer (aquitard) (Fig. 1).
3. Data used and InSAR processing
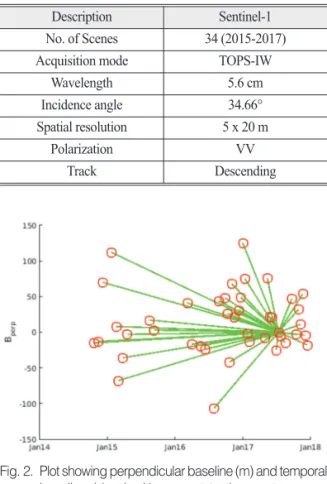
In this study, we acquired 34 scenes from C-band Sentinel-1 sensor to measure the subsidence in the Kathmandu basin, Nepal from 2015/05 to 2017/12 (Table 1). The detailed description of the SAR data used in this study is listed in Table 2.
Fig. 1. Study area showing the location and the boundary of the Kathmandu Basin, Nepal geological formations, monitoring wells, and GPS stations.
Table 1. List of SAR data used in this study with baseline information corresponding to the single master scene (2017/07/11)
S.No. Slave Bperp (m) Btemp (days)
1 20150815 17 696
2 20150908 3 672
3 20160306 41 492
4 20160330 -17 468
5 20160517 -19 420
6 20160610 -24 396
7 20160728 -107 348
8 20160821 44 324
9 20160926 48 288
10 20161008 26 276
11 20161020 -42 264
12 20161101 68 252
13 20161113 21 240
14 20161207 31 216
15 20161219 49 204
16 20161231 125 192
17 20170112 75 180
18 20170124 -2 168
19 20170205 -13 156
20 20170430 -8 72
21 20170512 76 60
We applied StaMPS PS-InSAR (Hooper et al., 2004) technique in this study to estimate the time- series displacements in the Kathmandu basin. In this processing, the master scene is chosen based on minimum geometric and temporal decorrelation.
Multi-looked (10 × 2) differential interferograms stack were generated with the single master scene (2017/07/11). The perpendicular baseline (Bperp) and temporal baseline (Btemp) information for each InSAR pair can be seen in Fig. 2. All the interferograms pairs are having perpendicular baseline less than 150 m. In order to remove topographic phase contribution in the interferometric phase, 30 meter SRTM digital elevation model is used in this processing. Since most of the parts in the study area consists of urban features, the coherence was maintained very well. However, the coherence has been greatly reduced in the mountainous regions.
Subsequently, the time-series InSAR processing was performed by applying StaMPS algorithm (Hooper et al., 2004) as shown in Fig. 3.
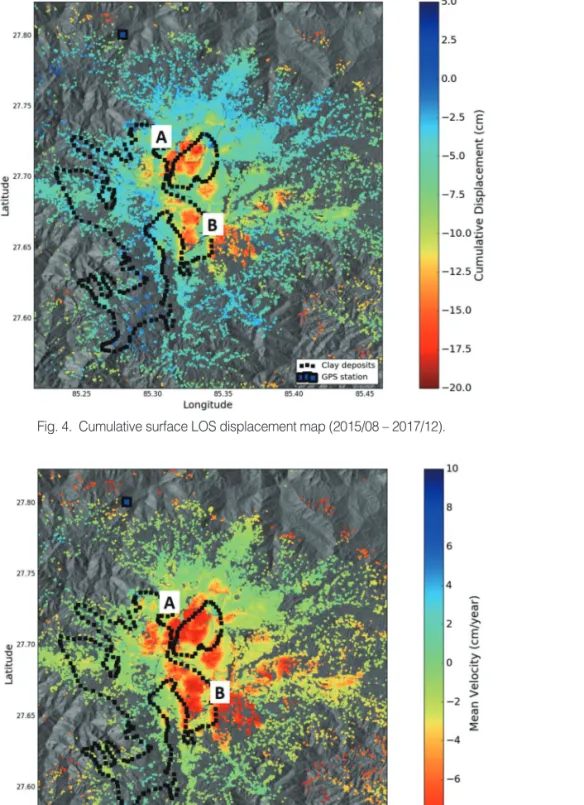
4. Results and Discussion
The cumulative surface displacement map is presented in Fig. 4, spanning from the year 2015 to 2017. The central part of the Kathmandu basin is found to be subsided significantly in the LOS direction i.e., Location A, B in Fig. 4. The obtained PS-InSAR results in Fig. 4 and 5 are with respect to the reference point (blue square), selected close to the KKN4 GPS station, which is located away from urban part of Kathmandu basin. Because KKN4 GPS station is appears to be nearly stable compared to other part of the basin.
Table 1. Continued
S.No. Slave Bperp (m) Btemp (days)
22 20170524 22 48
23 20170605 21 36
24 20170629 -25 12
25 20170723 -5 -12
26 20170816 -15 -36
27 20170921 47 -72
28 20171015 -3 -96
29 20171027 32 -108
30 20171108 11 -120
31 20171120 54 -132
32 20171202 -4 -144
33 20171214 -18 -156
Table 2. Description about SAR data used in this study
Description Sentinel-1
No. of Scenes 34 (2015-2017)
Acquisition mode TOPS-IW
Wavelength 5.6 cm
Incidence angle 34.66°
Spatial resolution 5 x 20 m
Polarization VV
Track Descending
Fig. 2. Plot showing perpendicular baseline (m) and temporal baseline (days) with respect to the master scene (2017/07/11).
Fig. 3. StaMPS PS-InSAR Processing flow used in this study (Hooper et al., 2004).
Therefore, the mean velocity at the reference point will be zero. Apart from KKN4 station, NAST and KIRT GPS stations are affected by severe ground motions and
discontinuous in the observation. Therefore, cumulative displacement, subsidence rate in the LOS direction are obtained with respect to the KKN4 GPS station. The
Fig. 5. Mean LOS Displacement rate map (cm/year) from (2015/08 – 2017/12).
Fig. 4. Cumulative surface LOS displacement map (2015/08 – 2017/12).