Print ISSN: 1738-3110 / Online ISSN 2093-7717 http://dx.doi.org/10.15722/jds.18.6.202006.25
A Study on the Behavior of the User according to the Distribution Development of Online Travel Agency
So-Ra MIN
1, Sun-Mi LEE
2Received: May 13, 2020. Revised: May 26, 2020. Accepted: June 05, 2020.
Abstract
Purpose: Travel agencies have use digital tools in order to shift the paradigm in how business is conducted. Online travel agencies provide the same services as a normal travel agency, including hotels, transportation, guided tours, reservations, and related services, but using an ―online platform. Travelers planning a trip can use a lot of forms to collect information and have access to a larger amount of information, so the factors that influence the user's behavioral intention are very important. This research has the conducted to find what factors lead to the attitudes of consumers in using OTA using the UTAUT model. Research design, data and methodology: The object of this study were respondents of a google survey using convenient sample extraction method, chosen among consumers who gathered information, or purchased a product. A total of 217 of the 235 questionnaires Google survey answered were used in the final analysis, excluding insincere responses. Using PSS v.21 and AMOS v.21, frequency analysis, feasibility and reliability analysis, path analysis was performed. Results: UTAUT affects OTA use satisfaction and trust, and OTA satisfaction and trust affect behavior intention.
Conclusions: Research was conducted using the UTAUT model to explore factors that affect the attitudes of users of online travel agencies (OTA).
Keywords: Online Travel Agencies (OTA), UTAUT, Satisfaction, Trust JEL Classification Code: L15, L86, M31.
1. Introduction
56E-commerce has a new trend where national businesses are taking advantage of O2O business model providing services consumers, who are doing more online shopping than offline shopping. Statistical Office (2020) announced a trend in shopping, as compared to the same month the year before, there is a 15.6% increase. Moreover, mobile shopping consists of 66.8% of the sales, as twice as much as usage of PCs. Online shopping has a total spending of
1 First Author, Assistant professor, Osan University, Korea.
Email: [email protected]
2 Corresponding Author, Adjunct Professor, Voegol Airlines, Hanyang Women’s University, Korea.
Email: [email protected]
ⓒ Copyright: The Author(s)
This is an Open Access article distributed under the terms of the Creative Commons Attribution Non-Commercial License (http://Creativecommons.org/licenses/by-nc/4.0/) which permits unrestricted noncommercial use, distribution, and reproduction in any medium, provided the original work is properly cited.
1.23906 trillion won, of which 12.5% being on travel and transportation, which adds up to 1.5438 trillion won. In other words, travel agencies as well as tourism bureaus are using this information ramp up their O2O business model as it is necessary for survival. Also, more and more prospective travelers are using online sources using both PCs and mobile devices, researching destinations and modalities of travel, therefore making traditional travel agencies obsolete.
So, online travel agencies (OTA) in order to be
successful, need to meet or exceed the trust and satisfaction
of prospective travelers. This swinging trend of online
shopping has prompted even offline, brick and mortar shops
to form APPS, webpages, and other social media presence
in order to capture the global online shoppers. This is
creating a competitive market among the agencies,
promoting differentiation among companies to capture the
consumers. The effort to capture the online market has
made it difficult for companies offering more choices,
better prices, ease of change without restrictions.
The travel agencies have put even more emphasis on the online shoppers, and as the competition gets fierce, the travel agencies are finding it hard to keep the level of service available to the consumers, therefore losing their trust (Chen, Wang, & Hwang, 2020). Not only that, as the number of online shoppers grow, their complaints are also growing. According to the study among Korean shoppers, in 2016 there were 884 complaints, but in 2018 there were 4688 complaints, meaning the number of complaints went up 5-fold in 2 years. Therefore, in order for online travel agencies to grow, they need to figure out a way to increase the trust and satisfaction of travelers. So, looking at the current trend OTA, companies and their representatives need to understand this unique feature in order to grow and flourish.
This report will look at the way consumer complaints are being handled, without the due consideration for special characteristics, are the root of repeated complaints by consumers. This report will use the TRA, theory of reasoned action, and also use Unified theory of acceptance and use of technology, allowing an outsider to see where the Trust Value and Satisfaction Value of consumers are falling short, and using that information, gauge how the online shoppers Intention to Act will be affected.
2. Review of previous studies 2.1. Online Travel Agency
In the past, due to the complexities of travel, the only way to gather travel information was through a travel agent.
As the digital age bloomed, the complexities have eased to the point where a consumer can do all the research online without having to contact a travel agent as before. Because of this, there has been a paradigm shift as many of the travel agencies are providing online services (Park, 2019).
All of online travel agencies abide proper laws and regulations, and they specialize in flights rental cars, hotels, and tour packages using an online platform not only to gather information but also differentiate by being able to reserve and pay for services using an online platform as their specialty (Coo, 2017). Recently OTA have been in collusion with 020 companies, and are giving away, as a service, travel packages, and this is creating an ambiguous situation with offline and online companies. Therefore, travel companies and O2O need to justify their concepts.
However online travel agencies research concepts and justification existing degree and the tourist companies associated companies have suggested a universal travel agency‘s function as a travel agency who gifts travel packages online.
So, this justification for online travel agencies is a fragmentary explanation and therefore the differentiation of travel agencies that only do online versus both on and offline business needs to be clarified. This study proposes to online travel agencies to exist as a concept that combines both the online and O2O business model that sells, and reserves travel packages.
2.2. Universal Technology Acceptance Theory:
UTAUT
New study has been done to show how a consumer accepts new technology information system in a psychosocial way (Lee, 2011).
Theory that explains the attitudes of information gatherers is called the Technology Acceptance Model (TAM), which has been criticized for not taking into account the external factors that affect the acceptance of technology, and so a TAM2 was created in order to have external factors of 5 fixed and 2 variable added, and furthermore, in order to expand the usability for users, a TAM3 was developed (Song & Kim, 2018).
Using Technology acceptance model‘s shortcomings in explanatory power limitations, UTAUT developed Theory of reasoned action, TRA, and further expanded to suggest the theory of planned behavior, TPB which has 7 components. TAM and TMB combine to form the Motivational Model, MM, Model of PC utilization, MPCU, Innovative Diffusion Theory, IDT, Social Cognitive Theory, SCT all form the background. UTAUT uses the 8 different theories as a combinant theory (Wu & Lee, 2017).
Specifically, UTAUT suggests that the intentions to act are affected by as key factors, performance, effort and societal effects as independent factors, intentions to act or usage behavior are affected by variables of sex, age, experience, usage spontaneity (Song, 2017).
UTAUT and TAM as models are recently accepted as technological environment but the Performance Expectation Effort Expectation and personal trust as a cognitive factor are considered (Chen et al., 2020). Researchers are debating that in the more complicated modern technology industry environment, whether or not the UTAUT is a proper model.
The individual wanting to use their skill, and their desire
to depend on their own skill, and the fact that when a
consumer gains additional skills, thus earning more for their
newfound skill, consider this new factor of pleasure motive
and habit, increase the price value, a UTAUT 2 was
developed (Chen et al., 2020). Using the previous research
using the UTAUT, online commerce related studies have
been completed. And even though OTA has been a part of
online commerce, using UTAUT for OTA has not been
attempted.
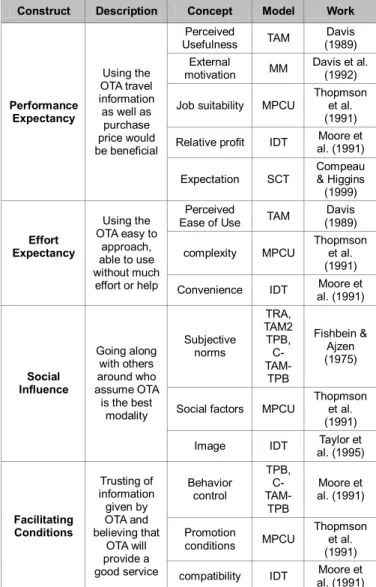
Table 1: UTAUT Related Literature
Construct Description Concept Model Work
Performance Expectancy
Using the OTA travel information as well as
purchase price would be beneficial
Perceived
Usefulness TAM Davis (1989) External
motivation MM Davis et al.
(1992)
Job suitability MPCU Thopmson et al.
(1991) Relative profit IDT Moore et
al. (1991)
Expectation SCT Compeau
& Higgins (1999)
Effort Expectancy
Using the OTA easy to
approach, able to use without much
effort or help
Perceived
Ease of Use TAM Davis (1989)
complexity MPCU Thopmson et al.
(1991) Convenience IDT Moore et
al. (1991)
Social Influence
Going along with others around who assume OTA is the best
modality
Subjective norms
TRA, TAM2 TPB, C- TAM-
TPB
Fishbein &
Ajzen (1975)
Social factors MPCU Thopmson et al.
(1991) Image IDT Taylor et
al. (1995)
Facilitating Conditions
Trusting of information given by OTA and believing that
OTA will provide a good service
Behavior control
TPB, C- TAM-
TPB
Moore et al. (1991)
Promotion
conditions MPCU Thopmson et al.
(1991) compatibility IDT Moore et
al. (1991) source: Researcher reconstructed with reference to Chen (2019).
2.3. Relationship quality
Companies have been moving towards consumer central operational paradigm and have been considering the importance of relationship with the consumers. Furthermore, rather than relying on company derived data, the consumer derived data has been used to judge the status of relationship quality. Since travel companies are dealing with products with informal value, relationship quality can be considered very valuable.
Relationship quality is at a minimum service, reduction the risk of purchase, increase the consumer satisfaction, promoting the consumer to have an ongoing relationship with the company. So, if the company provides a valuable service, the consumer will form a high level of trust and be immersed, and relationship quality will be dependent on the
ability of the company (Chun & Kwak, 2016). Therefore, relationship quality is developed while a consumer and a company are trading goods and services of informal value (Lee, 2020). Following that, as the Relationship Quality increases, the ability to retain consumers, business growth, and other benefits will be known, consumer will have a high opinion of the company and is more likely to refer others to that company without prompting. The consumers will also promote the company online participating positive free marketing (Chun & Kwak, 2016).
Relationship quality, which plays an important role in transaction relations, is composed of multiple dimensions, and each researcher shows a difference in composition.
However, in many studies, satisfaction and trust are commonly measured (Hsu, 2018; An, 2019; Al-dweeri, 2017). Therefore, this study is also intended to be composed of satisfaction and trust as a sub-factor of relationship quality. Satisfaction refers to the overall feeling of satisfaction in using a product or service (Sung & Ko, 2013).
Therefore, this study defines the overall satisfaction of using OTA. Trust is the belief that the other party will behave expectations will be exceeded, interests will be standards will be maintained in the long run (Aurier & de Lanauze, 2012). Therefore, this study defines trust with the belief that OTA will provide good information and services.
2.4. Behavioral Intention
Consumers, while considering goods or services, will
depend on review by others, or their own experiences to
decide what to purchase. In other words, before the
consumers will act, they will consider the benefits rationally,
and then perform the act (Kim, 2019). Therefore, from the
perspective of the companies, they can predict the behavior
of the consumers before that act and forecast demand before
they happen (Kim, 2019). In other words, Intention to Act is
that upon a circumstance, the consumer will form either a
positive or a negative option and act upon that opinion (Choi,
2019; Cimperman, Brenčič, & Trkman, 2016). These
Intention to Act is individual‘s intention and action can be
influenced by word of mouth, recommendation, can become
sub factors in purchasing(using), the goods and services
(Choi, 2019). Goods and services that an individual would
have used can be categorized as favorable Intention to Act or
unfavorable Intention to Act, if the consumer has a favorable
Intention to Act, then the consumer will recommend or be
faithful to that company by action. But if unfavorable
Intention to Act arises, the consumer will break away from,
file complaints, and unrecommend the company (Kim,
2019). Especially, since the online Travel Agencies rely
solely on the internet, information exchange among
consumers can be easily accomplished and online reviews,
which are the lifeline of the OTAs. This study will look at
how consumers will behave while purchasing online.
3. Research Methodology 3.1. Research model
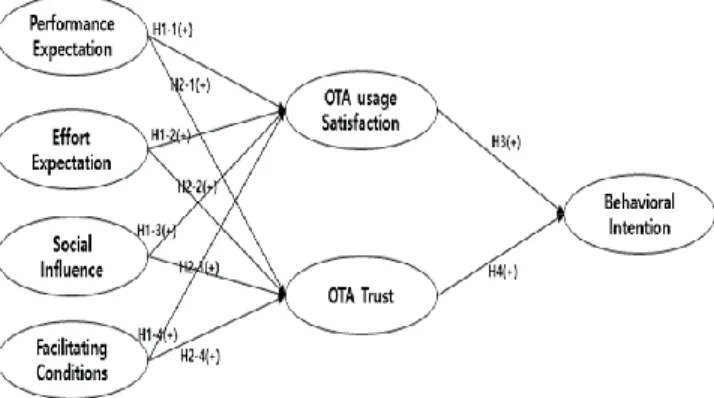
This research will follow the UTAUT model into finding out the user‘s attitude and what factors will affect the users.
Figure 1: Research model
3.2. Research hypotheses
3.2.1. Performance Expectation, Effort Expectation, Social Influence, Facilitating Condition, OTA usage satisfaction.
Yoon (2017) research showed using UTAUT Fintech Satisfaction of Usage is dependent on Performance, using empirical data analysis
Song (2017) using the Integrated Technology Acceptance Theory, that uTradeHub‘s service User Acceptance Model showed that performance, expectation, and social influence affects the satisfaction of the consumer.
Also, Joo and Kim (2017), using ITAT K-MOOC usage and satisfaction rating showed that students that use K-MOOC, their satisfaction rating and usage increase was affected by Performance Expectation, Effort Expectation, and facilitating condition and a presentation of how the increase of these factors is needed. Also, Chen (2020) showed that in IoT healthcare wearable device, satisfaction rating was influenced by IATA‘s lower performance, negatively affected the overall satisfaction rating by the user. Many new researches have shown that IATA model, satisfaction ratings are affected. Using these results, UTAUT hypothesize that OTA satisfaction rating and influence as follows:
H1-1: Performance expectation of the OTA will affect the satisfaction rating.
H1-2: Effort Expectation of the OTA will affect satisfaction rating.
H1-3: Social Influence of the OTA will affect satisfaction rating.
H1-4: Facilitating Condition will affect satisfaction rating.
3.2.2. Performance, Expectation, Social Impact, Conditional Promotion and trust of OTA
Cody-Allen and Kishore (2006) using the UTAUT model verified that performance and trust are linked, and Lee (2009) showed online commerce‘s perceived ease of use also affected the trust factor. Alharbi (2017) showed that social impact on cloud computing usage has a significant impact on trust. Gu, Zhongwei, and Xu (2015) showed using UTAUT that conditional promotion was a sub factor in influencing the trust value, and using the research, the following is hypothesized.
H2-1: Performance Expectation of OTA will affect the Trust Value.
H2-2: Effort Expectation of OTA will affect the Trust Value.
H2-3: Social Influence of the OTA will affect the Trust Value.
H2-4: Facilitating Condition will affect the Trust Value.
3.2.3. OTA satisfaction to Behavioral Intention Zhou (2013), in a study of mobile purchase, verified that by introducing late adapters system quality affected the satisfaction rating, and their satisfaction significantly affected Intention to Act. Lee (2015) showed that airlines mobile applications usage status is only affected by satisfaction of the user as to intention to use. Also, Park (2019) showed that using augmented reality apps positively affected the satisfaction of the user therefore increasing the intent to use factor. Hsu et al. (2015) showed in a study showed that easy payment service of shopping malls and the perceived usefulness and trust of shopping malls loyalty translates into positive influence of mobile purchases.
Choi and yu (2017) using UTAUT mobile easy payment continuous usage is positively affected by trust factor of the mobile app. Satisfaction and Intention to Act relationship has been documented by many studies documented above, and the relationship of satisfaction and Intention to Act for OTA is the focus of this study.
H3: Satisfaction Value of the OTA will affect for Behavioral Intention.
3.2.4. OTA Trust and Behavioral Intention
In online transactions, trust has a significant effect on
consumer behavior (Nguyen & Khoa, 2019). Kuan and
Bock (2007) showed that trust is directly related to the
website product and usability of the site. Park (2017)
showed that mobile shopping mall trust and intent to
purchase is directly related. Choi (2016) showed that Bus
Information related mobile application, trust, rather than
satisfaction, related to larger factor in intent to purchase. By
using the trusted services frequented by a consumer, it is been shown that you can affect their attitude and Intention to Act. Study of mobile banking has shown that trust affects the Intention to Act (Sharef, Babdulah, Duta, Kumar, &
Dwivedi, 2019). Using these previous studies, it is hypothesized that the trust of OTA affects Intention to Act.
H4: OTA trust will affect for Behavioral Intention.
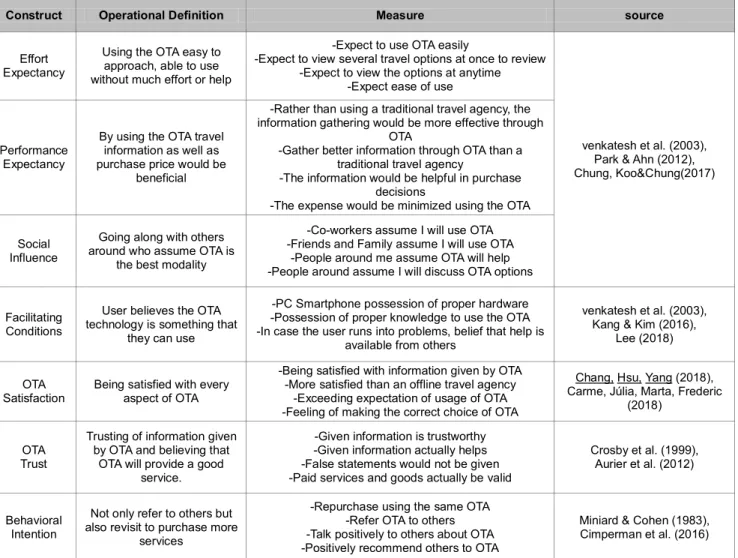
3.3. Construct Parameter, definitions and Measure
To test the hypothesis, study models are Construct Concept, Effort Expectation, Performance Expectation, Social Influence, Facilitating Condition, OTA satisfaction Value, OTA trust Value, Intention to Act construct Parameter and definition is in the table below.
Table 2: Construct Parameter, definitions and Measure
Construct Operational Definition Measure source
Effort Expectancy
Using the OTA easy to approach, able to use without much effort or help
-Expect to use OTA easily
-Expect to view several travel options at once to review -Expect to view the options at anytime
-Expect ease of use
venkatesh et al. (2003), Park & Ahn (2012), Chung, Koo&Chung(2017) Performance
Expectancy
By using the OTA travel information as well as purchase price would be
beneficial
-Rather than using a traditional travel agency, the information gathering would be more effective through
OTA
-Gather better information through OTA than a traditional travel agency
-The information would be helpful in purchase decisions
-The expense would be minimized using the OTA
Social Influence
Going along with others around who assume OTA is
the best modality
-Co-workers assume I will use OTA -Friends and Family assume I will use OTA
-People around me assume OTA will help -People around assume I will discuss OTA options
Facilitating Conditions
User believes the OTA technology is something that
they can use
-PC Smartphone possession of proper hardware -Possession of proper knowledge to use the OTA -In case the user runs into problems, belief that help is
available from others
venkatesh et al. (2003), Kang & Kim (2016),
Lee (2018)
OTA
Satisfaction Being satisfied with every aspect of OTA
-Being satisfied with information given by OTA -More satisfied than an offline travel agency
-Exceeding expectation of usage of OTA -Feeling of making the correct choice of OTA
Chang, Hsu, Yang (2018), Carme, Júlia, Marta, Frederic
(2018)
OTA Trust
Trusting of information given by OTA and believing that
OTA will provide a good service.
-Given information is trustworthy -Given information actually helps -False statements would not be given -Paid services and goods actually be valid
Crosby et al. (1999), Aurier et al. (2012)
Behavioral Intention
Not only refer to others but also revisit to purchase more
services
-Repurchase using the same OTA -Refer OTA to others -Talk positively to others about OTA -Positively recommend others to OTA
Miniard & Cohen (1983), Cimperman et al. (2016)
3.4. Empirical Applications
This study has through theoretically review examined UTAUT, satisfaction, trust, intent to act and their relationship with each other, and to validate the measuring tools, previous studies have been cited in order to satisfy the object of this study. The object of this study were respondents of a google survey using convenient sample extraction method, chosen among consumers who gathered
information, or purchased a product. The period which the information was gathered were form November 1, 2019 to December 30, 2019, a period of 2 months, total of 235 respondents of the survey. Eliminating unfaithful surveys (Same answers on all questions, many conflicting answers, etc) 18 surveys were eliminated, leaving 217 respondents.
Using SPSS v.21 and AMOS v.21, frequency analysis,
feasibility and reliability analysis, path analysis was
performed.
4. Analysis Result
4.1. Respondents breakdown
The breakdown of respondents is 25.8% male, 74.2 %female, age 30-39(48.4%), 20-29(29.5%), 40- 49(17.1%), 50+(5.1%). The usage of OTA is by mobile
device (81.6%), PC/Laptop (18.4), most using mobile devices. Largest usage of OTA was for hotels (84.8%), and most purchased between 2-4 times (58.1%) devices. Largest usage of OTA was for hotels (84.8%), and most purchased between 2-4 times (58.1%).
Table 3: Demographic Characteristics
Number % Number %
Gender Male 56 25.8
OTA
yanolja,com
Daily Hotel 81 37.3
Female 161 74.2 good choice.kr 17 7.8
Age
20’s 64 29.5 airbnb.kr 42 19.4
30’s 105 48.4 hotelenjoy.com 6 2.8
40’s 37 17.1 tour.interpark.com 33 15.2
Over50’s 11 5.1 Expedia Group 21 9.7
Marraige single 93 42.9 Booking Holdings 5 2.3
married 124 57.1 trip.com 8 3.7
Device Mobile 177 81.6 other 4 1.8
Notebook/PC 40 18.4
Count
1 39 18.0
Purpose of Using
OTA
Hotel&Homes 184 84.8 2~4 126 58.1
Air Ticket 26 12.0 5~7 33 15.2
Rent a Car 2 .9 8~10 8 3.7
Activity 3 1.4 Over11 11 5.1
Review 2 .9 Total 217 100.0
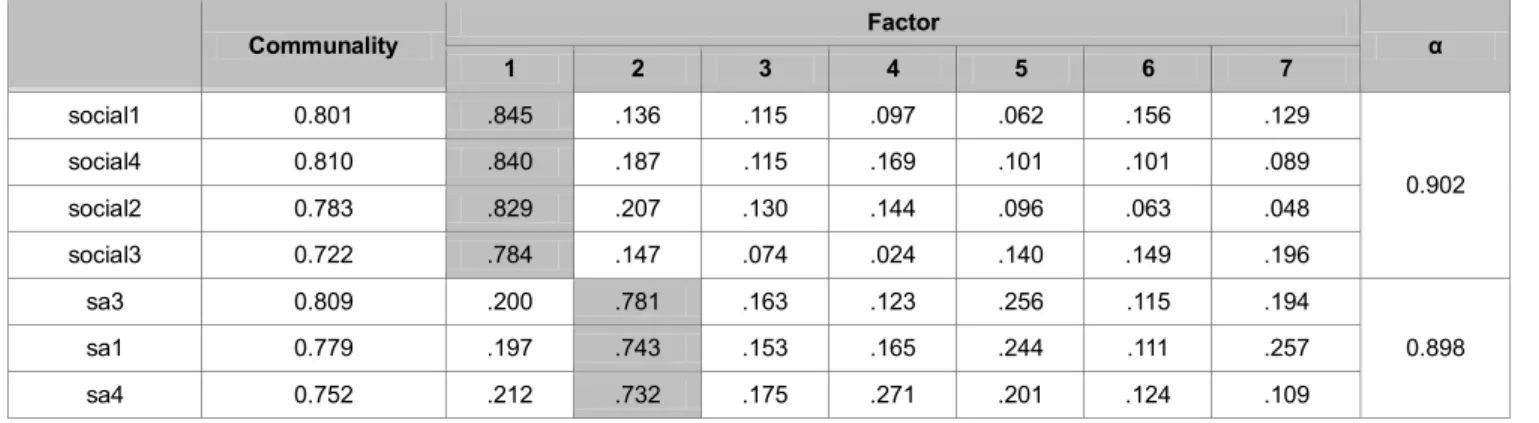
4.2. Feasibility and Trustworthiness verified
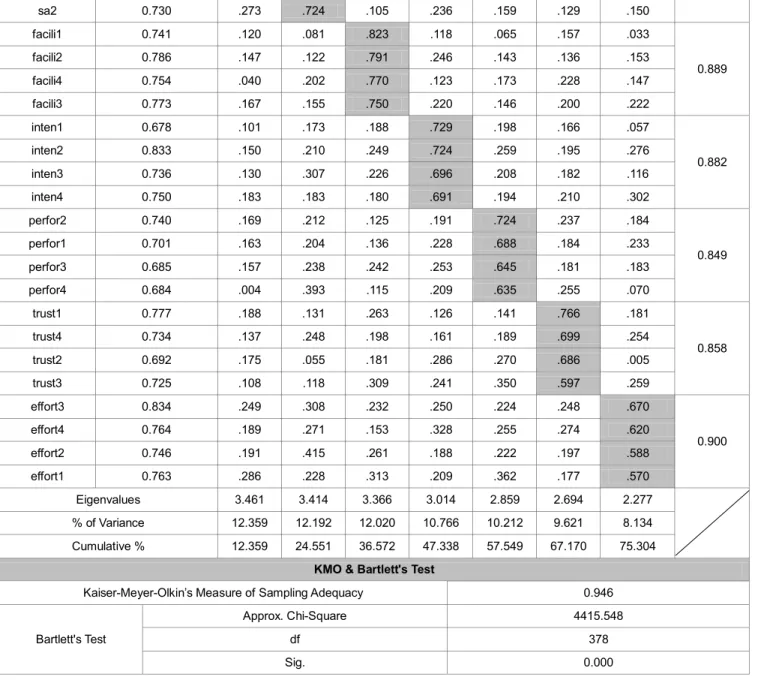
Measuring tools feasibility gathering led to literature review of 28 articles. The process of article review necessitates elimination of common articles, with commonality factor of 0.5 minimum, and difference factor of 0.4 would have been eliminated, however, none of the
articles met the criteria and thus none were eliminated.
Finally, 7 factors (eigen value of 1) were shown, cumulative explanation power of 75.304%. Next 7 factors were examined using Cronbach‘s Alpha calculation (>0.7), and the validity was tested since the number is within the parameter of (0.849-0.902), the validity was met (Nunally, 1978).
Table 4: Results of Exploratory Factor Analysis: EFA
Communality Factor
1 2 3 4 5 6 7 α
social1 0.801 .845 .136 .115 .097 .062 .156 .129
0.902
social4 0.810 .840 .187 .115 .169 .101 .101 .089
social2 0.783 .829 .207 .130 .144 .096 .063 .048
social3 0.722 .784 .147 .074 .024 .140 .149 .196
sa3 0.809 .200 .781 .163 .123 .256 .115 .194
0.898
sa1 0.779 .197 .743 .153 .165 .244 .111 .257
sa4 0.752 .212 .732 .175 .271 .201 .124 .109
sa2 0.730 .273 .724 .105 .236 .159 .129 .150
facili1 0.741 .120 .081 .823 .118 .065 .157 .033
0.889
facili2 0.786 .147 .122 .791 .246 .143 .136 .153
facili4 0.754 .040 .202 .770 .123 .173 .228 .147
facili3 0.773 .167 .155 .750 .220 .146 .200 .222
inten1 0.678 .101 .173 .188 .729 .198 .166 .057
0.882
inten2 0.833 .150 .210 .249 .724 .259 .195 .276
inten3 0.736 .130 .307 .226 .696 .208 .182 .116
inten4 0.750 .183 .183 .180 .691 .194 .210 .302
perfor2 0.740 .169 .212 .125 .191 .724 .237 .184
0.849
perfor1 0.701 .163 .204 .136 .228 .688 .184 .233
perfor3 0.685 .157 .238 .242 .253 .645 .181 .183
perfor4 0.684 .004 .393 .115 .209 .635 .255 .070
trust1 0.777 .188 .131 .263 .126 .141 .766 .181
0.858
trust4 0.734 .137 .248 .198 .161 .189 .699 .254
trust2 0.692 .175 .055 .181 .286 .270 .686 .005
trust3 0.725 .108 .118 .309 .241 .350 .597 .259
effort3 0.834 .249 .308 .232 .250 .224 .248 .670
0.900
effort4 0.764 .189 .271 .153 .328 .255 .274 .620
effort2 0.746 .191 .415 .261 .188 .222 .197 .588
effort1 0.763 .286 .228 .313 .209 .362 .177 .570
Eigenvalues 3.461 3.414 3.366 3.014 2.859 2.694 2.277
% of Variance 12.359 12.192 12.020 10.766 10.212 9.621 8.134
Cumulative % 12.359 24.551 36.572 47.338 57.549 67.170 75.304
KMO & Bartlett's Test
Kaiser-Meyer-Olkin’s Measure of Sampling Adequacy 0.946
Bartlett's Test
Approx. Chi-Square 4415.548
df 378
Sig. 0.000
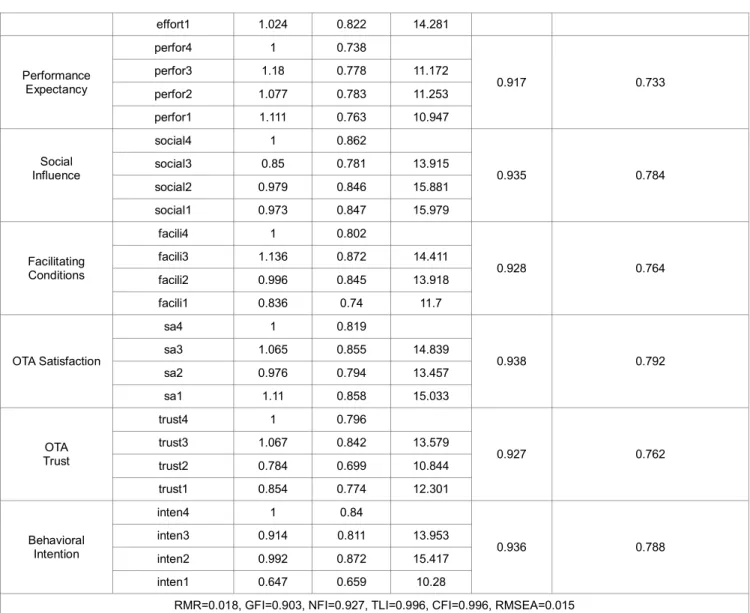
Using these results, Confirmatory factor analysis was performed, Standard Regression Weights, applied, and using Coefficient of Reliability, Average Variance Estimation is verified. In conclusion, <Graph 5> Standard
deviation of (>0.5), C.R(>0.7), AVE of (>0.5). All greater than the Critical Value, Convergent Validity is verified (Hair, Hult, Ringle,. & Sarstedt, 2014).
Table 5: Results of Confirmatory Factor Analysis: CFA
Classification Estimate
T C.R
(≥0.7) AVE
(≥0.5)
B β
Effort Expectancy
effort4 1 0.82
0.944 0.807
effort3 0.983 0.876 15.629
effort2 0.933 0.826 14.321
effort1 1.024 0.822 14.281
Performance Expectancy
perfor4 1 0.738
0.917 0.733
perfor3 1.18 0.778 11.172
perfor2 1.077 0.783 11.253
perfor1 1.111 0.763 10.947
Social Influence
social4 1 0.862
0.935 0.784
social3 0.85 0.781 13.915
social2 0.979 0.846 15.881
social1 0.973 0.847 15.979
Facilitating Conditions
facili4 1 0.802
0.928 0.764
facili3 1.136 0.872 14.411
facili2 0.996 0.845 13.918
facili1 0.836 0.74 11.7
OTA Satisfaction
sa4 1 0.819
0.938 0.792
sa3 1.065 0.855 14.839
sa2 0.976 0.794 13.457
sa1 1.11 0.858 15.033
OTA Trust
trust4 1 0.796
0.927 0.762
trust3 1.067 0.842 13.579
trust2 0.784 0.699 10.844
trust1 0.854 0.774 12.301
Behavioral Intention
inten4 1 0.84
0.936 0.788
inten3 0.914 0.811 13.953
inten2 0.992 0.872 15.417
inten1 0.647 0.659 10.28
RMR=0.018, GFI=0.903, NFI=0.927, TLI=0.996, CFI=0.996, RMSEA=0.015
Next, using methods put forth by Fornell & Larcker
(1981), AVE, Square root, construct parameter and correlation coefficient compared, therefore discriminant validity was performed.
Table 6: discriminant validity
division Mean S. D Effort Expectancy
Performance Expectancy
Social Influence
Facilitating Conditions
OTA Satisfaction
OTA Trust
Intent to Act Performance Expectancy 3.84 0.65 (0.899)
Performance Expectancy 4.07 0.60 .727** (0.856)
Social Influence 3.88 0.71 .538** .411** (0.885)
Facilitating Conditions 4.04 0.69 .608** .509** .365** (0.874)
OTA Satisfaction 3.98 0.67 .717** .668** .518** .472** (0.890)
OTA Trust 3.73 0.59 .691** .677** .433** .605** .519** (0.873)
Behavioral Intention 3.87 0.61 .709** .675** .427** .575** .622** .640** (0.887) ( ) : AVE Square root ** p<0.01
4.3. Study Hypothesis Verification
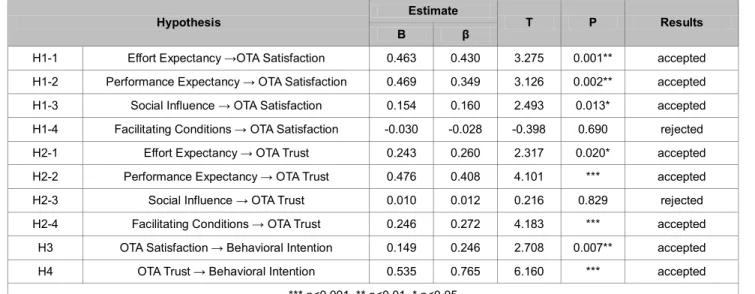
Before verifying the results of the study, the examining the fitness of structure, RMR=0.018(0.05>), GFI=0.901(>0.9), NFI=0.926(>0.9), CFI=0.996(>0.9), RMSEA=0.016(0.05>), and these numbers are proved to be above the acceptable range (Woo, 2012). In the hypothesis analysis, in 10 tests 8 are accepted, 2 are rejected.
Specifically, Hypothesis 1, it is verified using UTAUT, OTA is partially affected. Using UTAUT, Effort Expectation (Hypothesis 1-1), Performance Expectation (Hypothesis 1-2), Social Influence (Hypothesis 1-3), all are proven to affect the Satisfaction Value, however,
Facilitating Condition (Hypothesis 2-4), has proven not to affect the Satisfaction Value in a significant way. Second verification also reveals that in the Trust Value of OTA is affected by Effort Expectation (Hypothesis 2-1), Performance Expectation (Hypothesis 2-2), and Facilitating Condition (Hypothesis 2-4). However, it is noted that Social Influence (Hypothesis 2-3) does not affect the Trust Value in any significant way. Third, the Satisfaction and Intent to Act is affected by all 3 factors of Effort Expectation, Performance Expectation, and Social Influence as in Hypothesis 3. Lastly, OTA Trust Value to Intent to Act is also affected by all 3 factors as in Hypothesis 4.
Table 6: Result of Hypothesis Analysis
Hypothesis Estimate
T P Results
B β
H1-1 Effort Expectancy →OTA Satisfaction 0.463 0.430 3.275 0.001** accepted H1-2 Performance Expectancy → OTA Satisfaction 0.469 0.349 3.126 0.002** accepted
H1-3 Social Influence → OTA Satisfaction 0.154 0.160 2.493 0.013* accepted
H1-4 Facilitating Conditions → OTA Satisfaction -0.030 -0.028 -0.398 0.690 rejected
H2-1 Effort Expectancy → OTA Trust 0.243 0.260 2.317 0.020* accepted
H2-2 Performance Expectancy → OTA Trust 0.476 0.408 4.101 *** accepted
H2-3 Social Influence → OTA Trust 0.010 0.012 0.216 0.829 rejected
H2-4 Facilitating Conditions → OTA Trust 0.246 0.272 4.183 *** accepted
H3 OTA Satisfaction → Behavioral Intention 0.149 0.246 2.708 0.007** accepted
H4 OTA Trust → Behavioral Intention 0.535 0.765 6.160 *** accepted
*** p<0.001, ** p<0.01, * p<0.05
5. Conclusion
Online Travel Agencies use advanced online system to provide travel related services. And starting in 2012, using the Free Trade agreement, national agencies have advanced quickly following the trend set by American Online Travel Agencies. Travelers planning their trip are able to gather information using many modalities and are able to access increased amount of available information. Travel agencies have also use digital tools in order to shift the paradigm in how business is conducted. Online travel agencies provide the same services as a normal travel agency, including hotels, transportation, guided tours, reservations, and related services, but using an ―online platform.‖
This study is conducted to find what factors lead to the attitudes of consumers in using OTA using the UTAUT model, and the conclusion is as follows.
First, the Satisfaction of Usage by consumers is affected
by several factors which include Effort expectancy, Performance expectancy, Social Influence, however, Facilitating Condition fails to affect satisfaction of usage.
This is because many travelers have previous experience
with using online tools, and are familiar with the current
system, and therefore, facilitating condition does not
contribute to Satisfaction of Usage. Second, Trust Value of
OTA factors of Effort Expectancy, Performance Expectancy,
Facilitating Condition all contribute to the Trust Value of
OTA, but Social Influence fails to contribute as a factor to
the Trust Value of OTA. Choosing of OTA is an individual
choice from their own opinions, experiences, which can
vary depending on external factors. For the most part, the
USER while validating a gifted travel package, will use an
OTA to build trust, get familiarized through the effort the
user puts into the experience of using the site. Most users
will put forth more effort to find what they consider to be
the ―best‖ package(price, service, mileage, etc), and
through the experience, they will build trust with that OTA,
and therefore, the contents of their site must constantly be improved and be on the cutting edge in order to gain the trust of the USER.
Third, OTA Satisfaction of Usage will, after analysis, affect for Behavioral Intention. Just as it is stated above, users will put in the effort to find the ―best‖ package available, comparing prices, service, and the user will find satisfaction in perceiving that their effort has led them to that end. And due to this fact, Intention to act will be very much affected by the Satisfaction of Usage.
Fourth, OTA Trust Value will, after analysis, affect or Behavioral Intention. Recently, the searches for OTA has increased dramatically, and rather than smaller ―unknown‖
companies, larger well-known companies have flourished.
Users will search using many different search engines, and through name recognition, and repeated search engine appearances, they will build Trust Value, which in turn will affect the Behavioral Intention.
The world‘s marketplace of OTA gradually is being divided by expedia.com and booking holdings world, and recently even China‘s dream.com has been invaded. This study is focused in OTAs, however, most of the responses are from hotel users, and therefore limits the focus of the study. In the future, a wider scoped study including hotel and flights should be done.
In general, familiarity of the company, as in name recognition, and experience in usage are relevant, however in this study it is concluded that additional study is necessary to verify their relevance. Lastly, existing TAM based previous studies of travel and flight usage were done, however, UTAUT and TAM model studies considering technical environment has not been done, and therefore there is a value to consider as a future study.
References
Al-dweeri, R. M., Obeidat, Z. M., Al-dwiry, M. A., Alshurideh, M.
T., & Alhorani, A. M. (2017). The impact of e-service quality and e-loyalty on online shopping: moderating effect of e- satisfaction and e-trust, International Journal of Marketing Studies, 9(2), 92-103.
Alharbi, S. (2017). An empirical investigation on the impact of trust mediated determinants and moderating factors on the adoption of cloud computing. International Journal of Information Technology and Computer Science, 9(11), 12-22.
An, M. A., Kim, S. H., & Hong, S. J. (2019). Does the Omnichannel Will Serve to Strengthen the Relationship Quality? The Effect of the Relationship Quality on Customers‘
Continued Intention. Journal of Product Research, 37(3), 83- 94.
Aurier, P., & de Lanauze, G. S. (2012). Impacts of perceived brand relationship orientation on attitudinal loyalty. European Journal of Marketing, 46(11-12), 1602-1627.
Carme, M. C., Júlia, P. V., Marta, M. M., Frederic, M. (2018).
Behavioral Profiles of Consumers of Online Travel Agencies.
International Journal for Quality Research, 12(3), 703-722.
Chang, Y. W., Hsu, P. Y., Yang, Q. M. (2018). Integration of online and offline channels: a view of O2O commerce. Internet Research, 28(4), 926-945.
Chen, R., Wang, L., & Hwang, Y. H. (2020). Trust on On-line Travel Agency: Effects of Antecedents of Trust Between Initial and Mature Trust Group. Journal of Tourism and Leisure Research, 32(1), 199-215.
Choi, D. R., & Yu, J. H. (2017). Effects of cognitive factors on brand attitude and behavioral intention across different fashion pop-up store formats. The Research Journal of the Costume Culture, 25(5), 543-560.
Choi, Y. K., Chu, K. H., Choi, E. J. (2019). Social Network Services Addiction in the Workplace. Journal of Asian Finance, Economics and Business, 6(1), 249-259.
Chun, C. S., & Kwak, D. Y. (2016). The Effect of SNS Tourism Information Service Quality on the Intension of Reuse: with a Focus on the Moderating Effect of Reliability and Interaction.
International Journal of Software Engineering and Its Applications, 10(10), 177-188.
Chun, Y. T., & Lee, J. E. (2013). The Influence of Experience factor, Relational Quality & Recommendation Intention.
Tourism Research, 38(2), 209-224.
Chung, C. H., Koo, C. M., & Chung, N. H. (2017), Examining the Adoption of Exhibition NFC Service Using UTAUT & Trust.
International Journal of Tourism Management and Sciences, 32(2), 1-22.
Cimperman, M., Brenčič, M. M., & Trkman, P. (2016). Analyzing older users‘ home telehealth services acceptance behavior—
applying an Extended UTAUT model. International journal of medical informatics, 90(1), 22-31.
Cody-Allen, E. R., & Kishore, R. (2006). An extension of the UTAUT model with e-quality, trust, and satisfaction constructs.
Conference on Computer Personnel Research, 6(4), 82–89.
Compeau, D. R., & Higgins, C. A. (1995). Computer Self-Efficacy:
Development of a Measure and Initial Test. MIS Quarterly, 19(2), 189-221.
Coo, B. M. (2017). A Study on Trucker Recognition in Korean Cargo Distribution O2O Business Model. Journal of Distribution Science, 15(2), 79-90.
Crosby, L. A., Evans, K. R., & Cowles, D. (1990). Relationship quality in services selling: an interpersonal influence perspective. Journal of Marketing, 54(3), 68-81.
Davis, F. D. (1989). Perceived Usefulness, Perceived Ease of Use and Use Acceptance of Information Technology. MIS Quarterly, 13(3), 319-339.
Davis, F. D., Bagozi, R. P., & Warshaw, P. R. (1992). Extrinsic and Intrinsic Motivation to Use Computers in the Workplace.
Journal of Aplied Social Psychology, 2(14), 111-132.
Fishbein, M., & Ajzen, I. (1975). Belief, attitude, intention, and behavior: An introduction to theory and research. Reading, MA: Addison-Wesley.
Fornell, C., & Larcker, D. F. (1981). Structural equation models with unobservable variables and measurement error: Algebra and statistics. Journal of marketing research, 18(1), 382-388.
Gu, Z., Xu, F., & Wei, J. (2015). Empirical study on factors influencing consumers’ initial trust in wearable commerce.
The Journal of Computer Information Systems, 56(1), 79-85.
Hair, J. F., Hult, G. T. M., Ringle, C. M. & Sarstedt, M. (2014). A
Primer on Partial Least Squares Structural Equation Modeling (PLS-SEM). Sage Publication research, 18(1), 382-388.
Hsu, C. L., Chen, M. C., & Kumar, V. (2018). How social shopping retains customers? Capturing the essence of website quality and relationship quality. Total quality management &
business excellence, 29(1-2), 161-184.
Hwang, H. J., & Lee, S. M. (2011). A study on transferring the effects of brand reputation and level of service satisfaction of an offline channel company when it is expanding to an online distribution channel. Journal of Distribution Science, 9(2), 31- 36.
Joo, Y. J., & Kim, D. S. (2017). A Study of Satisfaction and Intention to Use MOOC Based on UTAUT2 in Korea. Journal of Lifelong Learning Society, 13(1), 185-207.
Kang, S. H., & Kim, H. K. (2016). A Study on the User's Acceptance and Use of Easy Payment Service - Focused on the Moderating Effect of Innovation Resistance. Management Information Systems review, 35(2), 167-183.
Kim, J. K. (2019). The usability of a mobile hotel reservation (MHR) channel and its impact on relationship quality and behavioral intentions. International Journal of Tourism and Hospitality Research, 33(6), 19-33.
Kim, S. H., & Yoo, B. K. (2020). Factors Influencing the Reuse of Mobile Payment Services in Retail. Journal of Distribution Science, 18(3), 53-65.
Kuan, H. H., & Bock, G. W.(2007). Trust transference in brick and click retailers: An investigation of the before-online-visit phase. Information and Management, 44(2), 175-187.
Lee M. C. (2009). Factors influencing the adoption of Internet banking: An integration of TAM and TPB with perceived risk and perceived benefit. Electronic Commerce Research &
Applications, 8(3), 130-141.
Lee, S. M. (2011). According to the CRS technology expand capacity Focusing on the relationship between airlines and travel agencies. The e-Business Studies, 12(1), 115-141.
Lee, S. S., & Lee, J. E. (2020). The Effects of Service Fairness on Revisit Intention: Multiple Mediation of Perceived Quality and Relationship Quality. Journal of Product Research, 38(1), 69-80.
Lee, Y. T. (2015). Tourism Science. Seoul, Korea: BEAKSAN PRESS.
Ling, X. N., & Lee, J. H. (2018). The Intention of Repurchase on e-Service Quality by Online Travel Agency Site. International Journal of Industrial Distribution & Business, 9(7), 61-70.
Miniard, P. W., & Cohen, J. B. (1983). Modeling Personal and Normative Influences on Behavior. Journal of Consumer Research, 10(2), 169-180.
Moore, G. C., & Benbasat, I. (1991). Development of an instrument to measure the perceptions of adopting an information technology innovation. Inform Systems Res, 2(3), 192-222.
Morgan, R., & Hunt, S. (1994). The Commitment-Trust Theory of Relationship Marketing. Journal of Marketing, 58(July), 20- 38.
Nguyen, H. M., & Khao, B. T. (2019). The Relationship between the Perceived Mental Benefits, Online Trust, and Personal Information Disclosure in Online Shopping. Journal of Asian Finance, Economics, Business, 6(4), 261-270.
Nunally, J. C. (1978), Psychometric theory (2nd ed.). New York,
NY: McGraw-Hill.
Park, I. S., & Ahn, H. C. (2012). A Study on the User Acceptance Model of Mobile Credit Card Service based on UTAUT. The e-Business Studies, 13(3), 551-574.
Park, H. J., Park, J. H., Lee, J. S., Kim, Y. H., Oh, A. S., & Park, B. G.
(2017). Analyzing the Relationship among Tourism Omnichannel Selecting Factor, Satisfaction and Purchasing Intention on the Tourism Purchasing Stage. Journal of Digital Convergence, 15(10), 173-182.
Sharef, M. A., Babdulah, A., Duta, S., Kumar, V., & Dwivedi, Y. K.
(2018). Consumer Adoption of Mobile Banking Services: An Empirical Examination of Factors according to Adoption Stages. Journal of Retailing and Consumer Services, 43(1), 54-67.
Song, B. C., & Kim, W. M. (2018). How the Technological Acceptance Factors influence the User's Acceptance and Behavioral Intentions using the Unified Technology Theory of Acceptance - Case of Korean Medical Device Products. Asia Pacific Journal of Information Systems, 54(2), 49-62.
Song, S. O. (2017). A Study on User Acceptance Model of uTradeHub Service Based on Unified Theory of Acceptance and Use of Technology. Korea Academy Industrial Cooperation Society, 18(8), 181-189.
Taylor, S., & Tod, P. (1995). Understanding Information Technology Usage: A Test of Computing Models. Information Systems Research, 6(2), 14-17.
Thompson, R. L., Higgins, C. A., & Howell, J. M. (1991).
Personal Computing: Toward a Conceptual Model of Utilization. MIS Quarterly, 15(1), 125-143.
Venkatesh, V., Moris, M. G., Davis, G. B., & Davis, F. D. (2003).
User Acceptance of Information Technology: Toward a Unified View. MIS Quarterly, 27(3), 425-478.
Venkatesh, V., Thong, J. Y. L., & Xu, X. (2012). Consumer Acceptance and Use of Information Technology: Extending the Unified Theory of Acceptance and Use of Technology.
MIS Quarterly, 36(1), 157-178.
Vesel, P., & Zabkar, V. (2010). Comprehension of Relationship Quality in the Retail Environment. Managing Service Quality, 20(3), 213-235.
Woo, J. P. (2012). Concepts and Understanding of Structural Equation Model. Seoul, Korea: HANNARAE.
Wu. R., & Lee, J. H. (2017). The Use Intention of Mobile Travel Apps by Korea-Visiting Chinese Tourists. Journal of Distribution Science, 15(5), 53-64.
Wu, R., & Lee, J. H. (2017). The Comparative Study on Third Party Mobile Payment Between UTAUT2 and TTF.
Distribution Science, 15(11), 5-19.
Yang, C. Y. (2018). A Comparative Study on Travelers’ Online Travel Agency(OTA) selection attributes and revisit selection attributes. Management Information Systems review, 37(4), 175-193.
Yang, S. H., Hwang, Y. S., & Park, J. I. (2016). A Study on the Use of Fintech Payment Services Based on the UTAUT Model.
Journal of Vocational Rehabilitation, 38(1), 183-209.
Zhou, T. (2013). An Empirical Examination of Continuance Intention of Mobile Payment Services. Decision Support Systems, 54(2), 1085-1091.