Visual Classification of Wood Knots Using k-Nearest Neighbor and Convolutional Neural Network 1KORAPP
Hyunbin Kim
2⋅Mingyu Kim
2⋅Yonggun Park
2,3⋅Sang-Yun Yang
2,3⋅ Hyunwoo Chung
2⋅Ohkyung Kwon
4⋅Hwanmyeong Yeo
2,3,†ABSTRACT
1)Various wood defects occur during tree growing or wood processing. Thus, to use wood practically, it is necessary to objectively assess their quality based on the usage requirement by accurately classifying their defects. However, manual visual grading and species classification may result in differences due to subjective decisions; therefore, computer-vision-based image analysis is required for the objective evaluation of wood quality and the speeding up of wood production. In this study, the SIFT+k-NN and CNN models were used to implement a model that automatically classifies knots and analyze its accuracy. Toward this end, a total of 1,172 knot images in various shapes from five domestic conifers were used for learning and validation. For the SIFT+k-NN model, SIFT technology was used to extract properties from the knot images and k-NN was used for the classification, resulting in the classification with an accuracy of up to 60.53% when k-index was 17. The CNN model comprised 8 convolution layers and 3 hidden layers, and its maximum accuracy was 88.09% after 1205 epoch, which was higher than that of the SIFT+k-NN model.
Moreover, if there is a large difference in the number of images by knot types, the SIFT+k-NN tended to show a learning biased toward the knot type with a higher number of images, whereas the CNN model did not show a drastic bias regardless of the difference in the number of images. Therefore, the CNN model showed better performance in knot classification. It is determined that the wood knot classification by the CNN model will show a sufficient accuracy in its practical applicability.
Keywords: visual classification, knot classification, k-nearest neighbor, convolution neural network, deep learning,
species identification, wood classification
1. INTRODUCTION
Due to its eco-friendly, human-friendly, and unique pattern, wood is highly popular. There has also been a growing interest in wood as a core material for sustainable development. Accordingly, there has been
a need for objective and accurate quality evaluation and grading classification for the efficient use of wood based on its usage requirement. Generally, since wood is distributed in lumber form, the quality of wood is largely dependent upon the type and size of defects on its surface. While there may be different defects
1Date Received January 8, 2019, Date Accepted March 7, 2019
2Department of Forest Sciences, Seoul National University, Republic of Korea
3Research Institute of Agriculture and Life Sciences, Seoul National University, Republic of Korea
4National Instrumentation Center for Environmental Management, Seoul National University, Republic of Korea
†Corresponding author: Hwanmyeong Yeo (e-mail: [email protected], ORCID: 0000-0002-1779-069X) Original Article
to be evaluated based on the usage of lumber, the quality of wood is generally evaluated by defects such as knots, cleavage and twisting, etc., which govern the dynamic performance and aesthetic properties of wood (KS F 2151, 2014).
There are various forms of defects during tree growing or processing: particularly, knots affect the strength performance of wood depending on their kind;
therefore, the types of defects of the wood surface should be accurately classified for an accurate quality eval- uation. There have been various methods using naked eye, electron microscope, near-infrared spectroscopy, etc. in species and grade classifications (Eom and Park, 2018; Kim and Choi, 2016; Kwon et al., 2017; Lee et al., 2018; Mohan, 2012; Park et al., 2018; Park et al., 2017; Tong et al., 2017). However, visual grading is performed by experienced evaluators, and Lampinen et al. (1998) reported that such visual grading results in classification with an accuracy of about 80%.
However, evaluators’ subjective decision on the wood quality may cause errors; hence, it is necessary to develop a grade evaluation method that is more objective and less susceptible to surrounding environments.
Machine vision simulates and processes human’s visual capacity with a system of hardware and software, and it is often used in automated manufacturing processes in which defects of a product are repetitively measured (Lampinen et al., 1998). Among machine visions, image analysis used to categorize images usually extract features from images and categorizes images based on the analysis of the extracted features.
Scale-Invariant Feature Transform (SIFT) is an algorithm that identifies and extracts features in images, such as corners, and it can extract features regardless of rotation, magnification. or location (Putri, 2018). One of the intui- tive and simple map learning models among machine learning models, k-nearest neighbor (k-NN), identifies k number of data that are the closest in the same dimension from the existing data set when new data appears then
categorizes images by allocating the class with the highest number of appearances among these data to the class of the new data (Mohan and Venkatachalapathy, 2012; Putri and Machbub, 2018). Research has been performed to categorize knots on a wooden surface using k-NN (Mohan and Venkatachalapathy, 2012), and it has been reported that the categorization of wood defects based on k-NN would result in an accuracy of about 72% (Tong et al., 2017). Furthermore, a study attempted to combine SIFT and k-NN to categorize wood species (Hu et al., 2015). However, there have been few studies on applying the combined structure of SIFT and k-NN to knot classification.
Image analysis based on deep-learning technology, one of the artificial intelligence techniques, shows higher performance than the other classification methods. Object recognition system using deep learning uses Con- volutional Neural Network (CNN) to classify objects.
CNN performs both feature extraction from and
classification of images at the same time. This method
extracts features from images through canals in certain
size then categorize them using Artificial Neural Network
(ANN) (LeCun et al., 2015). After having extracted
various features of images using several canals, CNN
converts them into a one- dimensional vector and
categorizes them via ANN. With CNN, feature extraction
and classification can be learned simultaneously with
labeled images; thus, it allows for extracting and
classifying suitable features for each target object. It has
been reported that classifying the grade of broadleaf trees
using one- dimensional ANN would result in an accuracy
of about 80% (Thomas, 2017), and there has been another
study on knot detection using two-dimensional CNN
(Norlander et al., 2015). While CNN is currently used
in dividing objects from various images or spectrum, few
studies have applied it on wood. Therefore, in this study,
SIFT+k-NN and CNN models were used to realize a
model that automatically classifies the types of knots and
the accuracy of the proposed model was evaluated.
2. MATERIALS and METHODS
2.1. Image dataset
The species used in this study were Larix kaempferi, Pinus koraiensis, Pinus densiflora, Cryptomeria japonica, and Chamaecyparis obtusa. The surface of each wood was photographed, and a total of 937 lumber images were used for learning and validation. The program used to label knots on the images was VGG Image Annotator (USA, Department of Engineering Science, University of Oxford). The knots on the surface of each lumber were classified into four categories based on KS F 2151, namely, decayed knot, encased knot, sound knot, and spike knot. Then, the knots’ images were cut in square to show the overall shape of the knots. Their size was adjusted to 100 × 100 pixels and the knot images with RGB color space data were used for learning and validation. The ratio of the training set used for model learning, to the validation set used to evaluate the learning level was 8:2. A total of 937 knot images were used for the learning while a total of 235 were used for the validation.
2.2. Knot classification using the model, SIFT+k-NN
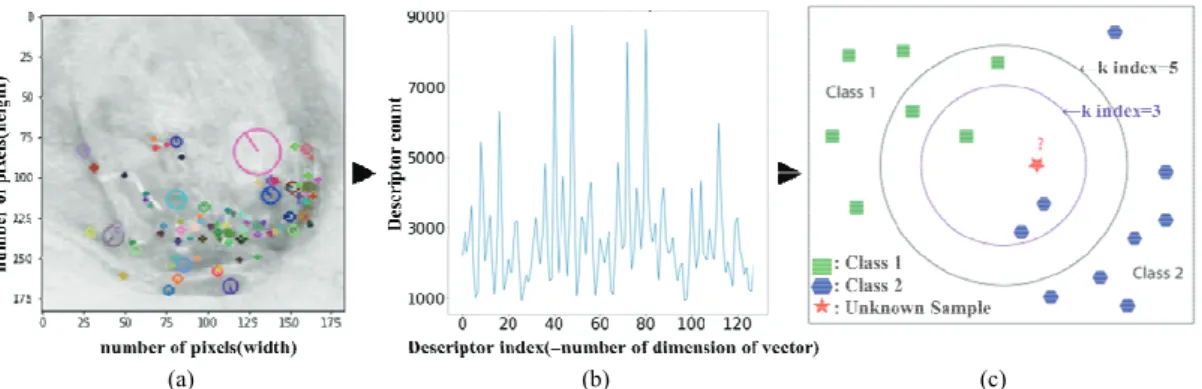
Shown in Fig. 1 is the structure of the knot classi- fication model using SIFT+k-NN. SIFT+k-NN is a
structure combining SIFT, which extracts feature points within an image, and k-NN, which classifies images based on the feature points. Since each image contains features that represent it, they were extracted using SIFT.
From each feature point, vectors of 128-dimension were created and entered into k-NN for learning. The feature point vectors extracted from the training set images were set as the initial data and the feature points ex- tracted from the validation set images were categorized to determine the validation accuracy level of SIFT+k-NN model. The validation set was classified as the group with the highest frequency among the k number of the closest data. Here, the k index, which determines the performance of k-NN, was changed from 1 to 3, 5,
…, and to 23 while conducting learning, and the k index with the highest validation accuracy was selected.
The features extracted from SIFT were grouped using k-Means Clustering. While circling each point, a new mass center was repetitively calculated until the group no longer changed; subsequently, they were grouped in such a way that they belong to the group to which the closest mass center belongs, and the key groups were then analyzed.
2.3. Knot classification using CNN
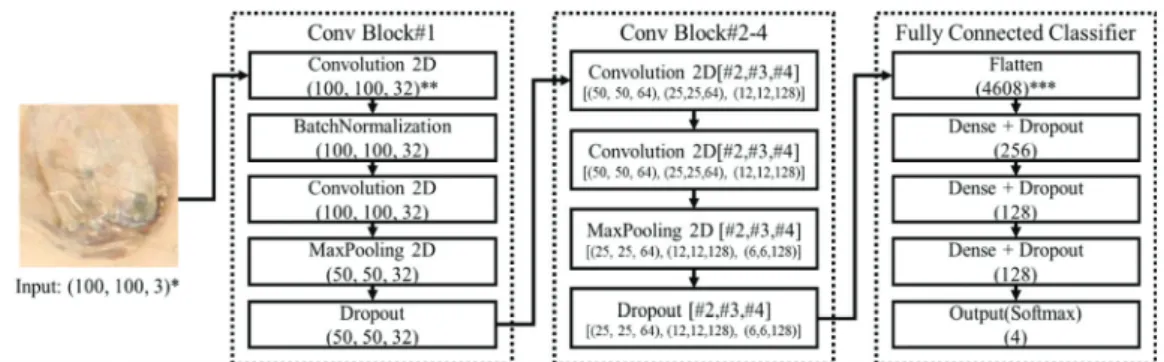
Shown in Fig. 2 is the configuration of CNN knot classification model used in this study. The size of the
(a) (b) (c)
Fig. 1. Structure of SIFT+k-NN model. The image extracted by SIFT(a), Summed descriptors(b) and k-NN(c).
images used as an input was 100 × 100 pixels and images having RGB color space data were used. First, 32 feature images were created with convolution layers, which were maxpooling-processed in 50 × 50 pixels.
Later, two processes, namely, convolution and max- pooling, were performed additionally for each block, and they were extracted as feature images in 6 × 6 pixels with 128 features per pixel. The feature-extracted images were finally converted into a one-dimensional vector with the size of 4,608 through the full connection;
they were then passed through the hidden layer with 256, 128, 128 nodes for the knot classification. In this study, dropout method was used as a regulation method to prevent overfitting of the model.
3. RESULTS and DISCUSSION 3.1. Knot classification results based on
the model SIFT+k-NN
Shown in Fig. 3 are the results based on the model SIFT+k-NN. The more the k index, the lower the accu- racy of the data for training became and the accuracy of the data for testing showed to decrease after increasing.
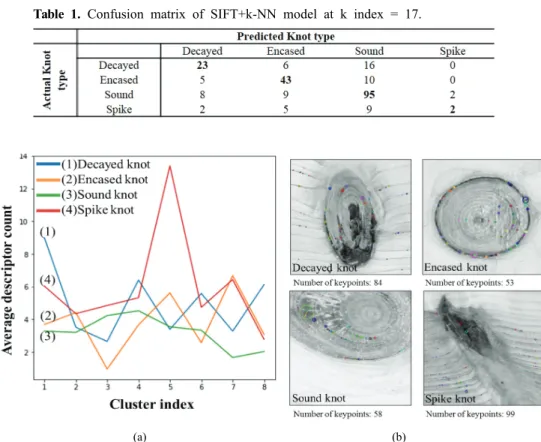
The validation accuracy was the highest when the k index was 17, and the confusion matrix at that time is shown in Table 1. The average knot classification accuracy of the model was about 69.36%. Spike knots
showed the lowest classification accuracy, and it is believed that this is because the number of spike knot images was so small that it was difficult to extract various feature points. In addition, since more images of sound knots were collected than any other knot images, the classification accuracy of sound knots was higher than the others and the others were often classi- fied as sound knot. Therefore, it is determined that SIFT+k-NN model will offer a low accuracy unless the number of images of all knot forms is equally acquired.
The study analyzed the key features based on k-Means Clustering. Shown in Fig. 4(a) are the key features when the number of clusters was 8. There were differences in the distribution of feature points depending on knot types, and in Cluster 1, feature points extracted from dark and the decayed parts were distributed. In Cluster Fig. 2. Structure of CNN model (*: (No. of pixels, No. of pixels, RGB value), **: (No. of pixels, No. of pixels, No. of dimension), ***: (No. of nodes)).
Fig. 3. Accuracy of SIFT+k-NN according to k index.
Table 1. Confusion matrix of SIFT+k-NN model at k index = 17.
(a) (b)