• 검색 결과가 없습니다.

Classification of Leukemia Disease in Peripheral Blood Cell Images Using Convolutional Neural Network

N/A
N/A
Protected

Academic year: 2021

Share "Classification of Leukemia Disease in Peripheral Blood Cell Images Using Convolutional Neural Network"

Copied!
12
0
0

로드 중.... (전체 텍스트 보기)

전체 글

(1)

1. INTRODUCTION

Leukemia, a kind of cancer found in blood and bone marrow, is a dangerous cancer-causing 24,500 deaths in the United States in 2017 [1].

About 62,130 new cases of leukemia have been de- tected in 2017, leading a large number of patients required to be diagnosed. Clinically and pathologi- cally, leukemia is subdivided into four main groups, acute myelogenous leukemia (AML), acute lym- phoblastic leukemia (ALL), chronic lymphocytic leukemia (CLL), and chronic myeloid leukemia

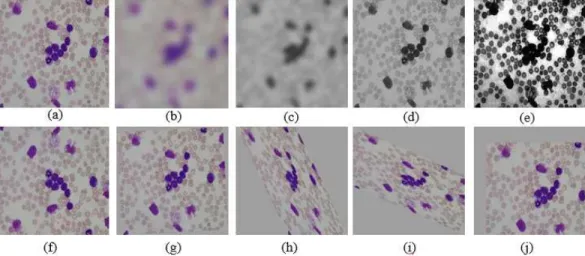
(CML). Among these, ALL and AML are known as the most dangerous types. Thus, the early de- tection and timely treatment of ALL and AML is essential to substantially prevent the rapid devel- opment of cancerous cells. According to the Cancer Treatment Centers of America [2], the acute types of leukemia (AML and ALL) can be classified based on the type of cell involved and how the cells look like under a microscope. For instances, the normal white blood cell, colored purple in Fig. 1 (a), has the similar size to that of surrounding red blood cells, while the leukemia blood cell has an

Classification of Leukemia Disease in Peripheral Blood Cell Images Using Convolutional Neural Network

Thanh Tran

, Jin-Hyuk Park

††

, Oh-Heum Kwon

†††

, Kwang-Seok Moon

††††

, Suk-Hwan Lee

†††††

, Ki-Ryong Kwon

††††††

ABSTRACT

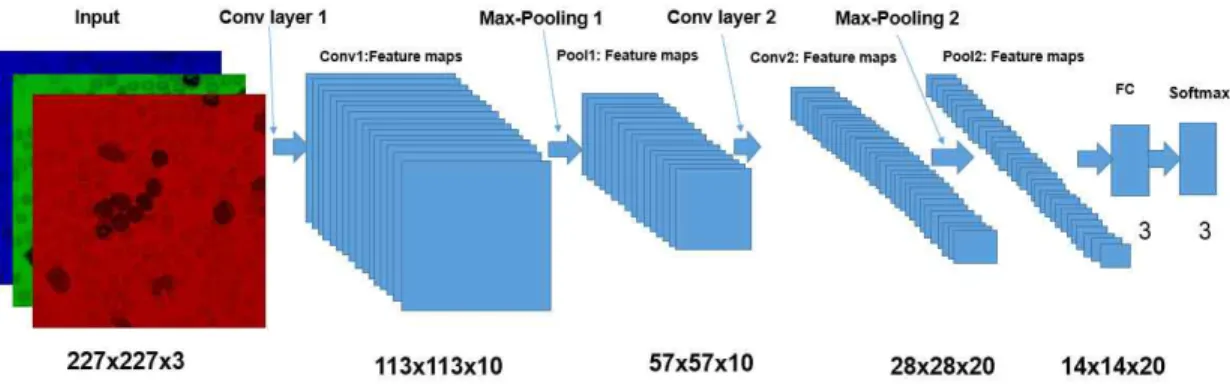
Classification is widely used in medical images to categorize patients and non-patients. However, conventional classification requires a complex procedure, including some rigid steps such as pre- processing, segmentation, feature extraction, detection, and classification. In this paper, we propose a novel convolutional neural network (CNN), called LeukemiaNet, to specifically classify two different types of leukemia, including acute lymphoblastic leukemia (ALL) and acute myeloid leukemia (AML), and non-cancerous patients. To extend the limited dataset, a PCA color augmentation process is utilized before images are input into the LeukemiaNet. This augmentation method enhances the accuracy of our proposed CNN architecture from 96.9% to 97.2% for distinguishing ALL, AML, and normal cell images.

Key words: Acute Leukemia, Convolutional Neural Network, Data Augmentation, Deep Learning, Image Classification

※ Corresponding Author : Kwang-Seok Moon, Address:

(608-737) 599-1, 45 Yongso-ro, Namgu, Busan, Korea, TEL : +82-51-629-6257, FAX : +82-51-629-6230, E-mail : kiryongkwon@gmail.com

Receipt date : Jul. 6, 2018, Revision date : Aug., 14, 2018 Approval date : Sep. 10, 2018

††

Dept. of IT Convergence and Application Engineering, Pukyong National University

(E-mail : thanhttp02@gmail.com)

††

Dept. of IT Convergence and Application Engineering, Pukyong National University

(E-mail : detdetplus@naver.com)

††††††

Dept. of IT Convergence and Application Engineer- ing, Pukyong National University

(E-mail : ohkwn@pknu.ac.kr)

††††††

Dept. of Electronics, Pukyong National University

††††††

Dept. of Information Security, Tongmyong University (E-mail : skylee@tu.ac.kr)

††††††

Dept. of IT Convergence and Application Engineer- ing, Pukyong National University

(E-mail : krkwon@pknu.ac.kr)

※ This research was supported by Basic Science Re-

search Program through the National Research Founda-

tion of Korea(NRF) funded by the Ministry of Science

and ICT (No. 2016R1D1A3B03931003, No. 2017R1A2B

2012456).

(2)

average size of two times bigger than that of red blood cells, as shown in Fig. 1 (b) and (c). This is a good feature to distinguish normal cell images from ALL and AML images. In most ALL cells, the nucleus occupies nearly 80-90% of the whole cell, whereas the nucleus area in an AML cell is about 50-60%. In addition, the surface of an ALL cell is smooth, but the cytoplasm area of an AML cell has some Auer rods which are short purple stripes illustrated in Fig. 1 (c).

There are three main methods for diagnosing leukemia, including a physical exam, blood tests, and a bone marrow examination. Leukemia can be detected during routine blood tests before the pa- tient has symptoms. If the patient has signs or symptoms, a physical exam may be required to check for any swollen or enlarged lymph nodes of the neck, axillary, and inguinal. A variety of blood tests might be performed to measure the number of white blood cells, red blood cells, and platelets.

Since leukemia causes a large number of abnormal white blood cells, resulting in a low number of red blood cells and platelets, a blood count exam can detect those changes and leukemia is hence identi- fied. Another method used in detecting leukemia is bone marrow examination. In this technique, a tissue sample taken from human hipbone or other large bones is used to detect cancer markers, called

“Flow cytometry”, and genetic markers. These aforementioned diagnosis methods must be strictly implemented by doctors in the laboratory environ-

ment with dedicated and specialized devices.

Moreover, the results of these complex examina- tions are much dependent on skills and experiences of specialists.

Most of the research related to leukemia classi- fication only focus on distinguishing between nor- mal cell and ALL images based on the ALL-IDB1 dataset. In this paper, we present a methodology utilizing a specific CNN architecture, called Leuke- miaNet, to classify ALL, AML, and normal cell images. This proposed method shows a com- parably precise technique of leukemia diagnosis, compared to three above-mentioned complex examinations. In addition, this technique is totally independent of technician experience, which is one of the main challenges of those conventional ex- aminations. An experiment is performed to eval- uate the accuracy of the proposed CNN architecture.

The result proves that LeukemiaNet can reach an accuracy of 97.2% when classifying ALL and AML. As a result, this work introduces a promis- ing solution to an early clinical leukemia diagnosis system in detecting leukemia and categorization of leukemia.

The rest of this paper is organized as follows.

Section 2 presents related works on applying image processing and conventional machine learning methods such as neural networks to detect leuke- mia. In section 3, we introduce state-of-the-art image augmentation methods and PCA color aug- mentation method of increasing the number of

(a) (b) (c)

Fig. 1. (a) Healthy white blood cell from non-leukemia patients, (b) ALL image, (c) AML image (the blue arrow indicates

an Auer rod).

(3)

images. A novel convolutional neural network, called LeukemiaNet, including 5 layers is also pro- posed in this section. Section 4 shows the experi- ment result and discussion. Finally, conclusions and future works are given in section 5.

2. RELATED WORKS

Usually, images in the used dataset are in JPG format. They are captured with a digital camera via an optical laboratory microscope. There is a need for enhancing the quality of images by using diverse image processing techniques, as mentioned in [3].

Because leukemia is a type of cancer found on white blood cells, most previous works try to seg- ment white blood cells rather than red blood cell and platelets, which are included in a blood cell images. In the cell segmentation phase, various methods such as thresholding, clustering, region growing, and color segmentation are used. The feature extraction step usually follows the seg- mentation step. In most of the cases, the author extracts features including energy, contrast, shape feature, color feature. These features are then used as the input to the next step to detect leukemia disease. In the classification stage, most resear- chers conducted conventional machine learning methods such as support vector machine (SVM), neural networks for classification.

In [4], the authors converted original blood cell images from RGB into CIE L*a*b, then used K- means for cell clustering. They extracted five tex- tural features, four Gray Level Co-occurrence Matrix (GLCM) and one fractal feature (Hausdorff Dimension) for the first neural network classifier to distinguish between normal and abnormal cell images. For the second neural network to classify ALL and AML images, geometrical features, in- cluding cell area, cytoplasm area, nucleus-to-cyto- plasm area ratio and nucleus-to-cell area ratio were used. The authors used a neural network ar-

chitecture for categorizing normal and abnormal cell images, then, ALL and AML images were classified from abnormal cell images using the same architecture. Because of the lack of dataset, the authors only focused on the first step to classi- fy ALL images from normal cell images. The accu- racy when classifying ALL and AML images was reported to reach 97.7%, but was only validated on the small dataset of 49 ALL images and 10 AML images.

In [5], the authors converted RGB images into grayscale images before applying median filtering to remove noise in grayscale images. In segmenta- tion stage, K-mean clustering was used to extract the nuclei of the leukocytes. A local directional pat- tern (LDP) was used in this paper for white blood cell feature extraction stage. In addition, the author used a support vector machine (SVM) to classify cancer and non-cancer cell images. The overall ac- curacy was 98% when the suggested method was performed over 90 images obtained from the American Society of Hematology. Besides the ad- vantage of using LDP operator for feature ex- traction, [5] showed a limitation that it only used AML images samples to build their model and fo- cused on distinguishing between AML images and non-leukemia images.

In [6], they proposed a HIS color space for the segmentation step and used some morphological operators such as dilation, closing, median filter to remove unwanted noise in images. Especially, the authors extracted three kinds of features, including geometrical features (area, length, and compact- ness features), color features (Hue, Saturation, and Intensity), and textural features. In the classi- fication stage, the author conducted an experiment on three methods for comparison, including Multi- layer Perceptron (MLPs), Support Vector Machine (SVM) and Hyper Rectangular Composite Neural Network (HRC-NNs). They figured out that the trained MLP yielded the highest performance.

However, the proposed system of [6] didn’t classify

(4)

leukemia subtype cells.

Research in [7] is not only used MLPs and SVM but also use Dempster-Shafer method for classify- ing normal and abnormal lymphocytic cells with 80 input features comprising texture, color, and shape-based information using bootstrap vali- dation, the authors show that the Dempster-Shafer achieves the highest accuracy of 96.72% when dis- tinguishing ALL and normal cells.

All aforementioned classification techniques for the detection of leukemia make use of traditional machine learning methods such as SVMs and neu- ral network. These classification models need a high number of significant and accurate features (such as pixel values, shape, texture, and color) for classification. The performance of most of the ma- chine learning algorithms depend on how accu- rately the features are extracted; therefore, the se- lection of features must be carefully made and is one of the most difficult and time-consuming steps.

This challenge leads to the motivation of this work, in which the complexity of featuring is tar- geted to be reduced while the accuracy remains high. With a deep learning framework such as CNN, not only classification can be performed with high accuracy, but the necessity of feature en- gineering is also reduced because a deep learning framework can create new features by itself.

Hence, in recent years, CNN is applied in a wide range of reality work such as face detection [8], forest insects’ classification [9].

For leukemia detection, the task is to identify which are the abnormal white blood cells in an im- age accompanied by multiple blood cells, including the red blood cells, the normal white blood cells, and the platelets. In machine learning approach, we would follow two steps which comprise of white blood cell detection and leukemia cell recognition using object recognition algorithm like SVM. On the contrary, in CNN approach, CNN architecture can do the process end-to-end, without the need

of dividing into two steps, just input an original cell image, and CNN model will label this image is patient with leukemia or non-patient.

Taking advantage of deep learning methods, in this work, the authors proposed using CNN to classify ALL, AML, and normal cell images. The details of our proposed method are introduced in the next part.

3. PROPOSED METHODOLOGY

A sufficient dataset of leukemia images is a challenge for our proposed method due to the pri- vacy of such images. Therefore, we perform two types of data augmentation to train accurate and robust CNN architecture. The first data augmenta- tion is conventional methods, in which available samples are transformed into new samples using some traditional affine transformation methods such as shear image, rotation, reflection, trans- lation, histogram equalization and so on. The sec- ond one is PCA color augmentation, as mentioned in [10].

3.1 Pre-processing images

3.1.1 Conventional image augmentation methods In this paper, to increase the number of images in the original dataset, we augment the dataset by applying following transformation methods.

Conversion of RGB images to grayscale im- ages

All RGB images in the dataset are converted to grayscale intensity images by discarding the satu- ration and hue in the original images while the lu- minance remains.

Blurring

A Gaussian filter is applied not only in the origi-

nal RGB images but also in grayscale images with

a scalar value for sigma generated randomly be-

tween [4, 8].

(5)

Histogram equalization [11]

Histogram equalization is used to enhance the contrast of a grayscale image. The image after be- ing applied histogram equalization has the higher contrast, as shown in Fig. 2(e).

Reflection

The image is symmetrically taken along the x-axis and the y-axis. Fig. 2 (f) depicts a reflection image of the image in Fig. 2 (a) along the x-axis.

Rotation

The image is rotated counterclockwise or clock- wise some angle which is generated randomly between. The image rotates clockwise if the angle has a negative value. The rotated image makes the output image large enough to contain the entire ro- tated image. Therefore, we have to resize the out- put image to the same size as the original image.

Translation

We conduct horizontal and vertical translation for images with the displacement value randomly chosen with a uniform distribution of between 25 and 50.

Shearing images [12]

A simple vertical and horizontal shear trans-

formation is applied to images with the value of distortion is chosen randomly between [0.3, 1], as illustrated in Fig. 2 (h) and (i).

3.1.2 PCA color augmentation

This method was first proposed by Alex Krizhevsky to increase the size of the dataset. [10]

The main concept of this method is altering the intensities of RGB channels in an image. PCA re- duces the number of dimensions in the data by finding patterns in the data.

There are 6 steps for performing PCA color aug- mentation which are summarized as below:

1. Each pixel of an image is composed of three vectors of red (R), green (G) and blue (B). PCA is then computed on these data points. Each chan- nel of an image is converted to a vector

2. Compute the means for 3 dimensions of each image m

i

with i : 1,2, 3:

(1)

2. Compute the covariance matrix. The co- variance matrix has a size of 3×3 because the data is 3 dimensional

Fig. 2. Conventional data augmentation, (a) An original ALL image, (b) A blurring ALL image, (c) A blurring grayscale

image, (d) A grayscale image, (e) Histogram equalization, (f) Reflection image through x-axis, (g) Rotated

image, (h) Shearing image along x-axis, (i) A shearing image along y-axis, and (j) Image translation.

(6)

(2) 4. Compute the eigenvector (e

1

, e

2

, e

3

) and corre- sponding eigenvalues (λ

1

, λ

2

, λ

3

)

5. Sort the eigenvectors from the highest to low- est and discard the lower eigenvalues. Choose k eigenvectors with the largest eigenvalues from a dxk dimensional matrix W. In W, every column represents an eigenvector.

6. Take the transpose of the vector and multiply it to the transposed original dataset, after that, take the transpose of the result. We need to add multi- ples of found principal components with magni- tudes proportional to the corresponding ei- genvalues times a random variable drawn from a Gaussian distribution with mean zero and standard deviation of 0.1.

PCA color augmentation changes those values based on which values are the most popular in the image. For instance, the image in Fig. 3 (a) has

heavy purple abnormal cells and minimal another color values. Therefore, after PCA color augmen- tation is applied, Fig. 3 (b) has their purple values altered the most, highlighting the abnormal white blood cells and blurring normal blood cells in the image.

3.2 The proposed CNN architecture

The utilization of deep learning helps image rec- ognition to reduce the error rate. This encourages the great innovation of image classification. In this paper, we propose a CNN architecture called Leu- kemiaNet. The experiment results described in the next section show that of with LeukemiaNet, a good accuracy is obtained when classifying Leuke- mia disease.

In Fig. 4, the input layer is in the dimension of [227x227x3] which corresponds to the height, width and the channel size of images. In this case, the channel size of the image is 3, corresponding to RGB values. In the convolutional layer, the filter is used for scanning along the input images. For instance, the first convolutional layer has the filter with a size of [4x4] and the number of neurons that connect to the same region of the input is 10 (the number of filters). We also utilize batch normal- ization after each convolutional layer to speed up network training and decrease the sensitivity to network initialization. The batch normalization is followed by a ReLu layer. Max pooling layer is

(a) (b)

Fig. 3. PCA color augmentation, (a) The original ALL image, and (b) ALL image after being applied PCA color augmentation.

Fig. 4. The proposed CNN architecture to classify three classes.

(7)

used in our CNN architecture to reduce the spatial size of the feature map by returning the maximum values of the region decided by the pooling size.

For example, the common pooling size is [2x2]. The fully connected layer (FC) follows the second con- volutional layer to combine all the features of the previous layers to identify the patterns. In our ex- periment, the output size of the FC layer is 3, cor- responding to 3 classes needed to be classified, in- cluding AML, ALL, and normal cell image, respectively.

After the last fully connected layer, we stack a softmax layer to normalize the output of the FC layer. The final layer of our CNN architecture is the classification layer. It uses the classification probabilities returned by the softmax activation function to assign the input to one of the classes and compute the loss.

4. EXPERIMENTAL RESULT AND DISCUSSION Our experiment was conducted on Matlab with NVIDIA GeForce GTX 1080 Ti. We implemented two experiments on different datasets to evaluate the robustness of augmentation strategies and the effectiveness of our proposed CNN architecture.

All of the experiments were run for 30 epochs at the learning rate of 0.001 with the input size image of [228x227x3].

4.1 Dataset

In this paper, the dataset includes 49 ALL im- ages and 59 normal cell images from the ALL- IDB1 database, among which 33 AML images are collected from the Internet. Because of insufficient data, the CNN architecture cannot learn many rich features. To improve the accuracy of our proposed CNN architecture, we extend the original dataset by applying some data augmentation methods such as blurring using Gaussian filter, histogram equal- ization, converting images to grayscale image, shearing image, image reflection, image trans-

lation, etc. [13]. The advantage of using data di- versification demonstrates that our CNN archi- tecture can handle a diversity of images collected from different research groups with different qual- ity (noisy images, tilted images, etc.).

4.2 Metrics to evaluate the performance of Leu- kemiaNet

In this paper, different performance metrics are utilized to evaluate the desired effects of Leukemi- aNet architecture.

A. Confusion matrix

A confusion matrix figures out a detailed item- ization of accurate and inaccurate classifications for each class, as illustrated in Fig. 5.

True positives (TP) is the case when the output class of an image and the target class are true. For instance, that occurs when a person is diagnosed with ALL and the LeukemiaNet classifies his case as ALL. In Fig. 5 (a), TP of ALL, AML, and the normal class correspond with 158 images, 101 im- ages, and 175 images.

On the contrary, true negatives (TN) is a case when the target class of the image is false and the output class is also false. The total number of TN for the ALL class, the AML class, and the normal class in Fig. 5 (a) is 278 images, 339 images, and 265 images, respectively.

False positives (FP), for example, is defined as the case when LeukemiaNet model predicts a non- cancerous person as a patient who has ALL. In Fig.

5 (a), the total number of FP for the ALL class is 8, for the AML class is 0, and for the normal class is 6.

False negatives (FN) is a case when the target

class of the image is true and the output class is

false. For example, a person having ALL and the

LeukemiaNet classifies this case as a non-cancer-

ous person or AML patient. The total number of

FN for the ALL class, the AML class, and the nor-

mal class are 4 images, 8 images, and 2 images,

(8)

respectively.

B. Accuracy

Accuracy is a good metric to evaluate Leukemia Net because the number of images in classes is approximately balanced. Accuracy is calculated by dividing the sum of correct classifications by the total number of images.

(3)

C. Precision

Precision is a measurement metric that figures out what proportion of images that LeukemiaNet predicted belong to a class, actually belong to this class.

(4) Using Equation (4), the precision of three classes in Fig. 5 (a) is 95.2%, 100%, and 96.7%, corre- sponding to ALL, AML, and normal class. Similar- ly, the precision of ALL class, AML class, and the normal class in Fig. 5 (b) is 95.4%, 96.5%, and 99.1%, respectively.

D. Recall (sensitivity)

Recall corresponds to the true-positive rate of the interested class.

(5) The sensitivity of three classes in Fig. 5 (a) and (b) is shown in Table 1.

E. Specificity

Specificity corresponds to the true-negative rate of the considered class.

(6)

4.3 Experiment results

Two experiments were conducted, one of which was based on the dataset extended using conven- tional data augmentation methods, whilst the other utilized the dataset extended using traditional data augmentation methods combined with the PCA color augmentation method to test the effective- ness of various augmentation methods. Table 1 shows the comparison of performance metrics of these two experiments.

The experiment on the dataset includes original and extended images using traditional data aug- mentation methods, notated as “Dataset 1”. We conducted LeukemiaNet on the dataset including 1,492 images in total after augmented by traditional augmentation methods. We used 1,228 images (373 Fig. 5. The confusion matrix of our proposed CNN architecture on different datasets, (a) The original dataset and

conventional augmented dataset; (b) The original dataset, conventional augmented dataset, and PCA color

augmentation.

(9)

ALL images, 262 AML images, 409 normal cell im- ages) for the training phase. There are 448 images (166 ALL images, 101 AML images, 181 normal cell images) for the testing phase. Therefore, the accuracy of this dataset reached 96.9%, as listed in Table 1.

The experiment on the dataset which was ex- tended using traditional data augmentation meth- ods combined with the PCA color augmentation method, notated as “Dataset 2”. The LeukemiaNet above was run on the dataset which has a total of 1,676 images were replicated by traditional methods combined with the PCA color augmenta- tion method. The accuracy obtained from this ex- periment is better than that from the first one, which is 97.2%, and 96.9%.

The comparison of Table 1 proves that Leuke- miaNet performs remarkably better on the dataset, including images was extended by traditional

methods combined with PCA color augmentation methods. The strategies combining traditional augmentation techniques with PCA color augmen- tation methods can significantly reduce the error rate of our proposed CNN architecture. Fig. 5 shows that PCA color augmentation can help Leukemia Net prevent overfitting.

For the purpose of evaluation, we also compare our method with existing state-of-the-art works, as shown in Table 2. In most recent works, leuke- mia classification is mainly based on computer vi- sion techniques. The vast majority of these consist of several steps: image pre-processing, clustering, morphological filtering, segmentation, feature se- lection or extraction, classification, and evaluation.

For the classification phase, most authors adopted conventional machine learning methodologies such as multilayer perceptron (MLP), and support vec- tor machine (SVM). Consequently, feature ex- Table 1. Performance metrics when training LeukemiaNet architecture on different datasets.

Dataset 1 Dataset 2

True positive (TP)

ALL 158 167

AML 101 110

Normal 175 212

True negative (TN)

ALL 278 323

AML 339 380

Normal 265 289

False positive (FP)

ALL 8 8

AML 0 4

Normal 6 2

False negative (FN)

ALL 4 5

AML 8 9

Normal 2 0

Accuracy 96.9% 97.2%

Precision

ALL 95.2% 95.4%

AML 100% 96.5%

Normal 96.7% 99.1%

Recall (sensitivity)

ALL 97.5% 97.1%

AML 92.7% 92.4%

Normal 98.9% 100%

Specificity

ALL 97.2% 97.6%

AML 100% 99%

Normal 97.8% 99.3%

(10)

traction is such the most important steps affected the error rate of the classification phase. Besides, all related works conduct on a small and homoge- nous dataset. In this paper to overcome previously weakness of related works, a CNN architecture called LeukemiaNet was conducted. LeukemiaNet can extract high-level features and perform classi- fication at the same time. Hence, this architecture is not only skipped most time-consuming pre-pro- cessing steps, but also it can handle the variety of leukemia image from diverse research institutes.

Table 2 shows that there are no studies classify ALL, AML, and normal cell images, like the one proposed in this work. Almost all of these works focus on classifying non-cancer and cancer patients.

We remind that the accuracy rate after using LeukemiaNet is outperformer than conventional methods shown in Table 2.

5. CONCLUSION

In this work, two data augmentation strategies to extend dataset to prevent overfitting and memo-

rize the exact details of the training images were implemented. While traditional augmentation meth- ods are easy to apply and not consume time, the other techniques to extend dataset show a promis- ing solution to help to reduce the error rate of CNN architecture. Besides, we proposed LeukemiaNet convolutional neural network architecture to detect effectively ALL, AML images from normal cell im- ages with high accuracy. The proposed CNN ar- chitecture was experimented on two separate data- sets, one with data extended using traditional methods only and the other with extended data us- ing a combination of traditional and PCA color augmentation methods, to confirm that our net- work can deal with the variation of images. The accuracy and efficiency of LeukemiaNet archi- tecture was also validated, in need reliable dataset of leukemia image. In future work, we would like to apply this proposed method in a huge dataset including four types of Leukemia (AML, ALL, Chronic lymphocytic leukemia - CLL and Chronic myelogenous leukemia – CML).

Table 2. Comparison of the accuracy between recent works and our proposed methodology

Work Classify methods Classified objects Number of

images Accuracy Screening of bone marrow

slide images for leukemia using multilayer perceptron (MLP) (2011) [14]

Multilayer perceptron (MLP) network and the Levenberg Marquardt (LM) training algorithm

142 normal bone Marrow and 858 abnormal bone

Marrow samples 1000 94.5%

Leucocyte classification for leukaemia detection using image processing techniques (2014) [15]

Support vector machine (SVM) with a Gaussian radial basis kernel

245 of 267 total leucocytes

of 33 ALL images 33 93%

Recognition of acute lymphoblastic leukemia cells in microscopic images using k-means clustering and support vector machine classifier (2015) [16]

Support vector machine (SVM)

21 peripheral blood smear and bone marrow slides of 14 patients with ALL and

7 normal people 21 97%

Proposed methodology (LeukemiaNet)

Convolutional Neural Network (CNN)

ALL, AML, and normal

cell images 1676 97.2%

(11)

REFERENCES

[ 1 ] Leukemia: What you need to know. https://

www.medicalnewstoday.com/articles/142595.

php (accessed Dec., 25, 2017).

[ 2 ] Leukemia stages. https://www.cancercenter.

com/leukemia/stages/ (accessed Apr., 30, 2018).

[ 3 ] C. Raje and J. Rangole, "Detection of Leuke- mia in Microscopic Images using Image Pro- cessing," Proceedings of 2014 International Conference on Communication and Signal Processing, Melmaruvathur, pp. 255-259, 2014.

[ 4 ] I. Vincent, K.R. Kwon, S.H. Lee, and K.S.

Moon, "Acute Lymphoid Leukemia Classifi- cation using Two-Step Neural Network Clas- sifier," Proceedings of 2015 21st Korea-Japan J oint Workshop on Frontiers of Computer Vision (FCV), pp. 1-4, 2015.

[ 5 ] D. Goutam and S. Sailaja, "Classification of Acute Myelogenous Leukemia in Blood Mi- croscopic Images using Supervised Classi- fier," Proceedings of 2015 IEEE International Conference on Engineering and Technology (ICETECH), Coimbatore, pp. 1-5, 2015.

[ 6 ] M.C. Su, C.Y. Cheng, and P.C. Wang, "A Neural-Network-Based Approach to White Blood Cell Classification," The Scientific World Journal, Vol. 2014, Article ID 796371, 9 pages, 2014.

[ 7 ] S.C. Neoh, W. Srisukkham, L. Zhang, S.

Todryk, B. Greystoke, C.P. Lim, et al., "An Intelligent Decision Support System for Leu- kaemia Diagnosis using Microscopic Blood Images," Scientific Reports, Vol. 5, pp. 1-14, 2015.

[ 8 ] J. Song, H.I. Kim, and Y.M. Ro, "Fast and Robust Face Detection based on CNN in Wild Environment," J ournal of Korea Multimedia Society, Vol. 19, No. 8, pp. 1310-1319, 2016.

[ 9 ] S.W. Park and D.Y. Kim, "Performance Comparison of Convolution Neural Network

by Weight Initialization and Parameter Update Method1," J ournal of Korea Multimedia Society, Vol. 21, No. 4, pp. 441-449, 2018.

[10] A. Krizhevsky, I. Sutskever, and G.E. Hinton,

"ImageNet Classification with Deep Convolu- tional Neural Networks," NIPS’ 12 Proceed- ings of the 25

th

International Conference on Neural Information Processing Systems, Vol.

1, pp. 1097-1105, 2012.

[11] S. Kansal, S. Purwar, and R.K. Tripathi,

"Trade-off between Mean Brightness and Contrast in Histogram Equalization Techni- que for Image Enhancement," 2017 IEEE International Conference on Signal and Image P rocessing Applications (ICSIP A), pp. 195- 198, 2017.

[12] Padding and Shearing an Image Simultaneousl.

https://www.mathworks.com/help/images/

padding-and-shearing-an-image-simultane- ously.html (accessed Dec., 24, 2017).

[13] L, Perez and J. Wang, "The Effectiveness of Data Augmentation in Image Classification using Deep Learning,", eprint arXiv:1712.04621, 2017.

[14] E. U. Francis, M. Y. Mashor, R. Hassan, and A. Abdullah, "Screening of Bone Marrow Slide Images for Leukemia Using Multilayer Perceptron (MLP)," 2011 IEEE Symposium on Industrial Electronics and Applications, Langkawi, pp. 643-648, 2011.

[15] L. Putzu, G. Caocci, and C.D. Ruberto, "Leu- cocyte Classification for Leukaemia Detection using Image Processing Techniques," Artifi- cial Intelligence in Medicine, Vol. 62, No. 3, pp. 179-191, 2014.

[16] M.M. Amin, S. Kermani, A. Talebi, and M.G.

Oghli, "Recognition of Acute Lymphoblastic

Leukemia Cells in Microscopic Images Using

K-Means Clustering and Support Vector

Machine Classifier," Journal of medical sig-

nals and sensors, Vol. 5, pp. 49-58, 2015.

(12)

Tran Thi Phuong Thanh received the B.S. degree in In- formation Technology from Wa- ter Resources University, Viet- nam, in 2015. She is currently studying a master course in IT Convergence and Application Engineering at Pukyong Natio- nal University, Korea. Her research interests include digital signal and image processing, bioinformatics, and deep learning.

Jin-Hyeok Park

received the B.S. degree in Com- puter Software Engineering from Donggeui University, Korea in 2013 and he received an M.S.

degree in IT Convergence and Application Engineering in Puk- yong National University, Korea in 2015. He is currently studying Ph.D. course in IT Convergence and Application Engineering at Pukyong National University, Korea. His research interests in- clude digital signal and image processing and data compression.

Oh-Heum Kwon

received the B.S. degree in com- puter engineering from Seoul National University in 1988, and the M.S. and Ph.D. degrees in computer science from the Korea Advanced Institute of Science and Technology in 1991 and 1996 respectively. He is currently a professor in the Dept.

of IT Convergence and Application Engineering at Pukyong National University, Busan, and Republic of Korea. His research interests include design and anal- ysis of algorithms and distributed computing.

Kwang-Seok Moon received the B.S., M.S., and Ph.

D degrees in Electronics Engin- eering in Kyungpook National University, Korea in 1979, 1981, and 1989 respectively. He is currently a professor in depart- ment of Electronic Engineering at Pukyong National University. His research interests include digital image processing, video watermarking, and multimedia communication.

Suk-Hwan Lee

received a B.S., a M.S., and a Ph.D. Degrees in Electrical Eng- ineering from Kyungpook Na- tional University, Korea in 1999, 2001, and 2004 respectively. He is currently an associate pro- fessor in Department of Infor- mation Security at Tongmyong University. His re- search interests include multimedia security, digital image processing, and computer graphics.

Ki-Ryong Kwon

received the B.S., M.S., and Ph.D. degrees in electronics en- gineering from Kyungpook Na- tional University in 1986, 1990, and 1994 respectively. He worked at Hyundai Motor Company from 1986-1988 and at Pusan Univer- sity of Foreign Language from 1996-2006. He is cur- rently a professor in Dept. of IT Convergence &

Application Engineering at the Pukyong National University. He has researched University of Minnesota in USA on 2000-2002 with Post-Doc, and Colorado State University on 2011-2012 with visiting professor.

He was the General President of Korea Multimedia

Society from 2015-2016. He is also a director of IEEE

R10 Changwon section. His research interests are in

the area of digital image processing, multimedia se-

curity and watermarking, bioinformatics, weather ra-

dar information processing.

수치

Fig. 2. Conventional data augmentation, (a) An original ALL image, (b) A blurring ALL image, (c) A blurring grayscale  image, (d) A grayscale image, (e) Histogram equalization, (f) Reflection image through x-axis, (g) Rotated  image, (h) Shearing image alo
Fig. 4. The proposed CNN architecture to classify three classes.
Table 2 shows that there are no studies classify ALL, AML, and normal cell images, like the one proposed in this work

참조

관련 문서

1 John Owen, Justification by Faith Alone, in The Works of John Owen, ed. John Bolt, trans. Scott Clark, "Do This and Live: Christ's Active Obedience as the

The design method for the optimization of FRP leaf spring is proposed by applying design method of experiment in order to improve the characteristics of

In order to get the feature of pedestrian, a block-by-block histogram is created using the direction of the gradient based on HOG (Histogram of

We have implemented and developed a virtual angioscopy system based on the proposed methods, and tested it using several actual data sets of human blood

In this paper, it is implemented the image retrieval method based on interest point of the object by using the histogram of feature vectors to be rearranged.. Following steps

To assess the clinical usefulness of performing Q-PCR in practice as a diagnostic technique, we compared blindly the Q-PCR results using blood samples of the

In this chapter, we introduce unsupervised pattern recognition using a spiking neural network (SNN) based on the proposed synapse device and neuron circuit.. Unsupervised

An RNN model is neural network architecture using a single layer or multiple layers, consisting of circulation connections, commonly applied for learning the