서 론
방사선치료에서 CT number(Hounsfield Unit)에 의해 나타나는 조직의 묘사 및 전자밀도는 전산화단층촬영(이 하 CT: Computed Tomography) 기반의 전산화치료계 획 정확성을 보장하는데 중요한 역할을 한다.
책임저자 : 박자람, 서울아산병원 방사선종양학과 서울특별시 송파구 올림픽로43길 88 Tel: 02) 3010-4411
E-mail: [email protected]
방사선치료 시 Metal artifact reduction Algorithm의 임상적용 유용성평가
서울아산병원 방사선종양학과
박자람, 김민수, 김정미, 정현숙, 이충환, 백금문
목 적: 방사선치료에서 CT number에 의해 나타나는 조직의 묘사 및 전자밀도는 CT(Computed Tomog- raphy)기반의 전산화치료계획 정확성을 보장하는데 중요한 역할을 한다. 하지만 체내의 금속 이식물은 CT number의 정확성을 감소시킬 뿐 아니라 조직 묘사에 대한 불확실성을 나타내기 때문에 임상에서는 metal artifact를 감소시킬 수 있는 알고리즘이 개발되었다. 이에 본 연구에서는 본원에서 사용하고 있는 GE사의 SMART MAR의 CT number 정확도를 평가하고 방사선치료에서의 유용성에 대해 평가하고자 한다.
대상 및 방법: 영상평가를 위해 CIRS ED phantom을 이용하여 6개 조직의 rod를 삽입하여 동일한 체적의 ROI를 형성 후 original 영상을 획득하고 의료용 티타늄 rod를 삽입하여 non-SMART MAR 영상과 SMART MAR영상을 획득하여 CT number와 SD값을 비교하였다. Metal artifact로 인해 CT number 변화에 따른 선량변화 확인을 위해 전산화계획시스템 Epclipse를 사용하여 CIRS ED phantom CT 영상에 PTV를 형성 하여 original 영상을 획득하고 편측 티타늄 삽입, 양측 티타늄 삽입 영상을 획득하여 non-SMART MAR 와 SMART MAR영상에 동일한 치료계획을 수립하여 PTV가 받는 평균처방선량, HI(Homogeneity Index), CI(Conformity Index)를 비교, 분석하였다. 흡수선량 측정은 원통형 아크릴 팬텀과 0.125 cc ionchamber, electrometer를 이용하여 선량변환상수(cCy/nC)를 계산하고 CIRS phantom을 이용하여 편측, 양측 티타늄 rod를 삽입한 영상으로 non-SMART MAR와 SMART MAR 영상을 획득하여 동일한 지점에서의 흡수선량 을 측정하여 전산화치료계획상의 point dose와 비교하였다.
결 과: 영상평가 결과 CT number는 non-SMART MAR영상보다 SMART MAR 영상이 original영상에 더 유사한 값이 나왔고 SD값은 SMART MAR영상에서 더 감소되었다. 선량평가 결과 평균처방선량과 HI 및 CI 값은 SMART MAR 영상보다 non-SMART MAR 영상이 original 영상에 더 근접한 결과가 나왔지만 통계 적으로 유의하지 않았다. 흡수선량 측정결과 치료계획상의 point dose와 실제 흡수선량과의 차이가 non- SMART MAR의 영상에서는 각각 2.69, 3.63 %의 차이가 있었지만 SMART MAR영상에서는 0.56, 0.68 %로 감소하였다.
결 론: 금속 이식물을 삽입한 환자의 CT 영상에 SMART MAR를 적용했을 때 CT number 정확성 상승 및 SD 감소로 영상의 질이 향상되므로 종양과 정상조직의 윤곽도 생성 및 선량계산 시 유용할 것으로 사료된다.
▶ 핵심용어: 금속에 의한 인공물, CT number, MAR
하지만 Metal Implant(금속성 이식조직)은 심각한 CT 영상 금속 인공물(이하 metal artifact)을 나타낼 수 있다.(1) 특히 최근에는 여러 재질의 금속을 이용한 시술 및 수술이 많아지고 있는 의료 환경에서 metal artifact는 인체 내부 의 해부학적 정보뿐만 아니라 선량계산에 필요한 각 조직 의 전자밀도와 체적 등의 정보를 제공하는데 많은 지장을 주고 있다.(2-3)
Metal artifact는 고관절 수술에 사용하는 티타늄등과 같이 CT 이미지 내부의 원자번호가 높은 물질을 투과하 거나 근처를 지나는 X-ray 빔이 크게 감약되고 산란이나 Beam-hardening effects, 광자부족현상, Edge effects 등에 의해 훨씬 많은 신호의 실수가 생기는 오류로 금속 인 공물 주위에 검은 줄무늬를 만들어 내는 현상이다.(4-5)
이러한 metal artifact는 종양 및 조직묘사에 대한 신뢰 도를 떨어뜨릴 뿐 아니라, CT number의 정확성에 심각한 영향을 미치기도 한다. 또한 금속성 이식조직으로 인해 왜 곡되고 불분명해진 CT 영상으로 치료계획을 세울 때 임상 의들은 표적과 그 주변의 임상적 구조의 윤곽을 잡을 때 임상적 경험을 토대로 추측에 의존해야 한다. 특히 고관절 에 커다란 인공 관절을 삽입한 환자의 CT 영상의 경우 더 많은 metal artifact로 인해 더욱 큰 영상의 왜곡을 초래할 수 있다.(6-7)
이렇게 CT 장비 특성상 금속성 이식조직을 몸에 삽입한 환자에 대한 metal artifact로 영상의 조직 묘사에 대한 불 확실성을 줄이고 또 그에 따른 치료계획에 중요한 영항을 미치는 CT number의 정확성을 높이고자 Metal Artifact Reduction(이하는 MAR로 표기)을 활용한 기법이 임상에 서 사용되고 있다. Philips의 O-MAR(Metal artifact re- duction for orthopedic implants), Toshiba의 Aquilion 의 SEMAR(Single energy projection for metalic arti- fact reduction), Siemens의 iMAR가 대표적이다.(8-10)
이에 본 연구에서는 metal artifact를 줄이기 위한 여러 가지 방법들 중 GE사에서 개발한 SMART Metal Artifact Reduction(이하 SMART MAR)을 이용하여 metal ar- tifact가 없는 original 영상과 SMART MAR영상, non- SMART MAR영상을 비교 분석하여 CT number 정확성 에대해 검증하고 획득한 SMART MAR영상을 전산화치료 계획에 이용 시 선량변화를 평가하고 흡수선량을 측정하
여 방사선치료에서의 SMART MAR의 유용성을 평가하고 자 한다.
대상 및 방법
1. 사용장비 및 팬텀
CT scan에 사용된 장비는 본원에 설치된 CT simulator (Discovery CT590 RT, GE, waukesha, USA)를 사용하 였고 팬텀은 CIRS ED Phantom을 사용하여 고관절 영역 을 시뮬레이션 했다. 이 팬텀은 직경이 40 mm이며, 조직의 비 균질성을 묘사하기 위해 다양한 조직의 밀도를 가지고 있는 17개의 rod(d = 30 mm, L = 45 mm)가 포함되었다.
Metal artifact를 발생하게 할 높은 원자번호의 물질은 골반부위 수술에 가장 많이 이용되고있는 의료용 티타늄 (밀도 4.51 g/cm3)을 제작하였다. 모든 CT 스캔은 스캔 및 보정이 기하학적으로 일치하도록 설정값들(120 kVp, 180 mAs, 2.5 mm slice thickness)을 동일하게 했다.
전산화치료계획은 Epclise(version 13.6, Varian, Palo Alto, USA)를 이용하여 치료계획을 수립했다.
방사선치료 장비는 TrueBeam STxTM (VarianMedi- calSystems, PaloAlto, USA)를 이용하였고, 흡수선량측 정에는 PTW N31005 0.125 cc ion chamber와 Dose-1 electrometer를 사용하였다. 흡수선량을 계산 시 필요한 선량변환상수(cGy/nC)를 알기위해 직경 18 cm 원통형 아 크릴 팬텀을 이용하였다.
2. 연구방법
1) 영상 평가방사선치료에서 전산화치료계획 시 CT number는 전자 밀도로 변환되어 선량계산에 이용되므로 CT number의 정확성에대한 평가는 필수적이다. 따라서 SMART MAR를 적용한 영상의 CT number에 대한 정확성에 대해 평가하 였다.
1차 스캔은 금속을 삽입하지 않은 Original CT 영상을 획득했고 2차 스캔은 팬텀 내에 티타늄 rod를 삽입하여 영 상을 획득하였고(non-SMART MAR) 획득한 영상으로 SMART MAR를 적용시켜 artifact가 감소한 영상(SMART
MAR)을 획득했다.
non-SMART MAR와 SMART MAR 영상에서 티타늄 rod로부터 6 cm 떨어져 있는 metal artifact의 영향을 받 은 폐, 뼈, 근육, 지방, 간, 유방 rod에 동일한 체적(직경 20 mm, 부피 13 cm3)의 ROI(region of interest)를 설정하 고 CT number와 SD값을 비교하였다(Fig. 1).
CT number와 SD는 다음과 같은 공식으로 구할 수 있 다.11)
(1)
= 조직의 선감약계수 = 물의 선감약계수 (2)
N = 전체 픽셀의 수
Xi = 각 픽셀의 CT number
X = 픽셀들의 CT number 평균치
2) 선량 평가
Metal artifact로 인해 주변 조직의 CT number값의 변화가 있을 때 선량변화를 확인하기 위하여 CIRS ED phantom을 이용하여 약 13 cm 떨어진 두 rod에 뼈 rod 를 삽입하여 metal artifact가 없는 Original CT영상을 획득하였다. 획득한 영상에 골반부위의 대표적인 치료인 prostate와 cervix와 같이 유사한 모양과 크기로 두 개 의 뼈 rod 사이에 Target1,2 체적을 형성했다(Fig. 2). 그리 고 prostate PTV와 유사한 체적 Target1에는 15MV, 1회 처방선량 100 cGy, Rapid Arc로 전산화치료계획을 수립 하였고, cervix PTV와 유사한 체적 Targer 2의 영상에는 15MV, 1회 처방선량 100 cGy, 7개 field의 IMRT로 전산화 치료계획을 수립하였다.
뼈 rod를 대신하여 티타늄 rod를 편측, 양측에 삽입하여 metal artifact가 발생한 영상을 획득하고(non-SMART MAR) SMART MAR 알고리즘을 적용하여 metal artifact
(a) (b)
(c)
Fig. 1. Test of measurement of CT number accuracy (a) original CT image(metal free)
(b) non-SMART MAR image (c) SMART MAR image
가 감소된 재구성 영상을 획득하였다. original 영상에 수 립된 Target의 체적 및 치료계획을 non-SMART MAR 영 상과 SMART MAR 영상에 동일하게 적용했다(Fig. 3, 4).
Target의 평균선량(mean dose), HI(Homogeneity Index), CI(Conformity Index) 값을 original영상을 기
준으로 비교, 분석하였다.(12)
① HI(Homogeneity Index)
HI는 동질성 지표로써 PTV 내에서 선량의 균질성(uni- formity)에 대해 평가하는 인자로써 HI값이 작거나 1에 가
(a) (b)
Fig. 2. Contouring of Target1 and Target2 (a) Target1 simulated Prostate PTV (b) Target2 simulated Cervix PTV
(a) (b) (c)
(d) (e)
Fig. 3. Dose and dosimetrical index comparison of Target1 plan
(a) Original CT image plan (metal free)
(b) 1T non-SMART MAR plan
(c) 1T SMART MAR plan
(d) 2T non-SMART MAR plan
(e) 2T SMART MAR plan
까울수록 PTV 내에서 더 균등한 선량분포가 이루어졌다 고 할 수 있고 다음과 같은 계산식으로 구할 수 있다.
② CI(Conformity Index)
CI는 PTV volume에 대해 처방선량의 95 %를 받는 PTV의 비율을 정의함으로써 치료계획의 conformity의 정도를 의미하며 다음과 같은 계산식으로 구할 수 있다.
3) 흡수선량 측정
흡수선량 계산에 필요한 선량변환상수를 구하기 위해 원통형 아크릴 팬텀에 ionchamber를 삽입 후 갠트리 각 도 0, 90, 270, 180도에서 Field size 10×10 cm2, Beam energy 15MV로 100 cGy을 조사하여 29.809(cGy/nC)의 선량변환상수를 계산했다.
non-SMART MAR와 SMART의 실제 흡수선량과 치 료계획상의 dose를 동일한 위치에서 비교하기 위해 CIRS
phantom에 ionchamber를 삽입하여 측정첨의 위치가 CT center로부터 X축 -0.3, Y축 -0.8, Z축 0 지점인 것 을 확인했다. 선량평가에 이용된 Target2의 5개의 전산화 치료계획(original 영상, 편측 티타늄 rod 삽입한 non- SMART MAR와 SMART MAR영상, 양측 티타늄 rod 삽 입한 non-SMART MAR와 SMART MAR영상)으로 CIRS ED phantom에 방사선을 조사했다.
실제 측정된 전하량에 선량변환상수를 곱해 흡수선량 을 계산하고 non-SMART MAR, SMART MAR영상에서 CT center로부터 X축 -0.3, Y축 -0.8, Z축 0 지점이 치료 계획상 point dose를 비교하였다.
결 과
CIRS ED phantom을 이용한 CT 영상 검증 결과 티 타늄 rod 주변의 폐, 뼈, 근육, 지방, 간, 유방 조직에 해당 하는 6개의 지점의 CT number를 oringal영상과 non- SMART MAR, SMART MAR영상을 각각 비교한 결과 CT number의 차이가 non-SMART MAR영상에서는 15~62
(a) (b) (c)
(d) (e)
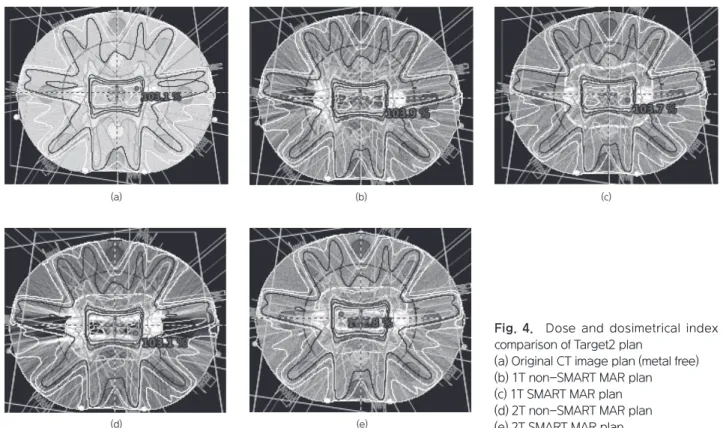
Fig. 4. Dose and dosimetrical index comparison of Target2 plan
(a) Original CT image plan (metal free) (b) 1T non-SMART MAR plan (c) 1T SMART MAR plan (d) 2T non-SMART MAR plan (e) 2T SMART MAR plan
HU의 비교적 큰 차이를 보였으나, SMART MAR 적용영 상에서는 0~23 HU의 차이로 original CT 영상과 근접한 CT number값을 보였다. 그리고 SMART MAR를 적용한 CT영상의 SD값은 non-SMART MAR 영상보다 모두 감 소되었다.
선량변화 비교 결과 original 영상을 기준으로 SMART MAR의 영상의 mean dose, HI, CI값이 non-SMART MAR영상보다 차이가 더 작은 것으로 나타났다. 특히 original 영상과의 차이에서는 티타늄 rod가 한 개인 편 측 고관절 영상에서보다 artifact가 더 많이 발생된 양측
Table 2. The mean CT number and SD of 6 points in the CIRS phantom (단위: HU)
Original non-SMART MAR SMART MAR
CT number SD CT number SD CT number SD
volume1
(Lung) -766.135 14.131 -703.846 29.265 -789.876 21.868
volume2
(Liver) 55.149 10.374 39.824 24.937 53.554 13.624
volume3
(Bone) 217.088 10.932 252.177 22.038 216.885 20.615
Volume4
(Adipose) -61.455 10.597 -47.621 26.605 -57.868 16.051
Volume5
(Breast) -22.353 11.021 -39.289 30.984 -19.83 15.975
Volume6
(Muscle) 46.607 10.776 71.402 22.094 44.020 13.825
SD: standard deviation
Table 3. The mean dose, HI and CI at Target1 and Target2 in the CIRS phantom
Original non-SMART MAR SMART MAR
Target1
1T
Mean dose(%) 102.8 101.8 102.8
HI 1.088 1.095 1.087
CI 0.87 0.84 0.86
2T
Mean dose(%) 102.8 101.3 103
HI 1.088 1.108 1.087
CI 0.87 0.74 0.81
Target2
1T
Mean dose(%) 99.4 97.3 99.5
HI 1.094 1.103 1.097
CI 0.50 0.18 0.51
2T
Mean dose(%) 99.4 95.3 98.3
HI 1.094 1.110 1.099
CI 0.50 0.3 0.36
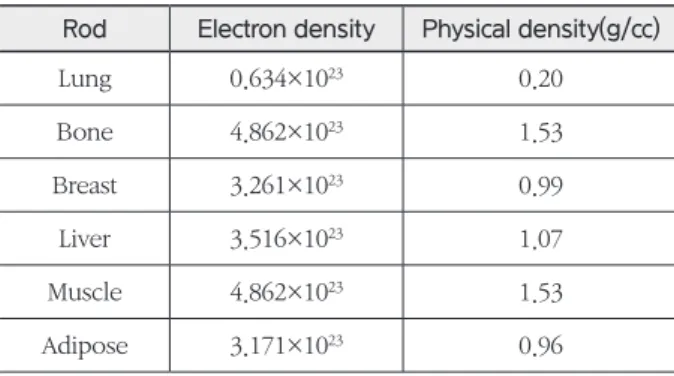
Table 1. Electron dinsity and Physical density of CIRS phantom
Rod Electron density Physical density(g/cc)
Lung 0.634×10²³ 0.20
Bone 4.862×10²³ 1.53
Breast 3.261×10²³ 0.99
Liver 3.516×10²³ 1.07
Muscle 4.862×10²³ 1.53
Adipose 3.171×10²³ 0.96
에 두 개인 영상에서 더 차이가 크게 나타났고, PTV가 양 측 고관절의 앞쪽으로 형성된 Target1 보다 가운데 형성되 어 metal artifact의 영향을 많이 받는 Target2에서 크게 나타났다.
흡수선량 측정 결과 metal artifacrt가 없는 original 영 상에서는 전산화치료계획상의 point dose와 실제 흡수선 량 측정값이 각각 99.1, 99.11로 0.01 %의 차이를 보이며 거의 동일하게 측정되었다. 티타늄 rod를 삽입한 측정에서 는 non-SMART 영상으로 치료계획을 세웠을 때에는 실 제 흡수선량과 2.69 %, 3.63 % 차이가 났고 SMART MAR 으로 재구성한 영상으로 치료계획을 세웠을 때에는 0.56
%, 0.68 %로 편측, 양측 티타늄 삽입 시 모두 non-smart MAR영상에 치료계획을 세웠을 때 보다 SMART MAR를 이용하여 치료계획을 세웠을 때 point dose가 실제 흡수 선량과의 차이가 더 작았다.
결 론
인체 내 금속인공물이 삽입된 경우 삽입된 부위에서는 물론 금속 주위에는 금속 인공물에 의한 artifact가로 인 해 해부학적 구조물을 정확하게 확인할 수 없을 뿐만 아니 라 CT number에도 영향을 미쳐 전산화치료계획 시 오류 를 줄 수 있다.
이러한 금속물질로 인해 발생하는 artifact를 감소시키 기 위해 다양한 재구성방법들이 연구되고 많은 성공을 거 두어 왔다.
본 연구에서 사용한 GE사의 SMART MAR의 기법은 금속이 있는 CT 영상에서 재구성하였을 때 금속이 없었 을 때와 유사하게 CT number를 재현해주고 SD값을 감 소시킴으로써 좋은 영상 질을 만들어낼 수 있는 유용한 방법이다.
또한 SMART MAR가 적용된 영상을 이용한 치료계획 이 original 영상의 치료계획과 유사함을 확인할 수 있었 으며 흡수선량 측정 시에도 치료계획상 point dose와 실 체 측정값의 오차가 1 % 미만이였으므로 smart mar의 영 상을 적용한 전산화치료계획 시 보다 정확한 선량전달이 이루어질 것이다.
SMART MAR를 이용하면 metal artifact로 왜곡되고 불분명해진 정상조직 및 종양조직의 윤곽을 잡을 때 임상 의들은 임상적 경험을 토대로 추측에 의존해야 하는 현재 의 한계점을 개선할 수 있다.
이와 같은 결과로 고 밀도 인공물 존재 시 SMART MAR 를 적용한 CT 영상은 임상적용에 있어 매우 유용할 것이라 사료된다.
하지만 본 실험에서는 실험대상이 팬텀만을 통해 진행되 었을 뿐 다양한 실제 환자의 치료계획에 적용하지 못한 한 계점이 있었다.
SMART MAR는 방사선치료 시 치료계획의 영상으로서 CT number의 정확성도 높여주고 더욱 선명한 영상을 제 공하기 때문에 이용 가치가 있지만 연구적으로는 metal artifact reduction 프로그램을 여러 번 반복재구성하여 더욱 질 좋은 영상을 제공하는데 반면 임상적으로 이용 시 에는 단 한 번의 재구성만 가능하기 때문에 metal artifact Table 4. Absorbed dose comparison of non-SMART MAR and SMART MAR
D_plan (cGy)
Q_meas
(nC) D_meas (cGy) (D_meas-D_plan)/D_plan×
100(%)
Original 99.1 3.325 99.11 0.01
1T
non-SMART MAR 99.1 3.414 101.77 2.69
1T
SMART MAR 101.2 3.414 101.77 0.56
2T
non-SMART MAR 98 3.407 101.56 3.63
2T
SMART MAR 101 3.41 101.69 0.68
가 많이 발생한 영상에서는 SMART MAR를 이용하여 재 구성하여도 artifact가 다소 남아있는 한계점이 있을 수 있 을 것이라 생각된다.
참고문헌
1. Hua Li, Camille Noel, Haijian Chen, and H. Harold Li: Clinical evaluation of a commercial orthopedic metal artifact reduction tool for CT simulations in radiation therapy.
2. L. BedosxL. Bedos: CT Number Accuracy Assess- ment of a New Metal Artifact Reduction Algorithm for CT Simulations in Radiation Therapy.
3. Dong Hun Kim, Jo Nam Byun, Chang Hoon Moon, Jeong Hwan Jang.: Usefulness of Metal Artifact Re- duction for Metal Implants in Computed Tomogra- phy Angiography.
4. F Edward Boas & Dominik Fleischmann: CT arti- facts: Causes and reduction techniques.
5. Jessie Y Huang, James R Kerns, Jessica L Nute, Xin- ming LiuAn: An evaluation of Three commercially available metal artifact reduction methods for CT imaging 2015.
6. Hilgers G1, Nuver T, Minken A.: The CT number ac- curacy of a novel commercial metal artifact reduc- tion algorithm for large orthopedic implants.
7. Kai Higashigaito, MD, Florian Angst, MD, Val M.
Runge, MD: Metal Artifact Reduction in Pelvic Computed Tomography With Hip Prostheses Com- parison of Virtual Monoenergetic Extrapolations From Dual-Energy Computed Tomography and an Iterative Metal Artifact Reduction Algorithm in a Phantom Study.
8. Philips Healthcare System: Metal Artifact Reduction for Orthopedic Implants(O-MAR). 2013.
9. General Electric Healthcare Company: Smart Metal Artifact Reduction (MAR). 2016.
10. Toshiba upgrades CT scanner with metal artifact reduction By AuntMinnie.com staff writers.
11. Hilgers G1, Nuver T, Minken A.: The CT number accuracy of a novel commercial metal artifact re- duction algorithm for large orthopedic implants.
12. H. A. Sharyan, S. H. Allehyani, A. R. Tolba: Dosi- metric Comparison of 3DCRT Versus RapidArc in Terms of Iso-dose Distribution, Dose Volume His- togram (DVH) and Dosimetric Results for the PTV and Critical Organs for Glioblastoma (GBM).
A Study on Usefulness of Clinical Application of Metal Artifact Reduction Algorithm in Radiotherapy
Department of Radiation Oncology, ASAN Medical Center, Seoul, Korea
Ja Ram Park, Min Su Kim, Jeong Mi Kim, Hyeon Suk Chung, Chung Hwan Lee, Geum Mun Back
Purpose: The tissue description and electron density indicated by the Computed Tomography(CT) number (also known as Hounsfield Unit) in radiotherapy are important in ensuring the accuracy of CT-based computerized radiotherapy planning. The internal metal implants, however, not only reduce the accuracy of CT number but also introduce uncertainty into tissue description, leading to development of many clinical algorithms for reducing metal artifacts. The purpose of this study was, therefore, to investigate the accuracy and the clinical applicability by analyzing date from SMART MAR (GE) used in our institution.
Methode: and material: For assessment of images, the original images were obtained after forming ROIs with identical volumes by using CIRS ED phantom and inserting rods of six tis- sues and then non-SMART MAR and SMART MAR images were obtained and compared in terms of CT number and SD value. For determination of the difference in dose by the changes in CT number due to metal artifacts, the original images were obtained by forming PTV at two sites of CIRS ED phantom CT images with Computerized Treatment Planning (CTP sys- tem), the identical treatment plans were established for non-SMART MAR and SMART MAR images by obtaining unilateral and bilateral titanium insertion images, and mean doses, Ho- mogeneity Index(HI), and Conformity Index(CI) for both PTVs were compared. The absorbed doses at both sites were measured by calculating the dose conversion constant (cCy/nC) from ylinder acrylic phantom, 0.125cc ionchamber, and electrometer and obtaining non-SMART MAR and SMART MAR images from images resulting from insertions of unilateral and bilat- eral titanium rods, and compared with point doses from CTP.
Result: The results of image assessment showed that the CT number of SMART MAR im- ages compared to those of non-SMART MAR images were more close to those of original images, and the SD decreased more in SMART compared to non-SMART ones. The results of dose determinations showed that the mean doses, HI and CI of non-SMART MAR images compared to those of SMART MAR images were more close to those of original images, however the differences did not reach statistical significance. The results of absorbed dose measurement showed that the difference between actual absorbed dose and point dose on CTP in absorbed dose were 2.69 and 3.63 % in non-SMRT MAR images, however decreased to 0.56 and 0.68 %, respectively in SMART MAR images.
Conclusion: The application of SMART MAR in CT images from patients with metal implants improved quality of images, being demonstrated by improvement in accuracy of CT number and decrease in SD, therefore it is considered that this method is useful in dose calculation and forming contour between tumor and normal tissues.
▶Key word: Metal artifact reduction, CT number accuracy, MAR