Printed in the Republic of Korea
http://dx.doi.org/10.5012/jkcs.2015.59.3.215
Synthetic, Characterization, Biological, Electrical and Catalytic Studies of Some Transition Metal Complexes of Unsymmetrical Quadridentate
Schiff Base Ligand
A. K. Maldhure, G. B. Pethe, A. R. Yaul, and A. S. Aswar*
Department of Chemistry, Sant Gadge Baba Amravati University, Amravati – 444602, India.
*E-mail: [email protected]
(Received March 13, 2015; Accepted April 23, 2015)
ABSTRACT. Unsymmetrical tetradentate Schiff base N-(2-hydroxy-5-methylacetophenone)-N'-(2-hydroxy acetophenone) ethylene diamine (H2L) and its complexes with Cr(III), Mn(II), Fe(III), Co(II), Ni(II) and Cu(II) have been synthesized and characterized by ele- mental analyses, magnetic susceptibility measurements, IR, electronic spectra and thermogravimetric analyses. 1H, 13C-NMR and FAB Mass spectra of ligand clearly indicate the presence of OH and azomethine groups. Elemental analyses of the complexes indi- cate that the metal to ligand ratio is 1:1 in all complexes. Infrared spectra of complexes indicate a dibasic quadridentate nature of the ligand and its coordination to metal ions through phenolic oxygen and azomethine nitrogen atoms. The thermal behav- ior of these complexes showed the loss of lattice water in the first step followed by decomposition of the ligand in subsequent steps. The thermal data have also been analyzed for the kinetic parameters by using Horowitz-Metzger method. The depen- dence of the electrical conductivity on the temperature has been studied over the temperature range 313−403 K and the complexes are found to show semiconducting behavior. XRD and SEM images of some representative complexes have been recorded. The antimi- crobial activity of the ligand and its complexes has been screened against various microorganisms and all of them were found to be active against the test organisms. The Fe(III) and Ni(II) complex have been tested for the catalytic oxidation of styrene.
Key words: Tetradentate schiff base, Catalytic oxidation, Electrical conductivity, Antimicrobial activity
INTRODUCTION
Tetradentate Schiff bases with N2O2 donor atoms are well known to coordinate with various metal ions and have attracted a great deal of interest in recent years due to their potential ligating ability, structural flexibility, spec- tral and chemical properties as well as magnetic proper- ties.1,2 Schiff bases and their metal complexes exhibit a broad range of potential applications because of their structural diversity and intrinsic magnetic properties and have shown to be potential antibacterial and anticancer agents.
Schiff base complexes are also important for designing metal complexes related to synthetic and natural oxygen car- riers.2 The complexes make these compounds effective and stereospecific catalysts for oxidation, reduction and hydrolysis and they show biological activity, and other transformations of organic and inorganic chemistry.3 It is well known that some drugs have higher activity when admin- istered as metal complexes than as free ligand.4 Numbers of transition metal complexes are known to activate molecular oxygen by reversible binding to the metal center.5 Such oxy- gen carrier metal complexes are of interest as catalysts for oxidation of organic compounds, and as models for oxy-
genase enzymes.6 Salen type ligand Schiff base metal com- plexes find widespread application as homogeneous and heterogeneous catalysis for epoxidation of styrene.7 Usu- ally, tetradentate, salen-type chelating ligands are sym- metrical and are, therefore, readily synthesized, whereas the preparation of unsymmetrical ligands is by no means trivial.8 However, the latter offer remarkable structural variation of the metal complexes derived there from, which may provide useful catalysts for the activation of molec- ular oxygen. Transition metal complexes with unsymmet- rical ligand, especially the N-(2-hydroxy-5-methylacetophenone) -N'-(2-hydroxyacetophenone) ethylenediamine ligand is not yet been explored. In view of importance associated with this class of compounds and in continuation of the work on transition metal complexes with Schiff bases, we report herein synthesis and characterization of Cr(III), Mn(II), Fe(III), Co(II), Ni(II ) and Cu(II ) complexes derived from unsymmetrical tetradentate Schiff base ligand.
EXPERIMENTAL
All the chemicals and solvents used were of analytical grade. NiCl2·4H2O, CoCl2·6H2O, MnCl2·4H2O, CuCl2·2H2O,
216 A. K. Maldhure, G. B. Pethe, A. R. Yaul, and A. S. Aswar
FeCl3 and CrCl3·6H2O were procured from SD’s fine chemi- cals and used as such. o-hydroxyacetophenone and eth- ylenediamine were purchased from Merck and used as supplied. 2-hydroxy-5-methylacetophenone was prepared according to the literature method.9
Physical Measurements
The microanalyses of carbon, hydrogen and nitrogen were performed on a Carlo Erba 1108 elemental analyzer at SAIF, Central Drug Research Institute (CDRI), Luc- know, India. The metal contents of the complexes were determined by standard methods10 after decomposing the organic matter with a mixture of HClO4, H2SO4 and HNO3
(1:1.5:2.5). The infrared spectra of ligand and its complexes were recorded on Perkin-Elmer spectrophotometer 597 as KBr pellets at SAIF, Panjab University, Chandigarh, India.
The 1H NMR and 13C NMR spectra of ligand were mea- sured in CDCl3 using TMS as internal standard on Bruker Auance-II 400 NMR spectrometer at SAIF, Panjab University, Chandigarh, India. Mass spectrum of ligand recorded on Mass Spectrometer Jeol SX-102(FAB) at CDRI, Lucknow, India. Magnetic susceptibilities were determined on a Gouy balance at room temperature using Hg [Co (SCN) 4]as cal- ibrant; diamagnetic corrections were calculated from Pas- cal’s constants. TG graph of the complexes were recorded on a Metzsch STA 409 thermal analyzer in the temperature range 40−700oC with a heating rate of 20oC/min. The electrical conductivity of compounds was measured in pellet form using Zentech resistivity meter. Diffuse reflectance spectra of the solid complexes suitably diluted with magnesium oxide were recorded on a Varien Cary 5E UV-NIR spectrophotometer at SAIF, IIT, Chennai, India. SEM images and XRD measure- ments of complexes were recorded at VNIT, Nagpur, India.
Synthesis of N-(2-hydroxy-5-methylacetophenone) -N'- (2-hydroxyacetophenone) ethylenediamine (H2L)
Equimolar solutions of 2-hydroxy-5-methylacetophe- none (3.0 g, 2 mmol) and o-hydroxyacetophenone (2.732 g, 2 mmol) were prepared in ethanol and kept for 30 min in an ice bath. To this an ethanolic solution was added eth- ylenediamine (1.2 g, 2 mmol) drop wise with continuous stirring. The resulting a yellow colored compound (Scheme 1) was filtered washed with ethanol and crystallized from ethanol and then dried in vacuo. The column chromatog- raphy was used to separate unsymmetrical Schiff base ligand from synthesize ligand compound. The separation of unsym- metrical Schiff base was monitored by TLC and its purity was checked by melting point determination and elemen- tal analyses. Yield = 70%. Anal. Calc. for C19H22O2N2: C,
73.52; H, 7.14; N, 9.03. Found: C, 73.52; H, 7.59; N, 8.89%.
m.p. 160oC. UV/Vis 325 nm (n→π*), 257 nm (π→π*). IR (KBr) 3035 cm−1 (Ar-OH), 1611 cm−1 (C=N) 1292 cm−1 (C− O), 828 cm−1 (Two adjacent hydrogen atoms in aromatic ring), 758 cm−1 (four adjacent hydrogen atoms in aromatic ring),
1H NMR (CDCl3) δ 2.30 (s, 3H, Ar-CH3), 2.35 (s, 6H, C- CH3), 3.94 (s, 4H, N-CH2), 6.76 (dt, 1H, ArH), 6.8 (d, 1H, ArH), 6.9 (dd, 1H, ArH), 7.09 (dd, 1H, ArH), 7.26 (dd, 1H, ArH), 7.29 (d, 1H, ArH), 7.5 (dt, 1H, ArH), 15.6 (s, 1H, Ar-OH), 16.0 (s, 1H, Ar-OH), 13CNMR (CDCl3) 14.70 (C8, C17), 20.66 (C9), 50.16 (C18, C19), 117.35 (C5), 118.08 (C14), 118.45 (C12), 119.12 (C1), 119.45 (C4), 126.25 (C10), 128.13 (C2), 132.43 (C11), 133.24 (C13), 160.68 (C3), 163.15 and 163.22 (C6 and C15), 172.51 and 172.68 (C7 and C16).
FAB-MS m/z 311 (MH+) [C19 H23 O2 N2] + (Fig. 1).
Preparation of Metal Complexes
A general method was used for the synthesis of the metal complexes. Equimolar quantities (2 mmol) of the metal salts and ligand were dissolved separately in minimum quantity of hot DMF (25 mL) and both solutions were fil- tered and then mixed in a hot condition .The reaction mix- ture was heated under reflux on sand bath for about 1 h.
The pH of the reaction mixture was adjusted to 7.5 using alcoholic solution of ammonia solution and the solution was further heated under reflux for three more hours. The resulting colored product so obtained on cooling was fil- tered, washed well with DMF and hot ethanol and dried over anhydrous calcium chloride in a desiccator.
Antibacterial and Antifungal Study
The ligand and its metal complexes were screened for in vitro antibacterial activity in DMSO against the bacterial strains Staphylococcus aureus, Bacillus Subtilis, Salmonella typhimurium and Escherichia coli using nutrient agar medium Scheme 1. H2L Ligand.
Scheme 2. Metal complexes.
1h
L + M → [M(L)XY]
M/X/Y: Co(II)/--/(H2O)2, Mn(II)/--/(H2O)2,
Cu(II)/--/(H2O)2, Fe(III)/Cl/H2O, Cr(III)/Cl/H2O
by the disc diffusion method. Solutions of 100, 200 and 300 ppm of the compounds in DMSO were used for the studies. These discs were placed on the already seeded plates and incubated at 35oC for 24 h. The diameter (mm) of the inhibition zone around each disc was measured after 24 h.
The antifungal activity was evaluated by the same disc diffusion method using potato dextrose agar medium con- taining starch 20 g, Dextrose 20 g and agar-agar powder 15 g dissolved in 1000 mL distilled water. The organisms used were Aspergillus oryzae and Fusarium species. The fungicidal activity of the compounds was recorded after 7 days.
Catalytic Oxidation Study
Catalytic oxidation of styrene to corresponding epoxide by [NiL] and [FeLCl(H2O)] was tested in presence of an aqueous solution of 30% H2O2 as an oxidant. These catalytic reactions were carried out in 50 mL reaction flask fitted with water condenser. A general procedure was followed for all reactions. In a typical experiment, styrene (5.2 g, 30 mmol) and 30% H2O2 (1.7 g, 30 mmol) were mixed in 1:1 proportion in 5 mL of acetonitrile and the reaction mixture was heated at 60oC with continuous stirring. An appropriate catalyst to be tested (0.3 g, 3 mmol) was added to the reaction mixture and heated at 60oC under constant stirring for 4 h. After the completion of reaction, an organic layer was separated by separating funnel and analyzed using 19091Z-413E Agilent Gas Chromatography with HP-1 column having length 30 m and inner diameter 0.32 mm and FID detector.
RESULTS AND DISCUSSION
The condensation of 2-hydroxy-5-methylacetophenone, o-hydroxyacetophenone and ethylenediamine in absolute ethanol yields a new Schiff base N-(2-hydroxy-5-methy- lacetophenone)-N'-(2-hydroxyacetophenone) ethylenedi- amine, (H2L), which was used to prepare the transition metal complexes whose analytical data presented in Table 1. All the complexes are colored powders with high melting points.
The complexes are non-hygroscopic and are stable in air, insoluble in methanol, ethanol, chloroform and acetone but partially soluble in DMF and DMSO. The analytical data suggest a ratio of 1:1 (metal:ligand) for all the complexes.
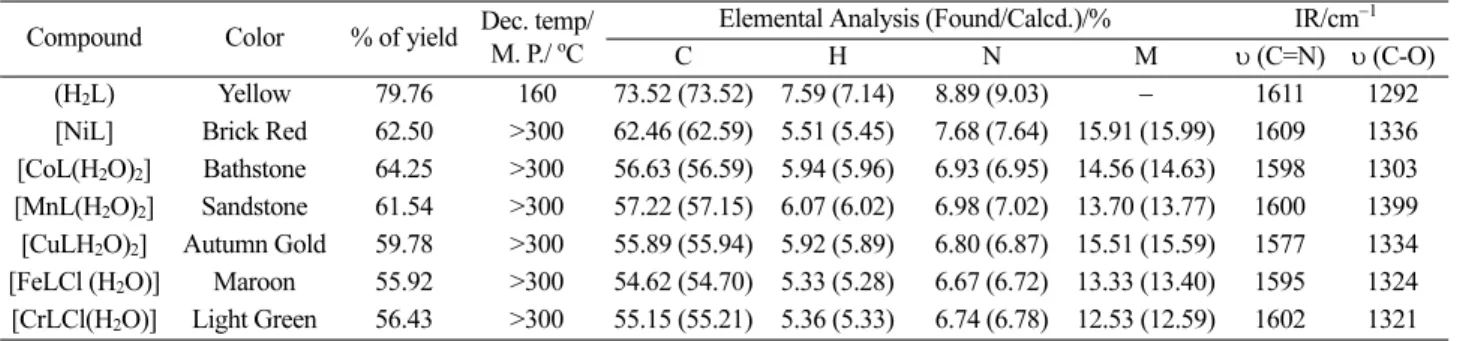
Elemental analysis data, colours, percentage yields, melting points, magnetic moment and IR bands are given in Table 1.
The elemental analytical data are consistent with the pro- posed formula.
Infrared Spectra
The IR spectrum of the ligand and its complexes are listed in Table 2. The IR spectra of complexes are compared with those of the free ligand in order to determine the coordination sites that may involved in coordination. The ligand exhibits a medium intense band at 3035 cm−1, due to intramolecular hydrogen bonded υ(O-H).11,12 The absence of this band in the spectra of all complexes indicates the deprotonation of the phenolic groups and coordination of the oxygen atom to the metal ion. This is further supported by an upward shift of υ(C-O) band at 1292 cm−1 13 to the extent of 1303−1399 cm−1 in the spectra of complexes, indicating Figure 1. Mass spectra of Ligand H2L.
218 A. K. Maldhure, G. B. Pethe, A. R. Yaul, and A. S. Aswar
the coordination of phenolic oxygen atom to the metal ion.14 This shift to higher energy is expected due to maintenance of ring currents arising from electron delocalization in the che- late ring. The ligand shows the υ(C=N) stretching band at 1611 cm−1 due to azomethine group. It is expected that coordination of the nitrogen to the metal atom would reduce the electron density in the azomethine link and thus lower the azomethine absorption. In the IR spectra of complexes, this band is shifted to lower region 1609−1577 cm−1 indicating the coordination of the Schiff base through the azomethine nitro- gen atom.15 The aromatic ring of different kind present in the unsymmetrical Schiff base is supported by peaks observed in the region 828−758 cm−1. The appearance of non ligand bands in the spectra of complexes are in the regions 535−600 and 449−521 cm−1 which may be assigned to υM-O and υM-N frequencies respectively. In the spectra of all complexes except Ni (II), the bands observed at 3300−3450 cm−1 may be attributed to the vibration of water molecules coordi- nated to the metal ions. The complexes exhibit absorption bands at 860 and 730 cm−1 which are ascribed to rocking and wagging vibration of coordinated water suggesting a six coor- dinate structure for the complexes.
Electronic Spectra
The ligand shows a broad band centered at 325 nm due to n→π* transition of azomethine group. Another band around 257 nm which may be arise for transition involv- ing mainly the π molecular orbital localized on the C=N group and/or the aromatic ring.16−18 The reflectance spec- trum of Ni(II) complex shows a strong bands at 12820, 19231 and 27778 cm−1 corresponding to its square planar geom- etry. The observed bands may be assigned to 1A1g→3A2g,
1A1g→1A2g and 1A1g→1B1g, transitions, respectively9 The diamagnetic behaviour of the complex confirms the square planar geometry. The Co(II) complex exhibits a magnetic moment 4.78 B.M. which is in agreement for Co(II) in an octahedral environment. The Co(II) complex exhibits three bands at 9616, 15674, and 20000 cm−1, corresponding to
4T1g(F)→4T2g(F), 4T1g(F)→4A2g(F), and 4T1g(F)→4T1g(P), transitions, respectively, for an octahedral environment around the metal ion.19 The electronic spectral parameters have been calculated using the known equation20 and the values are found to be Dq = 1733.89 cm−1, B = 970.79 cm−1, β = 0.867, βo = 13.32. The reduction of the Racah parameter (B) from the free ion value of 1120 cm-1 and the βo indi- Table 1. Analytical and spectral data of ligand and its complexes
Compound Color % of yield Dec. temp/
M. P./ oC
Elemental Analysis (Found/Calcd.)/% IR/cm−1
C H N M υ (C=N) υ (C-O)
(H2L) Yellow 79.76 160 73.52 (73.52) 7.59 (7.14) 8.89 (9.03) − 1611 1292
[NiL] Brick Red 62.50 >300 62.46 (62.59) 5.51 (5.45) 7.68 (7.64) 15.91 (15.99) 1609 1336 [CoL(H2O)2] Bathstone 64.25 >300 56.63 (56.59) 5.94 (5.96) 6.93 (6.95) 14.56 (14.63) 1598 1303 [MnL(H2O)2] Sandstone 61.54 >300 57.22 (57.15) 6.07 (6.02) 6.98 (7.02) 13.70 (13.77) 1600 1399 [CuLH2O)2] Autumn Gold 59.78 >300 55.89 (55.94) 5.92 (5.89) 6.80 (6.87) 15.51 (15.59) 1577 1334 [FeLCl (H2O)] Maroon 55.92 >300 54.62 (54.70) 5.33 (5.28) 6.67 (6.72) 13.33 (13.40) 1595 1324 [CrLCl(H2O)] Light Green 56.43 >300 55.15 (55.21) 5.36 (5.33) 6.74 (6.78) 12.53 (12.59) 1602 1321
Table 2. Magnetic, electrical conductivity and thermal decomposition data of complexes Complex μeff/B.M. Electrical Conductivity/
Ω−1cm−1
Half Decomposition Temp/oC.
Activation Energy Ea/KJmol−1
Frequency Factor Z/sec−1
Entropy Change
−∆S/JmolK−1 [NiL] Diamagnetic 1.08 × 10⁻⁶
3.35 × 10⁻⁴ 409. 22.30 50.65 219.20
[CoL(H2O)2 ] 4.78 2.59 × 10⁻¹¹
1.05 × 10⁻⁹ 340 15.39 74.09 215.15
[MnL(H2O)2] 5.76 3.95 × 10⁻⁸
7.23 × 10⁻⁷ 336 13.51 42.98 219.63
[CuL(H2O)2] 2.14 1.85 × 10⁻⁶
9.76 × 10⁻⁵ 293 22.29 21.92 224.61
[FeLCl (H2O)] 5.52 1.09 × 10⁻⁷
4.62 × 10⁻⁶ 328 13.84 46.10 218.92
[CrLCl(H2O)] 4.01 2.33 × 10⁻⁸
1.6 × 10⁻⁶ 413 26.88 24.65 225.23
cates the presence of strong covalence in the M-L bond.20 The reflectance spectrum of Mn(II) complex exhibits three weak bands at 15873, 22727 and 27778 cm−1 expected for Mn(II) octahedral structure. These bands may be assigned to the transitions 6A1g→4T1g(4G), 6A1g→4T2g, 4A1g(4G) and
6A1g→4E2g(4D), respectively, towards octahedral geome- try for complex.21 The Mn(II) complex exhibits magnetic moment 5.76 B.M. consistent with octahedral stereochemis- try. The Cu(II) complex shows a single broad band in the region 12800−15700 cm−1, centered at 14890 cm−1 which may be due to the overlapping of the three transitions 2B1g
→2A1g, 2B1g→2B2g and 2B1g→2Eg, transitions expected for a distorted octahedral structure.22 The magnetic moment of the Cu(II) complex is 2.14 B.M. The excess of mag- netic moment above the spin only value (1.73 B.M.) might be due to the orbital contribution. The reflectance spectrum of the Fe(III) complex displays three bands at 13889, 18868 and 28571 cm−1 which may be assigned to 6A1g→4T1g (G),
6A1g→4T2g(G) and 6A1g→4A1g(G), transitions, respectively indicating that the complex possesses a high-spin, octahedral configuration.9 The Fe(III) complex has magnetic moment 5.52 B.M. indicating high-spin state of Fe(III) complex.
The electronic spectrum of Cr(III) complex exhibits three bands at 11848, 15974 and 26737 cm-1 due to 4A2g→4T2g(F),
4A2g→4T1g(F) and 4A2g→4T1g(P), transitions, respectively, for an octahedral stereochemistry.23 The observed magnetic moment value for the Cr(III) complex is found to be 4.01B.M.
in accordance with the spin only value for three unpaired electrons corresponding to high-spin octahedral Cr(III) complexes. The electronic spectral parameters24 have been found to be Dq = 1184.8 cm−1, B = 477.7 cm−1, β = 0.697, βo = 30.26.
Thermogravimetric Analysis
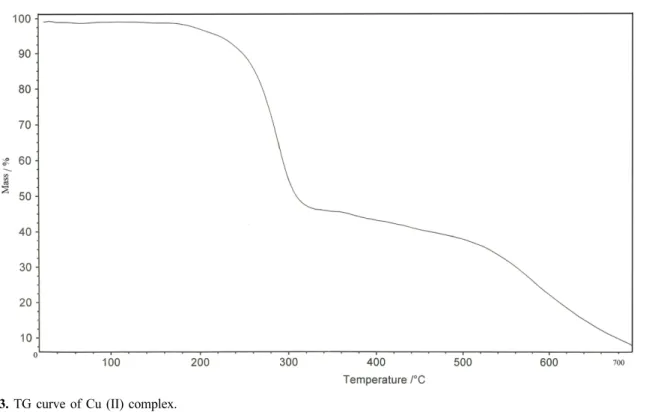
Thermal decomposition studies of complexes have been carried out as to corroborate the information obtained from the IR spectral studies about the status of water mole- cules present in some of these complexes as well as to know their thermal stability and decomposition pattern. The TG decomposition curves of H2L and its representative Cu(II) complex are shown in Figs. 2 and 3 The mass losses for ligand H2L and its representative Cu(II) complex were calculated for the corresponding temperature ranges and data are given in Table 3. The TG curve of ligand shows two step decomposition patterns. The TG curve of H2L shows mass loss in the temperature range 30−330oC, which cor- responds to the loss of C10H12NO part of ligand (obs. = 51.54%; calcd. = 52.25%). In the second decomposition step within the temperature range 330−650oC shows mass loss of 46.17% (calcd. = 47.72%) which is reasonably accounted to remaining part of ligand (C9H10NO). The TG curve of [Cu L (H2O)2] complex shows mass loss in the tempera- ture range 60−180oC, which corresponds to the evolution of two molecules of coordinated water (obs. = 9.14%; calcd.
Figure 2. TG curve of ligand H2L.
220 A. K. Maldhure, G. B. Pethe, A. R. Yaul, and A. S. Aswar
= 8.82%). In the second decomposition step occurs within the temperature range 180−300oC show mass loss of 10.50%
which is reasonably accounted by the removal of C3H9
moiety of complex. The remaining moiety C16H11N2O2 of complex is removed in the temperature range 300−690oC as the third step (obs. = 64.74%; calcd. = 65.69%). The decom- position of the complex ended with formation of metal oxide in final step at 700oC. In the case of the Co(II), Mn(II) and Cu(II) complexes elimination of two water molecules take place in the temperature range 140−180oC indicating the presence of these water molecules as coordinated once, while the Fe(III) and Cr(III) complexes loss one coordinated water molecule in this temperature range. The Ni(II) complex shows negligible mass loss up to ~300oC indicating the absence of any water molecules in this complex. The anhy- drous complexes remain stable for a short while and there after the complexes show continues mass loss presumably due to decomposition of organic constituents of the complex molecule leading to the formation of the respective metal
oxides.25 The metal contents were calculated from the res- idue and were found to be in good agreement with the results of elemental analysis. The TG curve reveals that ligand (H2L) decomposes in 2 steps. The TG curve of ligand shows two peak, first endothermic peak at about 306oC and second endothermic peak at 578oC. The thermal decomposition of Ni(II) complex takes place in the temperature range of 320−640oC and for this step of decomposition, the TG curves shows endothermic peak at 343oC. In the second stage of pyrolysis, another peak at 436oC in the TG curve indicates that this degradation stage is endothermic in nature.
The TG curve of Cu(II) complex shows two endothermas at 294oC and 329oC and one exotherm at 245oC. The ther- mal stability of metal complexes was found to increase periodically with increase in atomic number of the metal and large value of charge/radius ratio.26
The kinetic and thermodynamic parameters for decom- position of metal complexes have been determined by the Horowitz-Metzger method27 and values obtained are given Figure 3. TG curve of Cu (II) complex.
Table 3. Thermal decomposition data of H2L and Cu(II) complex
Compound TG Range / oC Mass loss / % Obs. / Calcd. Assignment H2L 030−330 oC 51.54 / 52.25 Loss of (C10H12NO)
330−650 oC 46.17 / 47.72 Loss of (C9H10NO)
[Cu L (H2O)2] 060−180 oC 9.14 / 8.82 Loss of two mole of coordinated water molecules 180−300 oC 10.50 / 11.03 Removal of (C3H9) part of ligand
300−690 oC 64.74 / 65.69 Removal of (C16H11N2O2) part of ligand
in Table 2. The calculated energy of activation (Ea) is rel- atively low indicating the autocatalytic effect of metal ion on thermal decomposition of the metal complexes. Neg- ative ΔS values indicate more ordered activated states that may be possible through chemisorptions of oxygen and other decomposition products. The more ordered nature may be due to the polarization of bonds in activated state which might happen through charge transfer electronic transitions.
Electrical Conductivity
The DC electrical conductivity of the ligand and its com- plexes has been studied in the temperature range 313 K<
T<403 K using the two probe technique and values are given in Table 2. The values of the electrical conductivity of the complexes were found in the range of 10−11 to 10−4 Ω−1 cm−1 and their conductivity increases with increase in temperature and decreases upon cooling over the studied temperature range indicating their semiconducting behav- ior.28 The activation energy-temperature dependence fol- lows the Arrhenius relation σ = σ0 exp (−Ea/ kT), where σ0, Ea and k are conductivity constants,, the activation energy and the Boltzman constant, respectively. The plots of log σ vs. 1000/T (Fig. 4) for all the compounds are found to be linear over the entire temperature range. The activation energy of the compounds lies in the range 0.43−0.75 eV.
Scanning Electron Micrographs
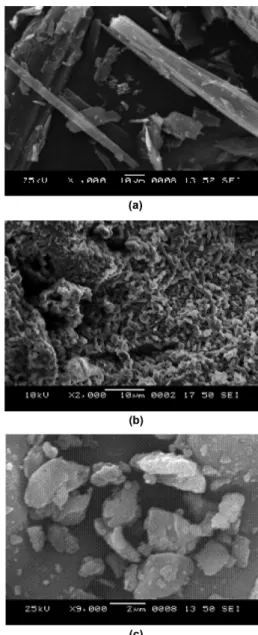
The morphology and particle size of the unsymmetrical Schiff base metal complexes have been illustrated by SEM.
Fig. 6a-c depict the SEM photograph of the synthesized Ni(II), Co(II) and Fe(III) complexes. The Scanning electron micrography (SEM) of metal complexes indicates the presence of well-defined crystals free from any shadow of the metal ion on their external surface. There is a uniform matrix of the synthesized complexes in the pictograph,
which leads to dealing with homogeneous phase material.
A single phase formation of Ni(II) complex having fiber morphologies in the form of a bundle with particle size 4-6 µm29 and ~12 µm pore size is displayed in Fig. 5a. Co(II) complex is granular shaped morphology with 2−3.5 µm particle size and ~4 µm pore size (Fig. 5b). However Fe(III) complex is rock like shape morphology with 1.3−2.5 µm particle size and ~3 µm pore size (Fig. 5c).
X-ray Diffractogram
The powder X-ray diffraction spectrum of the Ni(II) com- plex is shown in Fig. 6. The presence of sharp reflections in XRD pattern indicates the formation of single-phase com- Figure 5. Scanning electron micrograph of complexes.
Figure 4. DC electrical conductivity vs. 1000/T.
222 A. K. Maldhure, G. B. Pethe, A. R. Yaul, and A. S. Aswar
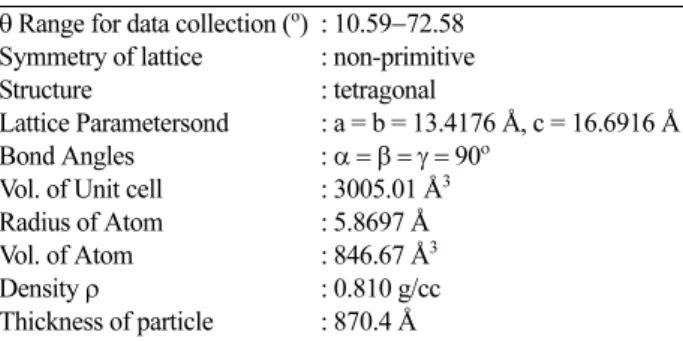
pound. The XRD pattern shows ten reflections between 2θ range from 10.59−72.58o with maxima at 2θ = 10.59o corresponding to the value of d = 8.3458Å. All main peaks have been indexed by using appropriate methodology and use of computer program (PowdMult, Version 2.3). The indexing is confirmed on the basis of correction obtained between observed and calculated d and θ values based on characteristics of symmetry consideration.30 The method also yielded hkl (miller indices) values. The 2θ values and relative intensities corresponding to the prominent peak have been listed in Table 4. Assuming the Ni(II) complex as a tetragonal system, the unit cell lattice parameter are found to be a = b = 13.4176Å and c = 16.6916Å respectively, while the cell volume was 3005.01Å3. The particle size of the sample was calculated by using Scherrer formula t = 0.9λ/βcosθ. The other parameters such as particle size, radius of atom were calculated. All these values are tabulated in Table 5.
Antimicrobial Screening
The Schiff base and its metal complexes were evaluated for antimicrobial activity against two strain Gram +ve bac- teria (Staphalococcus aureus, Bacillus subtilis), Gram –ve bacteria (Salmonella typhimurium, Escherichia coli) and fungus (Aspergillus oryzae, Fusarium species). The anti- microbial screening results are given in Table 6. These observations show that the majority of the complexes are more active than their free ligand.31 Chelation may enhance or suppress the biochemical potential of bioactive organic species. The antibacterial screening shows that compounds [NiL] and [CoL(H2O)2] exhibit the most activity.32 The fungicidal screening shows that compounds [CuL(H2O)2]
and [FeLCl(H2O)] are most effective against Fusarium species.
Catalytic activity of Complexes
The catalytic oxidation of organic substrates by transi- Figure 6. X-ray diffractogram of Ni (II) complex.
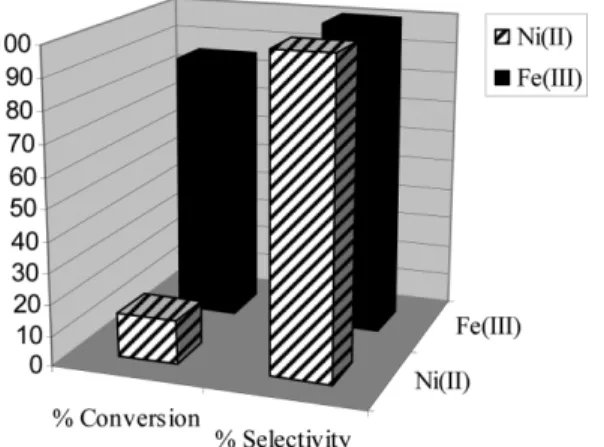
tion metal complexes is an area of current interest, in view of this in the present paper the catalytic activity of Ni(II) and Fe(III) complexes for epoxidation of styrene to corre- sponding styrene oxide were carried out using H2O2 as an oxidant. These oxidation reaction yielded styrene oxide as a major product with minor amount of phenyl acetaldehyde as side product (Fig. 7).7 Epoxidation of styrene resulted 13.98 and 85.22% conversion and 100% Selectivity for both Ni(II) and Fe(III) complexes, respectively of styrene into styrene oxide (Fig. 8). No significant side products were identified.
CONCLUSIONS
Based on the physicochemical and spectral data dis- cussed above square planer structure for Ni(II) complexes whereas octahedral geometry for Co(II), Mn(II), Cu(II), Cr(III) Table 4. The observed and calculated X-ray diffraction data of Ni(II) complex
Peak no. d (obs) d (calcd) I/I0 2θ (obs) 2θ (calcd) ∆ 2θ Indices h k l
1 8.3458 8.3458 100 10.59 10.59 0.000 0 0 2
2 6.2664 6.2664 4083 14.12 14.12 0.000 1 1 2
3 5.2026 5.2288 4.16 17.03 16.94 0.086 2 0 2
4 4.4644 4.4725 10.65 19.87 19.83 0.036 3 0 0
5 3.5452 3.5434 9.8 25.10 25.11 −0.013 2 0 4
6 3.3615 3.3544 4.74 26.49 26.55 −0.058 4 0 0
7 3.2294 3.2396 2.7 27.60 27.51 0.088 1 0 5
8 3.1706 3.1625 2.81 28.12 28.19 −0.073 3 3 0
9 2.6702 2.6695 1.13 33.53 33.54 −0.009 1 1 6
10 1.3015 1.3011 2.56 72.58 72.61 −0.03 7 4 8
Table 5. X-ray parameters of Ni(II) complex θ Range for data collection (o)
Symmetry of lattice Structure
Lattice Parametersond Bond Angles Vol. of Unit cell Radius of Atom Vol. of Atom Density ρ
Thickness of particle
: 10.59−72.58 : non-primitive : tetragonal
: a = b = 13.4176 Å, c = 16.6916 Å : α = β = γ = 90ο
: 3005.01 Å3 : 5.8697 Å : 846.67 Å3 : 0.810 g/cc : 870.4 Å
Figure 7. Oxidation of styrene.
Table 6. Antimicrobial activities of ligand and its complexes Compound
Diameter of inhibition zone/mm Concentration/ppm
Antibacterial Screening Data Antifungal Screening Data Staphalococcus aureus Bacillus Subtilis Salmonella typhimurium Escherichia coli Aspergillus oryzae Fusarium species
100 200 300 100 200 300 100 200 300 100 200 300 100 200 300 100 200 300
H2L 8 9 7 6 8 9 6 6 8 6 10 11 − − − − − 6
[NiL] 6 6 − 6 − 7 − 6 8 8 − − − 8 − 7 − −
[CoL(H2O)2 ] − 12 15 6 6 9 − 6 8 8 10 14 − − 8 7 − −
[MnL(H2O)2] − 9 7 − − 6 − 6 7 − 7 8 − 7 6 − − −
[CuL(H2O)2] 6 6 9 − − − − 6 8 − 6 10 − − 7 7 6 7
[FeLCl (H2O)] 12 10 8 − − 6 8 6 6 − 8 10 − − − 6 8 8
[CrLCl(H2O)] − 6 6 − 6 8 7 − − − 7 8 − − − 6 − −
224 A. K. Maldhure, G. B. Pethe, A. R. Yaul, and A. S. Aswar
and Fe(III) complexes are proposed. It is assumed that the ligand behaves as dibasic ONNO tetradentate, coordinat- ing via phenolic oxygen and azomethine nitrogen atoms.
Thermal study revealed that complexes are thermally sta- ble. The solid - state electrical conductivity of complexes increases with increase in temperature and suggested semi- conducting behavior. An XRD study suggested the triclinic crystal system. The Catalytic conversions of styrene sug- gest that it increases with increase in amount of catalyst in presence of fixed amount of H2O2 and styrene. The com- plexes are biologically active and showed enhanced anti- microbial activities compared to the free ligand. SEM images of the Ni(II), Co(II) and Fe(III) complexes shows the pres- ence of well-defined crystals.
Acknowledgments. Publication cost of this paper was supported by the Korean Chemical Society.
REFERENCES
1. Hunoor, R. S.; Patil, B. R.; Badiger, D. S.; Vadavi, R. S.;
Gudasi, K. B.; Chandrashekhar, V. M.; Muchchandi, I. S.
Spectrochim Acta Part A. 2010, 77, 838.
2. Qingbao, S.; Xiaoli, W.; Yongmin, L.; Yongxiang, M. A.
Polyhedron. 1994, 13, 2395.
3. Samnani, P. B.; Bhattacharya, P. K.; Ganeshpure, P. A.;
Koshy, V. J.; Satish, S. J. Mol.Catatalysis A: Chemical.
1996, 110, 89.
4. Bermejo, M. R.; Gonzalez, A. M.; Fondo, M.; Garcia- Deibe, A. M.; Sanmartin, J.; Hoyos, O. L.; Watkinson, M.
New. J. Chem. 2000, 24, 235.
5. Maravel, V.; Ancel, J. E.; Meunier, B. J. Catal. 2002, 206, 349.
6. Ganeshpure, P. A.; Sudalai, A.; Satish, S. Tetrahedron Letter.
1989, 30, 5929.
7. Maurya, M. R.; Kumar, U.; Correia, I.; Adao, P.; Pessoa, J. C. Eur. J. Inorg. Chem. 2008, 4, 577.
8. Imanzadeh, G. H.; Eskandari, H. Ind. J. Chem. 2005, 44A, 1392.
9. Badwaik, V. B.; Aswar, A. S. Russ. J. Inorg. 2009, 54, 1611.
10. Mendham, J.; Denney, R. C.; Barnes, J. D.; Thomas, M.
J. K. Vogel’s Text. Quant. Anal., 6th Edn; Pearson Education:
Singapore, 2004.
11. Sarkar, A. R.; Mandal, S. Synth React Inorg Met-Org Chem.
2000, 30, 1477.
12. Singh, R. V.; Joshi, S. C.; Dwivedi, R. Phosphorus Sulfur Silicon Relat Elem. 2004, 179, 227.
13. Gupta, K. C.; Sutar, A. K. J Mole Catal A: Chem. 2007, 272, 64.
14. Maurya, M. R.; Khurana, S.; Schulzke, C.; Rehder, D.
Eur. J. Inorg. Chem. 2001, 3, 779.
15. Aurel, P.; Doina, H.; Lonel, H.; Catalin, T. Rev Roumaine de Chime. 2008, 53, 177.
16. Boghaei, D. M.; Mohebi, S. Tetrahedron. 2002, 58, 5357.
17. Baleizao, C.; Gigante, B.; Garcia, H.; Corma, A. J. Catal.
2004, 221, 77.
18. Gullotti, M.; Pasini, A.; Fantucci, P.; Ugo, R.; Gillard, R.
D. Gazz Chim Ital. 1972, 102, 855.
19. Joseph, A.; Joseph, B.; Narayana, B. J. Ind. Chem. Soc.
2008, 85, 479.
20. Koning, E. The Nephelauxetic Effect in Structure and Bond- ing, Springer, Verlag: New York. 1971; Vol. 9, p 175.
21. Chandra, S.; Verma, S.; Meera, P. J. Ind. Chem. Soc. 2008, 85, 896.
22. Patel, M. N.; Patel, J. R.; Sutaria, D. H. Synth React Inorg.
Met-Org Chem. 1995, 25, 797.
23. Dubey, R. K.; Dubey, U. K.; Mishra, C. M. Ind. J. Chem.
2008, 47A, 1208.
24. Lee, J. D. Blackwell Sci. Ltd., 5th edn. Oxford. 2004, p. 963.
25. Verma, R. K.; Verma, L.; Chandra, M. Ind. J. Chem. 2003, 42A, 2982.
26. Chaudhary, R. G.; Juneja, H. D.; Gharpure, M. P. J. Therm.
Anal. Calorim. 2013, 112, 637.
27. Horowitz, H. H.; Metzger, M. Anal. Chem. 1963, 35, 1464.
28. Bansod, A. D.; Mahale, R. G.; Aswar, A. S. Rus. J. Inorg.
Chem. 2007, 52, 879.
29. Neelakantan, M. A.; Marriappan, S. S.; Dharmaraja, J.;
Jeyakumar, T.; Muthukumaran, K. Spectrochimica Acta. 2008, A71, 628.
30. Sarkar, S.; Aydogdu, Y.; Dagdelen, F.; Bhaumik, B. B.;
Dey, K. Material. Chem. Phys. 2004, 88, 357.
31. Bolos, C. A.; Nikolov, G. S.; Ekateriniadou, L.; Kortsaris, A.; Kyriakidis, D. A. Metal-Base Drugs. 1998, 5, 323.
32. Hamurcu, F.; Gunduzalp, A. B.; Cete, S.; Erk, B. Trans Met.
Chem. 2008, 33, 137.
Figure 8. Catalytic study of complexes.