INTRODUCTION
Thrombocytopenia is a common hematological abnor- mality that is sometimes associated with severe bleeding [1]. There are many causes for thrombocytopenia, which makes the differential diagnosis of the underlying causes of thrombocytopenia difficult and troublesome. Throm- bocytopenia can be caused by enhanced peripheral destruc-
tion of platelets as in idiopathic thrombocytopenic pur- pura/immune thrombocytopenia (ITP) or thrombotic thrombocytopenic purpura. ITP is an acquired immune- mediated disease in adults and children characterized by a transient or persistent decrease in the platelet count [2]. According to the American Society of Hematology (1996), the diagnosis of ITP can be made on the basis of a thorough history and physical examination and a com- plete blood cell count, including the examination of a peripheral blood smear [3]. A number of studies support the idea that it is not necessary to routinely perform bone marrow examination for the diagnosis of ITP [4].
Another cause of thrombocytopenia is a decreased production of platelets in the bone marrow as in aplastic anemia (AA) and post-chemotherapy. An accurate platelet
451 451
Immature Platelet Fraction: Establishment of a Reference Interval and Diagnostic Measure for Thrombocytopenia
Haiyoung Jung, M.D., Hee-Kyung Jeon, M.T., Hee-Jin Kim, M.D., and Sun-Hee Kim, M.D.
Department of Laboratory Medicine & Genetics, Samsung Medical Center, Sungkyunkwan University School of Medicine, Seoul, Korea
451 451
Background: Immature platelet fraction (IPF, %) is a measure of reticulated platelets (RPs), which represents the state of thrombopoiesis. The IPF is obtained from an automated hematology analyz- er as one of the platelet parameters. This study was performed to establish reference intervals of IPF and its cut-off values for the differential diagnosis of thrombocytopenia.
Methods: Blood samples from 2,039 healthy individuals (1,161 males, 878 females) were obtained to establish reference intervals. The patient group included patients with idiopathic thrombocytopenic purpura (ITP) (N=150) and aplastic anemia (AA) (N=51) with platelet counts of less than 100×109/L.
We evaluated the reliability of the IPF measurements, the reference intervals, and cut-off value for the diagnosis of ITP.
Results: The reference intervals of IPF were 0.5-3.2% in males and 0.4-3.0% in females (95% confi- dence interval). The median IPF% of ITP and AA were 7.7% (range, 1.0-33.8%) and 3.5% (range, 0.6-12.9%), respectively. Statistical analysis revealed a significant difference between the IPF% of ITP and AA (P<0.0001). The cut-off value of IPF for differentiating ITP from AA was 7.3% with a sen- sitivity and specificity of 54.0% and 92.2%, respectively.
Conclusions: A rapid and inexpensive automated measurement of IPF can be integrated as a stan- dard parameter to evaluate the thrombopoietic state of the bone marrow. This study determined the reference intervals of IPF from a large population of healthy individuals, including children. Further studies are needed to establish the clinical utility of IPF. (Korean J Lab Med 2010;30:451-9)
Key Words : Aplastic anemia, Immature platelet fraction, Immune thrombocytopenia, Reference interval, Sysmex XE-2100
Received :December 14, 2009 Manuscript No :KJLM09-141 Revision received :July 23, 2010
Accepted :August 12, 2010
Corresponding author :Hee-Jin Kim, M.D.
Department of Laboratory Medicine & Genetics, Samsung Medical Center, Sungkyunkwan University School of Medicine, 50 Irwon-dong, Gangnam-gu, Seoul 135-710, Korea
Tel : +82-2-3410-2702, Fax : +82-2-3410-2719 E-mail : [email protected]
ISSN 1598-6535 The Korean Society for Laboratory Medicine
count provides only limited information on the likeli- hood of bleeding in the thrombocytopenic patient [5]. A rapid assessment of platelet production would distinguish between thrombocytopenia due to bone marrow failure, where bleeding is more likely to occur, and thrombocy- topenia due to increased peripheral platelet destruction, where bleeding is less common [6].
During the last 2 decades, automated blood cell coun- ters have undergone a remarkable technological evolu- tion owing to the introduction of new physical principles for cellular analysis and better software. This has result- ed in an improvement in the analytic efficiency and an increase in the information obtained, which, however, require even more specialized knowledge to best discern the possible clinical applications. Further considerations are necessary regarding the possible clinical use of new analytic parameters that are available only with auto- mated analyzers; however, these parameters have not yet been utilized to their full potential, as has the imma- ture platelet fraction (IPF) [7].
Reticulated platelets (RPs) are newly formed platelets with higher granule content and a residual amount of megakaryocyte-derived mRNA [8]. The number of RPs is related to thrombopoiesis, which increases with increased production of RPs and decreases when RP production declines [7]. The existence of this relationship offers the possibility to determine whether thrombocytopenia is due to bone marrow failure or increased peripheral destruc- tion, thereby avoiding the need for bone marrow exami- nation [9]. Patients with ITP usually have increased lev- els of megakaryocytes in the bone marrow, but those with AA or post-chemotherapy have hypoplastic bone marrow [10].
RPs can be quantified by using flow cytometers and fluorescent dyes such as thiazole orange, which can bind RNA [11]. However, the flow cytometric measurement of RPs has limited clinical use because of much variation in the published reference intervals and lack of standard- ization [12]. Recently, a new automated measurement of RPs as IPF has been developed within the Sysmex XE- 2100 (Sysmex, Kobe, Japan). In this study, we measured
the IPF in healthy individuals and patients with ITP and AA to establish appropriate reference intervals and cut- off values of IPF that can be utilized for determining the underlying causes of thrombocytopenia.
MATERIALS AND METHODS 1. Study subjects
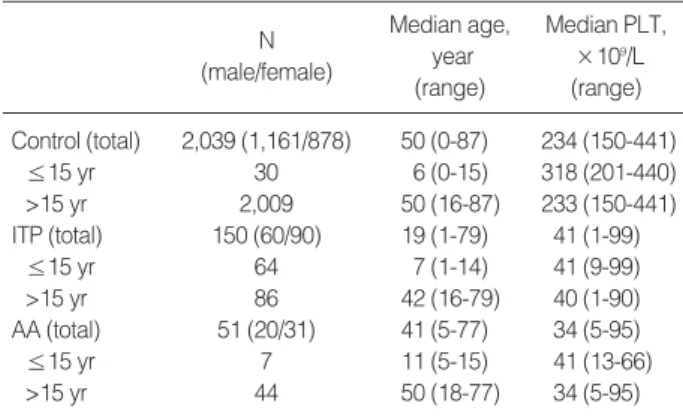
A total of 2,039 healthy individuals (1,161 males and 878 females; median age, 50 yr; range, 0-87 yr) with nor- mal blood count parameters, including normal platelet counts (150-450×109/L), were enrolled in the study to establish reference intervals for IPF% in the healthy pop- ulation (Table 1).
The diagnoses of the patient groups included ITP (N=150) and AA (N=51) with platelet counts of less than 100×109/L.
ITP was diagnosed on the basis of the patient’s medical history, isolated thrombocytopenia without other under- lying diseases, and additional laboratory tests, including anti-platelet antibody tests and bone marrow examina- tion, when necessary. Specimen from patients with ITP were not exclusively collected at the time of first diag- nosis but were also obtained from ITP patients who were in the follow-up period with or without treatment such as platelet transfusions and drug therapies. The diagno- sis of AA was based on the evidence of pancytopenia with- out other underlying diseases and pathologic findings by
Abbreviations: PLT, platelet; ITP, immune thrombocytopenia; AA, aplas- tic anemia.
N (male/female)
Median age, year (range)
Median PLT,
×109/L (range) Control (total) 2,039 (1,161/878) 50 (0-87) 234 (150-441)
≤15 yr 30 6 (0-15) 318 (201-440)
>15 yr 2,009 50 (16-87) 233 (150-441)
ITP (total) 150 (60/90) 19 (1-79) 41 (1-99)
≤15 yr 64 7 (1-14) 41 (9-99)
>15 yr 86 42 (16-79) 40 (1-90)
AA (total) 51 (20/31) 41 (5-77) 34 (5-95)
≤15 yr 7 11 (5-15) 41 (13-66)
>15 yr 44 50 (18-77) 34 (5-95)
Table 1. Subject characteristics
bone marrow examination.
2. Measurement of IPF
The Sysmex XE-2100 (Sysmex) is a fully-automated hematology analyzer employing flow cytometry and a semi-conductor diode laser system to analyze leuko- cytes, nucleated red cells, and reticulocytes (RET chan- nel) [13]. In the RET channel, 2 fluorescent dyes (polyme- thine and oxazine) in the RET-SEARCH (II) reagent penetrate into the cells and stain DNA/RNA. The stained cells are passed through a semiconductor diode laser beam and the resulting forward scatter light (cell volume) and fluorescence intensity (RNA content) are measured.
The mature and immature platelet fractions are identi- fied on the basis of their fluorescence intensity using spe- cial software (XE IPF MASTER). The IPF is expressed as a proportional value (IPF%) of the total optical platelet count to indicate the rate of platelet production (Fig. 1).
Peripheral blood samples (3 mL) collected in K2EDTA (Beckton Dickinson, Franklin Lakes, NJ, USA) were ana- lyzed for IPF% and all routine full blood count parame-
ters, including platelet counts. All samples were kept at room temperature until analysis and were analyzed within 8 hr after collection. The IPF results were available at the same time as the full blood counts were reproduced.
The reproducibility of the method was measured on 40 samples from the control group and 40 samples from the patient group with high IPF. The normal samples were measured twice and patient samples were measured 3 times. The stability of the method was analyzed by repeat- ed measurements of the IPF% from each patient sample every 4 hr (3 times). All samples were kept at room tem- perature until analysis.
3. Establishment of reference intervals
The reference interval was determined according to the guideline of CLSI [13]. A normality test was performed in all subgroups using the Kolmogorov-Smirnov test. Then, the non-parametric values of the observed reference data were transformed logarithmically. All transformed val- ues were conformed to a Gaussian distribution and pre- sented as mean with SD (mean±2 SD) and estimated 2.5th and 97.5th percentile. For 2 subclasses (e.g., men/women and young/adult), the statistical significance of the dif- ference between mean IPF% values of each subclass was tested by the standard normal deviate test; z=(x1-x2)/
[(s12/n1)+(s22/n2)]1/2and z*=3[(n1+n2)/240]1/2, where x1and x2 are the observed means of the 2 subgroups, s12 and s22
are the observed variances, and n1and n2are the num- bers of reference values in each subclass, respectively. If the calculated z value exceeded z*, or if the larger SD exceeded 1.5 times the smaller, separate reference inter- vals were calculated for each subclass. If these condi- tions did not hold, a single reference interval for the combined group of reference subjects was calculated.
4. Statistical analysis
Statistical analysis was performed using Statistical Analysis Software (SAS) (version 9.1.3; SAS Institute Inc., Cary, NC, USA). The differences between 2 groups Fig. 1. Optical platelet scattergrams with dot plots coordinated
against cell size (forward scatter) and fluorescence intensity (side scatter). Erythrocytes/reticulocytes and mature platelets/imma- ture platelet fraction (IPF) are differentiated by specially designed algorithm of the XE-2100 software. (A) healthy control, (B) immune thrombocytopenia, (C) aplastic anemia.
Cell volume
Fluorescence intensity A
B C
Erythrocytes Reticulocytes
IPF
were evaluated by the Wilcoxon two-sample test. Values were presented as median and interval. Values of P<0.05 were considered statistically significant. The ROC curves were obtained to determine the cut-off values of IPF%
for differentiating ITP from healthy controls and AA patients. Data comparison graphs were drawn with the Box-and-Whisker plot using MedCalc software (version 10, MedCalc software, Mariakerke, Belgium).
RESULTS
1. Analytical performance of IPF on reproducibility and stability
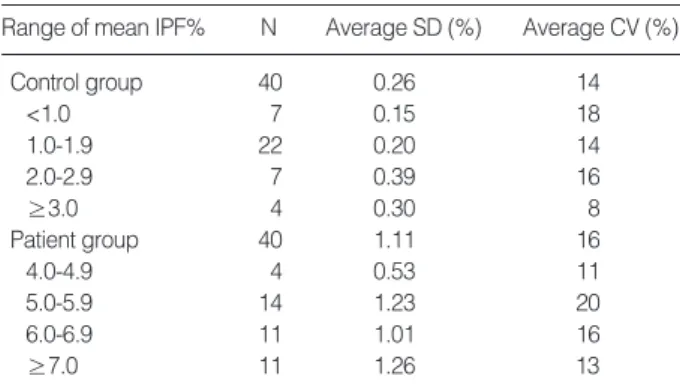
The reproducibility of the method of duplicate analysis using 40 samples from the control group was good (Table 2). The control group was divided into the 4 subgroups according to their mean IPF% values. The average CV%
for IPF% in the 4 subgroups was 18% (N=7, mean IPF%
<1%), 14% (N=22, mean IPF% 1.0-1.9%), 16% (N=7, mean IPF% 2.0-2.9%), and 8% (N=4, mean IPF% 3.0-4.6%). The small numerical value of the IPF% in all samples conse- quently led to higher CVs, but a gradual decrement in the CVs was observed with higher IPF%.
The average CV% of IPF% in the patient’s samples was 16% (N=40, mean IPF% 4.2-12.7%). The IPF% values remained stable over 8 h when blood samples were stored at room temperature. We did not see a consistent change in the IPF% value (Table 2).
2. Reference intervals of IPF by gender
The median platelet count in 2,039 healthy controls (1,161 males and 878 females) was 234×109/L (range, 150- 441×109/L). The IPF% values of healthy controls showed a non-parametric distribution and the log transforma- tion of the data followed the Gaussian distribution. A statistically significant difference in the IPF% values was observed between the 2 subgroups of each gender (P<0.0001). The reference interval of each group present- ed as mean±2SD (range of the 95% confidence interval) was 1.3±0.9% (0.5-3.2%) in males and 1.1±1.0% (0.4- 3.0%) in females (Table 3, Fig. 2).
3. IPF in patients with thrombocytopenia
The IPF% (median, range) was significantly higher in patients with ITP (7.7%, 1.0-33.8%) than in healthy indi- viduals (1.2%, 0.1-5.9%) (P<0.0001). The patients with AA had an increased IPF% (3.5%, 0.6-12.9%); the differ- ence in the IPF% values between ITP and AA patients was significant (P<0.0001) (Table 4, Fig. 3). We did not find a significant difference in the IPF% values of ITP patients between children and adults and between males and females. However, among the younger patients who were under 15 yr, the IPF% of boys was significantly high- er (8.4%, 2.5-26.0%) than that of girls (5.5%, 2.1-22.8%) (P=0.04).
The optimal IPF% values for discriminating between healthy controls and thrombocytopenic patients were determined from the ROC curve of sensitivity and speci-
Abbreviation: IPF, immature platelet fraction.
N
Range of mean IPF% Average SD (%) Average CV (%)
Control group 40 0.26 14
<1.0 7 0.15 18
1.0-1.9 22 0.20 14
2.0-2.9 7 0.39 16
≥3.0 4 0.30 8
Patient group 40 1.11 16
4.0-4.9 4 0.53 11
5.0-5.9 14 1.23 20
6.0-6.9 11 1.01 16
≥7.0 11 1.26 13
Table 2. Reproducibility and stability results of the control and patient group
Abbreviation: CI, confidence interval.
Females Males
N 1,161 878
Mean 1.3 1.1
SD 0.46 0.51
Reference interval
Mean±2 SD 0.4-2.2 0.1-2.1
2.5-97.5 percentile 0.5-3.2 0.4-3.0
95% CI of lower limit 0.50-0.55 0.38-0.42 95% CI of upper limit 3.05-3.34 2.79-3.13 Table 3. Reference interval of IPF (%), P<0.0001
ficity (Fig. 4). An IPF% value of 2.6% was the optimal cut-off value for distinguishing healthy controls and
ITP patients with a sensitivity of 93.3% and a specificity of 93.9%. The optimal cut-off value for differentiating ITP patients from AA patients was 7.3% with a sensitiv- ity of 54.0% and a specificity of 92.2%.
Fig. 2. Reference interval of immature platelet fraction (IPF) in healthy controls. The IPF values in 2 subgroups of the controls were as follows (median, mean±2 SD, range of 95% confidence interval): (1) males (1.3%, 1.3±0.9%, 0.5-3.2%) and (2) females (1.1%, 1.1±1.0%, 0.4-3.0%), with P<0.0001. The central box rep- resents the values from the lower to upper quartile (25 to 75 per- centile). The middle line represents the median. A line extends from the minimum to the maximum value, excluding “outside”
and “far out” values. An outside value is defined as a value that is smaller than the lower quartile minus 1.5 times the interquartile range or larger than the upper quartile plus 1.5 times the interquar- tile range (inner fences). A far out value is defined as a value that is smaller than the lower quartile minus 3 times the interquartile range or larger than the upper quartile plus 3 times the interquar- tile range (outer fences). These values are plotted with a different marker in red.
IPF (%)
6
5
4
3
2
1
0 Males Females
P<0.0001
Abbreviations: IPF, immature platelet fraction; ITP, immune thrombocy- topenia; AA, aplastic anemia.
N IPF (%)
median (range)
Subject Platelet count (×109/L)
median (range) Control (total) 2,039 1.2 (0.3-5.9) 234 (150-441)
Boys (≤15 yr) 15 0.7 (0.4-1.5) 293 (221-440) Girls (≤15 yr) 15 0.7 (0.3-1.3) 326 (201-428) Men (>15 yr) 1,146 1.3 (0.4-5.7) 225 (150-441) Women (>15 yr) 863 1.1 (0.3-5.9) 245 (150-429) ITP (total) 150 7.7 (1.0-33.8) 41 (1-99)
Boys (≤15 yr) 37 8.4 (2.5-26.0) 46 (9-99) Girls (≤15 yr) 27 5.5 (2.1-22.8) 35 (13-88) Men (>15 yr) 23 8.2 (1.6-22.5) 37 (15-90) Women (>15 yr) 63 7.8 (1.0-33.8) 42 (1-90)
AA (total) 51 3.5 (0.6-12.9) 34 (5-95)
Boys (≤15 yr) 2 4.7 (4.2-5.2) 37 (33-41) Girls (≤15 yr) 5 2.8 (1.8-8.2) 58 (13-66) Men (>15 yr) 18 4.7 (1.4-12.9) 44 (5-95) Women (>15 yr) 26 3.5 (0.6-7.5) 30 (6-92) Table 4. IPF results in healthy controls and patients with throm- bocytopenia
Fig. 3. Immature platelet fraction results in healthy controls and thrombocytopenic patients.
Abbreviations: IPF, immature platelet fraction; ITP, immune throm- bocytopenia; AA, aplastic anemia.
IPF (%)
6
5
4
3
2
1
0
Normal ITP AA
P<0.0001 P<0.0001
Fig. 4. The receiver-operating characteristics curves to distinguish the immune thrombocytopenia (ITP) patient group (N=150) from the healthy controls (N=2,039) and aplastic anemia (AA) patient group (N=51). The cut-off value of the immature platelet fraction (2.6%) differentiating ITP from healthy controls is indicated as a circle with a sensitivity of 93.3% and a specificity of 93.9%. The cut-off value for ITP against AA is 7.3% with a sensitivity of 54.0%
and a specificity of 92.2%.
Sensitivity
1.00
0.80
0.60
0.40
0.20
0.00
0.00 0.20 0.40 0.60 0.80 1.00
ITP vs AA
Normal controls vs ITP IPF=2.6
IPF=7.3
I-Specificity
DISCUSSION
A number of clinical papers on RP analysis have been published over the last decade. These clearly showed that, under conditions of thrombocytopenia, the platelet RNA content correlated directly with megakaryocytic activity [9]. The parameters of platelet production and turnover rate have also been studied using platelet lifespan [14], glycocalicin index [15], and thrombopoietin level [16]. How- ever, the platelet lifespan is not widely used because of problems associated with the manipulation of platelets and the use of radioactivity [17]. The glycocalicin index (glycocalicin level normalized for the individual platelet count) is an indicator of platelet turnover, but falsely elevated results have been reported in AA and hypoplas- tic anemia [18] and very large ranges were observed in autoimmune thrombocytopenic purpura [19]. A throm- bopoietin assay is useful for assessing platelet kinetics.
However, all of these assays have generally been limited to research units and are not readily available for moni- toring routine clinical samples [9].
The measurement of RPs by flow cytometry is cur- rently imprecise, expensive, and time-consuming, and it requires considerable expertise and lacks adequate quali- ty control [9]. High variation can be found in the pub- lished reference intervals in healthy subjects regarding RPs using different flow cytometric methods and even between laboratories using the same methodology [20].
The reference range for RPs of healthy individuals, as measured by flow cytometry, has still not been clearly defined [20], with values quoted from less than 1% [21] to 16.4% [12].
A newly developed automated measure of IPF is regard- ed as simple and clinically applicable for the determina- tion of RPs [9]. The previously reported reference inter- val using the Sysmex XE-2100 for healthy adults is between 0.4% and 10% [1, 9, 22-27]. The limitations of these reported reference intervals are: 1) small control groups, including less than 150 individuals, 2) incorrect application or lack of application of the CLSI guideline for determining reference intervals, and 3) exclusion of
pediatric individuals in the control group.
The CLSI guideline suggests the inclusion of at least 120 subjects of each gender, age, or other subclasses to determine a reference interval for each subgroup [13]. A test for the normal distribution of the data has to be per- formed, and then, the most suitable mathematical trans- formation (log, power, etc.) should be applied to the non- parametric reference values to normalize them if it is indicated.
In this study, unlike the previous reports on IPF with small control groups, a large number of healthy individ- uals (N=2,039) were included as control group to estab- lish the reference interval. The IPF (range of 2.5-97.5%) in healthy controls using the Sysmex XE-2100 was 0.5- 3.2% for males and 0.4-3.0% for females, which can be compared with the previously reported reference inter- vals ranging from 0.4% to 10% [1, 9, 22-27] without using subgroups by gender.
Some previously reported reference intervals for IPF measured on the same instrument (Sysmex XE-2100) showed somewhat higher mean values of IPF; it was 3.4%
(range, 1.1-6.1%) in a British group reported by Briggs et al. [9] and 3.3% (range, 1.0-10.3%) in a Japanese group reported by Abe et al. [1] as compared to the IPF value of this study (mean, 1.2%; range, 0.1-5.9%). This difference might be due to (1) inclusion of outliers in the upper extreme range leading to a higher mean value, (2) improp- er estimation of the mean value from the reference group with a small number of control individuals, or (3) simply ethnic variations in the IPF value among different eth- nic groups. According to the recent studies on IPF in a Korean group published by Kim et al. [28] and Cho et al.
[29], the reference means of IPF% were 2.2% and 1.7%, respectively. Their data are similar to the value of the present study (2.1%), which might support the hypothe- sis of ethnic variations in the IPF% values.
Even though the present study included a large number of healthy adult individuals, a limited number of pedi- atric individuals (N=30) were included as part of the con- trol group, which is insufficient to represent the sub- class of pediatric individuals. Thus far, there are no pub-
lished reports on the reference values of IPF% for a pedi- atric group because of practical difficulties in obtaining blood samples from healthy children in clinical settings.
For this reason, in the study with pediatric patients by Saigo et al. [30], the IPF% values employed as reference values in their study were obtained from pediatric patient when the bone marrow function had returned to the nor- mal range without the use of cytokines such as granu- locyte-colony stimulating factor (G-CSF). Therefore, more studies with a larger pediatric control group are necessary to provide useful information for future stud- ies on transplantation and transfusion in relation with IPF in pediatric patients.
The IPF% (median, range) for patients with ITP (7.7%, 1.0-33.8%) was significantly increased compared to that of the control group (1.2%, 0.1-5.9%) (P<0.0001). The mean IPF% values of ITP from previously reported studies are 16.8% by Brigg et al. [9] and 17.4% by Abe et al. [1]. In a Korean group, the mean IPF% in ITP patients was report- ed as 12.1% by Cho et al. [29]. In the present study, inclu- sion of ITP patients who were diagnosed with ITP in the follow up and who underwent drug treatment and trans- fusions might have led to the lower mean IPF% com- pared to that of other studies, which included only ini- tially diagnosed ITP patients.
Patients with AA had an increased IPF% (3.5%, 0.6- 12.9%), but the increase was less pronounced when com- pared to that of ITP patients. However, the difference in IPF% between patients with ITP and AA was significant (P<0.0001). This result indicates that the IPF% is a use- ful parameter for the estimation of thrombopoiesis, which makes it easier to establish the differential diagnosis of thrombocytopenia at the time of the initial diagnosis, thus avoiding the need for bone marrow examination in ITP.
By utilizing IPF% in the diagnostic process of thrombo- cytopenia, the peripheral destruction of platelets with markedly increased IPF% and active thrombopoiesis (as seen in patients with ITP) can be distinguished from hypoplastic bone marrow with decreased thrombopoiesis (as seen in patients with AA and bone marrow failure syndrome).
The optimal cut-off value for the diagnosis of increased thrombopoiesis was 2.6% with a sensitivity of 93.3% and a specificity of 93.9%, estimated by the ROC curve between controls and ITP patients. Previous studies by Abe et al.
[1], Kim et al. [28], and Cho et al. [29] reported cut-off values of 7.7%, 2.9%, and 6.1%, respectively. The rela- tively lower cut-off value obtained in this study (2.6%) might be explained by the lower reference mean value (2.1%) estimated in the present study than in the previ- ous studies (3.3% and 3.4% by Abe et al. [1] and Cho et al. [29], respectively). Our result is also supported by the report of Kim et al. [28] in which their low mean refer- ence value (1.7%) corresponded with a lower cut-off value (2.9%) similar to this study (2.6%).
However, the optimal cut-off value to differentiate patients with ITP from those with AA was 7.3%, as deter- mined by the ROC curve, with a sensitivity of 54.0% and a specificity of 92.2%. This result may suggest that throm- bocytopenic patients with increased IPF% (>7.3%) should not be considered as candidates for bone marrow failure syndrome.
The utility of IPF% other than for the diagnosis of thrombocytopenic patients has been demonstrated in recently published papers. The IPF% can be a useful parameter to estimate platelet recovery after peripheral blood stem cell transplant and chemotherapy, thereby reducing the number of unnecessary platelet transfu- sions. Following peripheral blood stem cell transplant in adults, the IPF% value rises 1-2 days prior to the incre- ment in platelet count [23, 25]. Saigo et al. [30] observed platelet recovery within 3-7 days after the day of peak IPF% in pediatric patients with various malignant disor- ders after chemotherapy.
In conclusion, this is the first report on the reference interval of IPF% in a large-scale study including more than 2,000 healthy individuals. This reference interval can be utilized as a basis for forthcoming studies on platelet transfusions, transplantations, and hematologic recovery after chemotherapy in various malignant dis- eases, which have been actively studied in clinical inves- tigations.
REFERENCES
1. Abe Y, Wada H, Tomatsu H, Sakaguchi A, Nishioka J, Yabu Y, et al.
A simple technique to determine thrombopoiesis level using imma- ture platelet fraction (IPF). Thromb Res 2006;118:463-9.
2. Cooper N and Bussel J. The pathogenesis of immune thrombocy- topaenic purpura. Br J Haematol 2006;133:364-74.
3. Diagnosis and treatment of idiopathic thrombocytopenic purpura.
American Society of Hematology ITP Practice Guideline Panel. Am Fam Physician 1996;54:2437-47, 51-2.
4. Jubelirer SJ and Harpold R. The role of the bone marrow examina- tion in the diagnosis of immune thrombocytopenic purpura: case series and literature review. Clin Appl Thromb Hemost 2002;8:73-6.
5. Ancliff PJ and Machin SJ. Trigger factors for prophylactic platelet transfusion. Blood Rev 1998;12:234-8.
6. Norfolk DR, Ancliffe PJ, Contreras M, Hunt BJ, Machin SJ, Murphy WG, et al. Consensus Conference on Platelet Transfusion, Royal Col- lege of Physicians of Edinburgh, 27-28 November 1997. Synopsis of background papers. Br J Haematol 1998;101:609-17.
7. Buttarello M and Plebani M. Automated blood cell counts: state of the art. Am J Clin Pathol 2008;130:104-16.
8. Ingram M and Coopersmith A. Reticulated platelets following acute blood loss. Br J Haematol 1969;17:225-9.
9. Briggs C, Kunka S, Hart D, Oguni S, Machin SJ. Assessment of an immature platelet fraction (IPF) in peripheral thrombocytopenia. Br J Haematol 2004;126:93-9.
10. Takubo T, Yamane T, Hino M, Tsuda I, Tatsumi N. Usefulness of determining reticulated and large platelets in idiopathic thrombo- cytopenic purpura. Acta Haematol 1998;99:109-10.
11. Kienast J and Schmitz G. Flow cytometric analysis of thiazole orange uptake by platelets: a diagnostic aid in the evaluation of thrombo- cytopenic disorders. Blood 1990;75:116-21.
12. Robinson MS, Mackie IJ, Khair K, Liesner R, Goodall AH, Savidge GF, et al. Flow cytometric analysis of reticulated platelets: evidence for a large proportion of non-specific labelling of dense granules by fluorescent dyes. Br J Haematol 1998;100:351-7.
13. Clinical and Laboratory Standards Institute. How to define and determine reference intervals in the clinical laboratory: approved guideline. CLSI document C28-A2. 2nd ed. Wayne, PA: CLSI, 2008.
14. de Vries RA, de Bruin M, Marx JJ, Van de Wiel A. Radioisotopic labels for blood cell survival studies: a review. Nucl Med Biol 1993;
20:809-17.
15. Steinberg MH, Kelton JG, Coller BS. Plasma glycocalicin. An aid in the classification of thrombocytopenic disorders. N Engl J Med 1987;
317:1037-42.
16. Porcelijn L, Folman CC, Bossers B, Huiskes E, Overbeeke MA, v d Schoot CE, et al. The diagnostic value of thrombopoietin level mea- surements in thrombocytopenia. Thromb Haemost 1998;79:1101-5.
17. Danpure HJ, Osman S, Brady F. The labelling of blood cells in plas- ma with 111In-tropolonate. Br J Radiol 1982;55:247-9.
18. Hayashi S, Oshida M, Kiyoi T, Tadokoro S, Kashiwagi H, Honda S, et al. Comparison of reticulated platelet count with plasma glyco- calicin concentration as a marker of platelet turnover in patients with thrombocytopenic disorders. Rinsho Ketsueki 2000;41:705-11.
19. Steffan A, Pradella P, Cordiano I, Girolami A, De Marco L, Fabris F.
Glycocalicin in the diagnosis and management of immune throm- bocytopenia. Eur J Haematol 1998;61:77-83.
20. Harrison P. Reticulated platelet taskforce report. Lab Hematol 2003;
9:91.
21. Rinder HM, Munz UJ, Ault KA, Bonan JL, Smith BR. Reticulated platelets in the evaluation of thrombopoietic disorders. Arch Pathol Lab Med 1993;117:606-10.
22. Albanyan A, Murphy MF, Wilcock M, Harrison P. Changes in the immature platelet fraction within ageing platelet concentrates. J Thromb Haemost 2008;6:2213-5.
23. Briggs C, Hart D, Kunka S, Oguni S, Machin SJ. Immature platelet fraction measurement: a future guide to platelet transfusion require- ment after haematopoietic stem cell transplantation. Transfus Med 2006;16:101-9.
24. Cesari F, Marcucci R, Caporale R, Paniccia R, Romano E, Gensini GF, et al. Relationship between high platelet turnover and platelet function in high-risk patients with coronary artery disease on dual antiplatelet therapy. Thromb Haemost 2008;99:930-5.
25. Zucker ML, Murphy CA, Rachel JM, Martinez GA, Abhyankar S, McGuirk JP, et al. Immature platelet fraction as a predictor of platelet recovery following hematopoietic progenitor cell transplantation.
Lab Hematol 2006;12:125-30.
26. Sugimori N, Kondo Y, Shibayama M, Omote M, Takami A, Sugi- mori C, et al. Aberrant increase in the immature platelet fraction in patients with myelodysplastic syndrome: a marker of karyotypic abnormalities associated with poor prognosis. Eur J Haematol 2009;
82:54-60.
27. Takami A, Shibayama M, Orito M, Omote M, Okumura H, Yamashita T, et al. Immature platelet fraction for prediction of platelet engraft- ment after allogeneic stem cell transplantation. Bone Marrow Trans- plant 2007;39:501-7.
28. Kim HR, Park BR, Lee MK, Park AJ, Ahn JY. Comparison of an imma- ture platelet fraction and reticulated platelet in liver cirrhosis. Kore- an J Lab Med 2007;27:7-12.
29. Cho YG, Lee JH, Kim DS, Lee HS, Choi SI. Clinical usefulness of the simple technique to diagnose thrombocytopenia using immature platelet fraction. Korean J Lab Med 2007;27:1-6.
30. Saigo K, Sakota Y, Masuda Y, Matsunaga K, Takenokuchi M, Nishimura K, et al. Automatic detection of immature platelets for decision making regarding platelet transfusion indications for pedi- atric patients. Transfus Apher Sci 2008;38:127-32.