Original Article
Received July 31, 2017, Revised September 23, 2017, Accepted October 24, 2017 Correspondence to: Yong Joo Lee
Department of Family Medicine, The Catholic University of Korea College of Medicine, 222 Banpo-daero, Seocho-gu, Seoul 06591, Korea
Tel: +82-2-2258-6298, Fax: +82-2-2258-1903, E-mail: [email protected]
This is an Open Access article distributed under the terms of the Creative Commons Attribution Non-Commercial License (http://creativecommons.org/licenses/by-nc/4.0) which permits unrestricted non-commercial use, distribu- tion, and reproduction in any medium, provided the original work is properly cited.
Change in Palliative Performance Scale (PPS) Predicts Survival in Patients with Terminal Cancer
Jee Hye Oh, M.D., Yong Joo Lee, M.D., Min Seok Seo, M.D., Jo Hi Yoon, M.D., Chul Min Kim, M.D. and Chung Kang, M.D.
Department of Family Medicine, The Catholic University of Korea College of Medicine, Seoul, Korea
Purpose: The Palliative Performance Scale (PPS) is a widely used prognostic tool in patients with advanced cancer.
This study examines the association between changes in PPS score and survival in patients with advanced cancer.
Methods: We identified a cohort of 606 inpatients who died at a Korean university hospital’s hospice/palliative care center. For each patient, the PPS score was measured twice according to a standard procedure: 1) upon admission, and 2) three days after admission (D3). “Change on D3” was defined as a difference between initial PPS and PPS on D3. We used a Cox regression modeling approach to explore the association between this score change and survival. Results: The changes in scores were associated with survival. A score change of >30%
yielded a hazard ratio for death of 2.66 (95% CI 2.19∼3.22), compared to a score change of ≤30%. PPS of
≤30 on D3 also independently predicted survival, with a hazard ratio of 1.67 (95% CI 1.38∼2.02) compared to PPS of >30. Conclusion: A change of over 30% in PPS appears to predict survival in hospitalized patients with terminal cancer, even after adjustment for confounders. Changes in PPS may be a more sensitive indicator of impending death than a single PPS measured on the day of admission in terminal cancer patients. Further prospective study is needed to examine this important finding in other populations.
Key Words: Palliative care, Hospice care, Prognosis, Survival
INTRODUCTION
Prognostication in terminally ill patients is one of the major subjects in the palliative care study. Many objective and sub- jective prognostic factors were examined to evaluate prognostic value to the patients. To date, patient’s performance status, diverse physical symptoms, biochemical markers, and other various subjective parameters were known as significant pro- gnostic factors (1-9). Such prognostic factors provide more accurate clinical information about patients to their physicians.
Among them, Palliative Performance Scale (PPS) is one of most commonly used tool to evaluate patient’ (10), numerous studies showed prognostic value of PPS (7,11-15). PPS con-
sisted of five parameters (ambulation, activity and evidence of disease, self-care, intake, and level of consciousness) which are mainly focused on patient’s physical function. While most studies concerned PPS at first time, recent study showed another possibility of PPS’s prognostic value. Not only the PPS scale itself, but the changes of the PPS also showed prognostic value to terminally ill patients (16). In the study, the magnitude of change in PPS during the terminal stage is also significantly associated with patient’s survival. Because physicians usually predict patients’ survival time by the changes or declining pace of performance status, changes of PPS also contains possibility as an objective prognostic tool. The aim of this study is to evaluate the prognostic value of PPS changes and degree of PPS changes in terminal cancer inpatients.
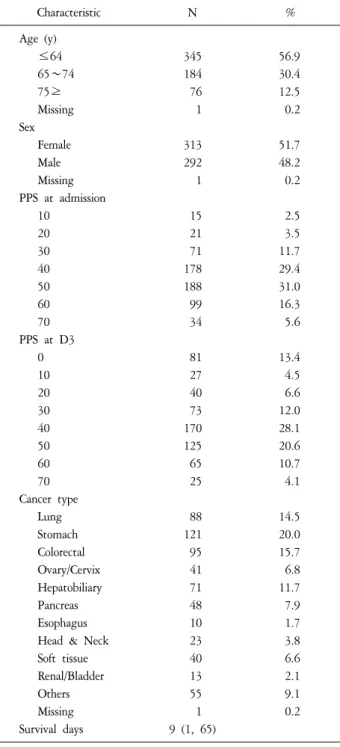
Table 1. Demographic and Clinical Characteristics (N=606).
Characteristic N %
Age (y)
≤64 345 56.9
65∼74 184 30.4
75≥ 76 12.5
Missing 1 0.2
Sex
Female 313 51.7
Male 292 48.2
Missing 1 0.2
PPS at admission
10 15 2.5
20 21 3.5
30 71 11.7
40 178 29.4
50 188 31.0
60 99 16.3
70 34 5.6
PPS at D3
0 81 13.4
10 27 4.5
20 40 6.6
30 73 12.0
40 170 28.1
50 125 20.6
60 65 10.7
70 25 4.1
Cancer type
Lung 88 14.5
Stomach 121 20.0
Colorectal 95 15.7
Ovary/Cervix 41 6.8
Hepatobiliary 71 11.7
Pancreas 48 7.9
Esophagus 10 1.7
Head & Neck 23 3.8
Soft tissue 40 6.6
Renal/Bladder 13 2.1
Others 55 9.1
Missing 1 0.2
Survival days 9 (1, 65)
PPS: Palliative Performance Scale.
METHODS 1. Study population
This is a retrospective cohort study of inpatients from Jan 2010 to Dec 2012 who died at a tertiary hospice/palliative care center in South Korea. Among the 800 patients, we reviewed medical record of 606 patients who were eligible to obtain demographic and clinical data including PPS scores at day 1 and day 3. One patient’s data had absent information of age, sex, and type of cancer. The institutional review boards at Seoul St. Mary’s Hospital has approved this study (IRB no. KC14RISI0074).
2. Study method
In this study, age, sex, type of cancer, PPS, and survival time were collected by the review of medical record. Survival time was defined as the duration between admission and expired date. PPS is a modified Karnofsky performance index that evaluates patients’ performance status. It reflects five functional statuses: ambulation, degree of disease, self-care, oral intake, and consciousness. PPS ranged from 0% to 100%
in 10% increment, with 100% defined as a normal and healthy state whereas 0% defined as death (10). PPS scores were measured twice as part of standard care: 1) on admission, and 2) after three days in the hospital (D3).
‘Change at D3’ was defined as the difference between initial PPS and PPS at D3, divided by initial PPS.
3. Statistical analysis
Frequencies and medians of clinical data were measured by descriptive statistics. Kaplan-Myer survival analyses for age, sex, type of cancer, PPS at admission, PPS at D3, PPS change at D3 were examined. Multivariate Cox regression analysis was performed to explore the association between PPS at D3, PPS changes at D3 and survival time adjusting for the influence of age, sex and primary cancer type. Statistical Package for Social Science ver. 16.02 (SPSS Inc., Chicago, IL, USA) was used for all statistical analyses. The significance level was a P value of <0.05 in all tests.
RESULTS
1. Demographic and clinical characteristics
Patient’s age was divided into three groups as below 64, 65 to 74, and over 75 years. The number of patients below 64 year old were 345, 65 to 74 were 184, and over 75 were 76.
Table 2. Hazard Ratio Adjusted for Sex, Age and Cancer Type.
Model 1 PPS at D3 Model 2 change at D3 Hazard ratio
(95% CI) P value* Hazard ratio
(95% CI) P value*
PPS at D3 -
≤30% 1.67 (1.38, 2.02) <0.001 40% 1.04 (0.85, 1.28) 0.699
≥50% Ref
Change at D3 -
>30% 2.66 (2.19, 3.22) <0.001
≤30% Ref
PPS: Palliative Performance Scale.
*P value was derived from cox proportional hazard model using a standardized variable.
Figure 1. Kaplan-Meier estimates of overall survival of patients (A) PPS at D3 grouped by ≤30%, 40%, ≥50%; (B) PPS change grouped by
≤30% and >30%.
PPS: Palliative Performance Scale.
The number of males was 292 and female was 313. The number of each PPS score at admission from 10% to 70%
showed 15, 21, 71, 178, 188, 99, 34 and PPS at D3 from 0 to 70% showed 81, 27, 40, 73, 170, 125, 65, and 25 each.
The most common cancer type was stomach cancer with 121 patients following 95 colorectal cancer, 88 lung cancer, 71 hepatobiliary cancer, 48 pancreas cancer, 41 ovary/cervix cancer.
Median survival time of the patients was 9 day (Table 1).
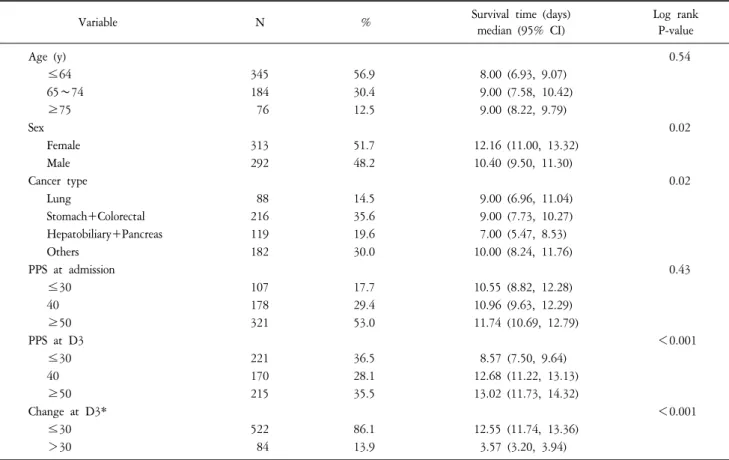
2. Comparison of survival time of patients’ age, sex, type of cancer, PPS at admission, PPS at D3, and changes in PPS at D3
Differences of survival time were analyzed by grouping age, sex, type of cancer, PPS at admission, PPS at D3, PPS changes at D3. Age, PPS at admission showed no significant differences of survival time. Sex, type of cancer, PPS at D3, and PPS changes at D3 showed significant differences of survival time. Female revealed 9 days of survival time which is longer than 8 days of male. Lung cancer and stomach/
colorectal cancer had 9 days of median survival time while hepatobiliary/pancreas cancer showed 7 days of relatively shorter survival time. PPS at D3 below 30%, 40%, over 50%
showed each 8.57, 12.68, and 13.02 days of different survival time. PPS changes at D3 over 30% showed 3.57 days of survival time while PPS changes below 30% showed 12.55 days of survival time.
3. Multivariate Cox proportional hazard model
Multivariate Cox regression analyses were examined to evaluate hazard ration of PPS at D3 and PPS changes at D3.
Adjusting age, sex, and type of cancer, PPS at D3 below 30% showed significant higher hazard ratio of 1.67 and 40%
showed insignificant hazard ratio compared with PPS at D3 50%. PPS changes at D3 over 30% showed significant higher hazard ratio of 2.66 compared with PPS changed at D3 below 30% (Table 2).
4. Kaplan-Meier estimates of overall survival of patients Kaplan-Meier estimates of overall survival of patients were analyzed by grouping PPS at D3 and changes at D3. Patients
Table 3. Survival Time by PPS at D3 and Change at D3 (N=606).
Variable N % Survival time (days)
median (95% CI)
Log rank P-value
Age (y) 0.54
≤64 345 56.9 8.00 (6.93, 9.07)
65∼74 184 30.4 9.00 (7.58, 10.42)
≥75 76 12.5 9.00 (8.22, 9.79)
Sex 0.02
Female 313 51.7 12.16 (11.00, 13.32)
Male 292 48.2 10.40 (9.50, 11.30)
Cancer type 0.02
Lung 88 14.5 9.00 (6.96, 11.04)
Stomach+Colorectal 216 35.6 9.00 (7.73, 10.27)
Hepatobiliary+Pancreas 119 19.6 7.00 (5.47, 8.53)
Others 182 30.0 10.00 (8.24, 11.76)
PPS at admission 0.43
≤30 107 17.7 10.55 (8.82, 12.28)
40 178 29.4 10.96 (9.63, 12.29)
≥50 321 53.0 11.74 (10.69, 12.79)
PPS at D3 <0.001
≤30 221 36.5 8.57 (7.50, 9.64)
40 170 28.1 12.68 (11.22, 13.13)
≥50 215 35.5 13.02 (11.73, 14.32)
Change at D3* <0.001
≤30 522 86.1 12.55 (11.74, 13.36)
>30 84 13.9 3.57 (3.20, 3.94)
PPS: Palliative Performance Scale.
*Change at D3=(PPS at admission-PPS at D3)/(PPS at admission)×100.
having PPS at D3 over 50% had significantly longer survival than those with PPS at D3 40% and below 30%. In addition, PPS changes at D3 over 30% showed shorter survival than those with changes below 30% (Figure 1).
DISCUSSION
Cross-sectional PPS were commonly used for evaluating patient’s prognosis. However, pace of declining patient’s condition often provide crucial information to predict appro- priate prognosis. In this study, both change of PPS at D3 below 30% and degree of PPS changes at D3 over 30% were independent predictors of survival time when we adjusted for sex, age, and cancer type. Among the significant prognostic factors, degree of changes in PPS in D3 showed strongest hazard ratio. Our study also showed similar result with a previous study. Although PPS at admission was a strong predictor of survival, scores of PPS 10% through PPS 50%
also led to distinct survival curves that meant a larger in- crement in PPS change was associated with poorer survival time (16,17). However, PPS at admission showed no signi- ficant differences of survival time in each three PPS groups (Table 3). It is because of very short survival time that the mean survival time was lowest from 10.55 to highest 11.74 days in this study. The median survival time of all patients was even shorter than the Korea’s nationwide median survival time of 18 days (18). These late referral to hospice and palliative care is one of the important issues of palliative care system in Korea (18) which result in relatively short duration of palliative care services than other countries (19). Moreover, admissions at impending death status, unexpected death, and long admission waiting times are thought to be other reasons of short survival time in this study.
Previous studies demonstrated that changes of performance status such as palliative prognostic index (PPI), Eastern Coo- perative Oncology Group (ECOG), and PPS showed as an
independent prognostic factor in patients with terminal cancer.
Arai et al. (20) suggested that the change of PPI per day might be an useful marker to predict the survival of terminal cancer patient in palliative care unit. Another study reported that magnitude of PPI score change between day 1 and day 8 provided more accurate and reliable information related with survival predictions than day 1 PPI alone (21). Peng et al.
(22) reported that sequential assessment of ECOG between day 1 and day 8 was more precise method for predicting survival time than initial assessment alone in terminal cancer patients who are receiving palliative care. Studies concerned with PPS also showed similar results with forementioned studies. Seow et al. (23) reported that the hazard ratio significantly increases 1.7 times with 10% decrease of PPS score in ambulatory cancer patients. Chan et al. (21) demon- strated that while PPS at admission showed no significant hazard ratio, the over 30% change of PPS showed significant hazard ratios by 3.14 and 7.66 at week 1 and with 2, res- pectively. Consistent with previous findings, our results re- vealed that PPS change even in 3 days assessment was signi- ficantly associated with survival in patients with terminal cancer.
There are few studies investigating prognosis of advanced cancer patients with rapid declining performance status.
Studies are rather focused on associations between intractable symptoms and poor prognosis (24-27). Therefore, little is identified about the mechanisms or causal relationships between declining of performance status and prognosis.
Limited data demonstrated that as the progression of primary cancer and metastasis gradually promote activation of inflammatory cytokines and interleukins, systemic symptoms such as fatigue, cachexia-anorexia, and decreased performance status are developing. Poor immune system and physical status are associated with complications such as severe sepsis, hemorrhage, embolism, and multiple organ failure which were known as major cause of death (28-36). By previous studies, rapid declining of patient’s performance status appears to be a result of cancer progression, imbalanced immune system and unexpected complications. Rapid declining performance is also required both careful management of reversible factor and the possibility of death. Regular evaluation of PPS and PPS change may provide tailored information about the prognosis of impending death patients and enables physicians
establishing proper care plans. But it is uncertain that how often subsequent assessment is appropriate in terminal cancer patient. According to recent researchers, they agreed that it is optimal to reassess the functional status within 7 days (21,37).
However, in practice physicians have to face more frequent and detailed assessment of numerous medical problems including PPS so that regular interval time may need more flexible consideration by medical environment and patient’s survival time.
There are several limitations in this study. Because this study is performed in a single tertiary hospice/palliative hospital, the result cannot be a standard to general population. And we could not gain the whole data from the all patients admitted in same time due to a nature of retrospective studies. We could not analyze other prognostic factors (38-40). Prospective study needs longitudinal analyses of PPS changes among cancer type, cancer-related complication, and extension of metastasis are also required.
PPS changes, especially PPS changes more than 30%
appears to be a prognostic factor in terminal cancer patients.
Tailored estimation of PPS change is warranted to provide a useful prognostic tool in terminally ill patients.
요 약
목적: Palliative Performance Scale (PPS)는 진행성 암환자 에서 널리 사용되는 예후도구이다. PPS 측정이 생존에 대한 예측을 의미하지만, 연속적인 PPS 측정에 대한 유 용성은 추가적인 연구가 필요하다. 본 연구에서는 완화 병동에 입원한 진행성 암환자를 대상으로 PPS score의 변화와 생존간의 연관성에 대해 진행한 연구이다.
방법: 2010년 1월부터 2012년 12월까지 서울성모병원
완화의학과에 입원한 환자 606에 대한 의무기록을 통하 여 입원 당일의 PPS score와 입원 3일째의 PPS score 그리 고, 두 score의 차이를 측정하여 점수의 변화와 생존간의 관련성을 분석하였다.
결과: PPS score의 변화와 생존과는 통계적으로 유의
한 관련이 있었다. PPS score의 변화가 30% 이하인 군과 비교하였을 때, 30% 초과된 군에서 hazard ratio가 2.66 (95% CI 2.19∼3.22)로 확인되었다. 입원 3일째 PPS score 가 30% 이하인 경우 독립적으로 생존에 대한 예측이 가 능하였으며, PPS score 30% 초과된 군과 비교했을 때 hazard ratio는 1.67 (95% CI 1.38∼2.02)로 확인되었다. 입
원 당시의 PPS score는 생존과 독립적인 관련성은 없었다.
결론: 후향적으로 의무기록 분석을 통해 이루어진 본
연구에서 30% 이상의 PPS score 변화는 입원중인 말기 암환자의 생존과의 관련이 확인되었다. 입원 당시의 PPS score는 생존을 예측하지 못했다. PPS score의 변화는 말기암환자에서 단일 PPS score 측정보다 더 민감한 지 표일 수 있다. 차후 더 많은 환자들에서 이에 대한 다기 관, 전향적 연구가 필요하다.
중심단어: 완화의료, 호스피스, 예후, 생존 REFERENCES
1. Allin KH, Nordestgaard BG. Elevated C-reactive protein in the diagnosis, prognosis, and cause of cancer. Crit Rev Clin Lab Sci 2011;48:155-70.
2. Caraceni A, Nanni O, Maltoni M, Piva L, Indelli M, Arnoldi E, et al. Impact of delirium on the short term prognosis of advanced cancer patients. Italian Multicenter Study Group on Palliative Care. Cancer 2000;89:1145-9.
3. Ho F, Lau F, Downing MG, Lesperance M. A reliability and validity study of the Palliative Performance Scale. BMC Palliat Care 2008;7:10.
4. Kersten C, Louhimo J, Algars A, Lahdesmaki A, Cvancerova M, Stenstedt K, et al. Increased C-reactive protein implies a poorer stage-specific prognosis in colon cancer. Acta Oncol 2013;
52:1691-8.
5. Lee SY, Lee YJ, Yang JH, Kim CM, Choi WS. The Association between Phase Angle of Bioelectrical Impedance Analysis and Survival Time in Advanced Cancer Patients: Preliminary Study.
Korean J Fam Med 2014;35:251-6.
6. Lee YJ, Suh SY, Choi YS, Shim JY, Seo AR, Choi SE, et al.
EORTC QLQ-C15-PAL quality of life score as a prognostic indicator of survival in patients with far advanced cancer.
Support Care Cancer 2014;22:1941-8.
7. Morita T, Tsunoda J, Inoue S, Chihara S. Validity of the palliative performance scale from a survival perspective. J Pain Symptom Manage 1999;18:2-3.
8. Suh SY, Choi YS, Yeom CH, Kwak SM, Yoon HM, Kim DG, et al. Interleukin-6 but not tumour necrosis factor-alpha predicts survival in patients with advanced cancer. Supportive Care in Cancer 2013;21:3071-7.
9. Yoon J, Ahn SH, Lee YJ, Kim CM. Hyponatremia as an independent prognostic factor in patients with terminal cancer.
Support Care Cancer 2015;23:1735-40.
10. Anderson F, Downing GM, Hill J, Casorso L, Lerch N.
Palliative performance scale (PPS): a new tool. J Palliat Care 1996;12:5-11.
11. Downing M, Lau F, Lesperance M, Karlson N, Shaw J,
Kuziemsky C, et al. Meta-analysis of survival prediction with Palliative Performance Scale. J Palliat Care 2007;23:245-52;
discussion 252-4.
12. Lau F, Bell H, Dean M, Downing M, Lesperance M. Use of the Palliative Performance Scale in survival prediction for terminally ill patients in Western Newfoundland, Canada. J Palliat Care 2008;24:282-4.
13. Lau F, Downing M, Lesperance M, Karlson N, Kuziemsky C, Yang J. Using the Palliative Performance Scale to provide meaningful survival estimates. J Pain Symptom Manage 2009;38:134-44.
14. Myers J, Kim A, Flanagan J, Selby D. Palliative performance scale and survival among outpatients with advanced cancer.
Support Care Cancer 2015;23:913-8.
15. Weng LC, Huang HL, Wilkie DJ, Hoenig NA, Suarez ML, Marschke M, et al. Predicting survival with the Palliative Performance Scale in a minority-serving hospice and palliative care program. J Pain Symptom Manage 2009;37:642-8.
16. Chan EY, Wu HY, Chan YH. Revisiting the Palliative Performance Scale: change in scores during disease trajectory predicts survival. Palliat Med 2013;27:367-74.
17. Lau F, Downing GM, Lesperance M, Shaw J, Kuziemsky C. Use of Palliative Performance Scale in end-of-life prognostication. J Palliat Med 2006;9:1066-75.
18. Baek YJ, Shin DW, Choi JY, Kang J, Mo HN, Kim YH, et al. Late referral to palliative care services in Korea. J Pain Symptom Manage 2011;41:692-9.
19. Lee YJ, Yang JH, Lee JW, Yoon J, Nah JR, Choi WS, et al.
Association between the duration of palliative care service and survival in terminal cancer patients. Support Care Cancer 2015;23:1057-62.
20. Arai Y, Okajima Y, Kotani K, Tamba K. Prognostication based on the change in the palliative prognostic index for patients with terminal cancer. J Pain Symptom Manage 2014;47:742-7.
21. Kao CY, Hung YS, Wang HM, Chen JS, Chin TL, Lu CY, et al. Combination of initial palliative prognostic index and score change provides a better prognostic value for terminally ill cancer patients: a six-year observational cohort study. J Pain Symptom Manage 2014;48:804-14.
22. Peng MT, Liu CT, Hung YS, Kao CY, Chang PH, Yeh KY, et al. Sequential Assessments of the Eastern Cooperative Oncology Group Performance Scale Enhance Prognostic Value in Patients With Terminally Ill Cancer Receiving Palliative Care. Am J Hosp Palliat Care 2016;33:471-6.
23. Seow H, Barbera L, Dudgeon D, Howell D, Husain A, Atzema C, et al. The association of the palliative performance scale and hazard of death in an ambulatory cancer population. J Palliat Med 2013;16:156-62.
24. Flume PA. Medicinal treatment of intractable dyspnea in terminally ill patients. J S C Med Assoc 2002;98:196-9.
25. Hilliard N, Brown S, Mitchinson S. A case report of
dexmedetomidine used to treat intractable pain and delirium in a tertiary palliative care unit. Palliat Med 2015;29:278-81.
26. Strand JJ, Feely MA, Kramer NM, Moeschler SM, Swetz KM.
Palliative Sedation and What Constitutes Active Dying: A Case of Severe Progressive Dystonia and Intractable Pain. Am J Hosp Palliat Care 2016;33:363-8.
27. Watson PN, Evans RJ. Intractable pain with lung cancer. Pain 1987;29:163-73.
28. Bachmann J, Heiligensetzer M, Krakowski-Roosen H, Buchler MW, Friess H, Martignoni ME. Cachexia worsens prognosis in patients with resectable pancreatic cancer. J Gastrointest Surg 2008;12:1193-201.
29. Gioulbasanis I, Georgoulias P, Vlachostergios PJ, Baracos V, Ghosh S, Giannousi Z, et al. Mini Nutritional Assessment (MNA) and biochemical markers of cachexia in metastatic lung cancer patients: interrelations and associations with prognosis.
Lung Cancer 2011;74:516-20.
30. Jin C, Li J, Wang Y, Chen X, Che Y, Liu X, et al. Impact of cellular immune function on prognosis of lung cancer patients after cytokine-induced killer cell therapy. Asian Pac J Cancer Prev 2014;15:6009-14.
31. Kimura M, Naito T, Kenmotsu H, Taira T, Wakuda K, Oyakawa T, et al. Prognostic impact of cancer cachexia in patients with advanced non-small cell lung cancer. Support Care Cancer 2015;23:1699-708.
32. Kimura T, Kamiura S, Yamamoto T, Seino-Noda H, Ohira H, Saji F. Abnormal uterine bleeding and prognosis of endometrial cancer. Int J Gynaecol Obstet 2004;85:145-50.
33. Li Y, Jin ZC, Cai Y, Ji MS, Liu J. Value of serum procalcitonin in evaluating the prognosis of sepsis in elderly patients with colorectal cancer undergoing emergency colorectal surgery.
Indian J Surg 2013;75:86-93.
34. Wang J, Zhou W, Xu L, Yang M, Meng L, Fan W, et al. Risk factors and prognosis of lung cancer combined with pulmonary embolism. Zhongguo Fei Ai Za Zhi 2011;14:780-4.
35. Wu D, Tao J, Ding J, Qu P, Lu Q, Zhang W. Interleukin-11, an interleukin-6-like cytokine, is a promising predictor for bladder cancer prognosis. Mol Med Rep 2013;7:684-8.
36. Yoshitomi M, Yutani S, Matsueda S, Ioji T, Komatsu N, Shichijo S, et al. Personalized peptide vaccination for advanced biliary tract cancer: IL-6, nutritional status and pre-existing antigen-specific immunity as possible biomarkers for patient prognosis. Exp Ther Med 2013;3:463-9.
37. Peng M, Liu C, Hung Y, Kao C, Chang P, Yeh K, et al.
Sequential Assessments of the Eastern Cooperative Oncology Group Performance Scale Enhance Prognostic Value in Patients With Terminally Ill Cancer Receiving Palliative Care. Am J Hosp Palliat Care 2016;33:471-6.
38. Alsirafy SA, Sroor MY, Al-Shahri MZ. Predictive impact of electrolyte abnormalities on the admission outcome and survival of palliative care cancer referrals. J Palliat Med 2009;12:177-80.
39. Glare P. Clinical predictors of survival in advanced cancer. J Support Oncol 2005;3:331-9.
40. Vigano A, Bruera E, Jhangri GS, Newman SC, Fields AL, Suarez-Almazor ME. Clinical survival predictors in patients with advanced cancer. Arch Intern Med 2000;160:861-8.