경락경혈학회지 Vol.28, No.4, pp.41 48, 2011∼ Korean Journal of Acupuncture
Sang-Hun Lee, Sung-Jin Cho, Gwang-Ho Choi, Yeon-Hee Ryu, O-Sang Kwon, Sun-Mi Choi Acupuncture, Moxibustion & Meridian Research Group Division of Standard Research, KIOM
Abstract
Objectives : This study aimed to explore the passive multi-channel time series analysis method by measuring bio-potentials of acupuncture point and the peripheral region
Methods : Bio-potential was measured at ST36 and the peripherical region of ST36 of 5 healthy volunteers at three times. The diagram of the potential changes over time were smoothed by moving average method and similarities of ST36 and the other points were calculated.
Results : In the normal weight group, bio-potential similarity tended to decrease in proportion to the distance from the acupuncture point. In the obesity group, bio-potential similarity appeared in a very wide area. Bio-potential similarity had positive correlation with BMI value.
Conclusions : The passive multi-channel time series analysis method showed the possibility be appropriate for the electrical characteristics study of meridians.
Key words : biopotential, bioelectric potential, areal characteristics, similarity, BMI
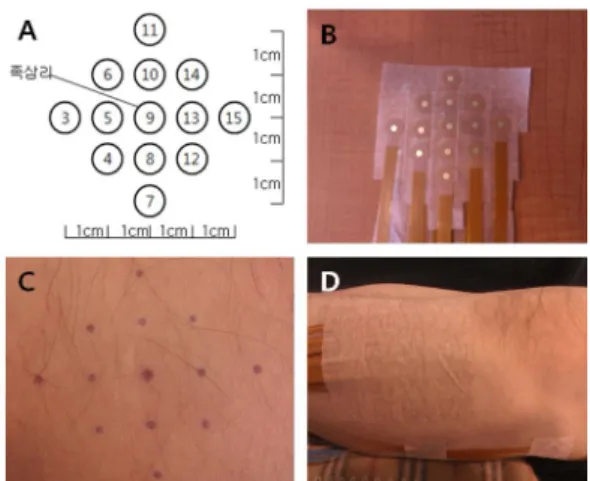
Fig. 1. Measuring points at ST36 and electrode array.
Fig. 2. Comparing smoothing result with its raw data.
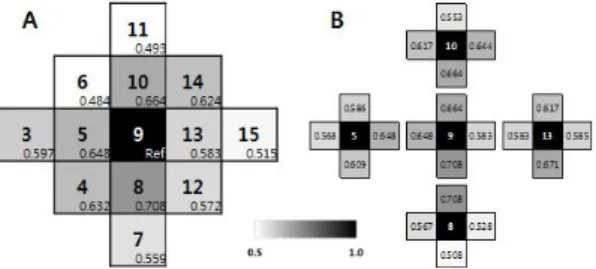
Fig. 3. Individual similarities of whole channels with channel 9(A), and partial analysis of four corners(B):
subject A.
Fig. 4. Individual similarities of whole channels with channel 9(A), and partial analysis of four corners(B):
subject B.
Fig. 5. Individual similarities of whole channels with channel 9(A), and partial analysis of four corners(B):
subject C.
Fig. 6. Individual similarities of whole channels with channel 9(A), and partial analysis of four corners(B):
subject D.
Fig. 7. Individual similarities of whole channels with channel 9(A), and partial analysis of four corners(B):
subject E.
Fig. 8. Bio-potential similarity versus subject according to the distance : 1cm(Average of Ch5, 8, 10, 13), 1.44cm(Average of Ch4, 6, 12, 14), 2cm(Average of Ch3, 7, 11, 15)
Table 1. Subjects’ BMIs and the results of bio- potential similarity.
Fig. 9. Bio-potential similarity versus BMI.