Sarcopenia Is Significantly Associated with Presence and Severity of Nonalcoholic Fatty Liver Disease
Goh Eun Chung1, Min Joo Kim1, Jeong Yoon Yim1, Joo Sung Kim1,2, Ji Won Yoon1,*
1Department of Internal Medicine, Seoul National University Hospital Healthcare System Gangnam Center, Seoul; 2Division of Gastroenterology, Department of Internal Medicine, Seoul National University College of Medicine, Seoul, Korea
Background: The association between nonalcoholic fatty liver disease (NAFLD) and sarcopenia has been sug- gested. We investigated the association between sarcopenia and NAFLD independent of visceral adiposity and searched for the clinical characteristics that affect this association.
Methods: We performed a retrospective study including of 5,989 subjects (mean age, 53.2 years; men, 57.3%) who underwent bioelectrical impedance analysis (BIA) and abdominal ultrasonography in 2012. The appendic- ular skeletal muscle mass (ASM) was assessed by BIA method. Sarcopenia was defined as ASM/weight (ASM%)
<2 standard deviation of the mean for healthy young reference population. NAFLD was diagnosed by ultraso- nography.
Results: The prevalence of sarcopenia was 5.3%. The prevalence of NAFLD was significantly higher in subjects with sarcopenia than in those without (69.5% vs. 36.5%, P<0.001). After adjusting with age, sex, visceral fat area, hypertension, diabetes, total and low-density lipoprotein cholesterol, subjects with sarcopenia showed signifi- cantly high odds of NAFLD (odds ratio [OR], 1.37; 95% confidence interval [CI], 1.02–1.84; P=0.036). Subjects with sarcopenia have more likely severe grade of NAFLD compared to non-sarcopenic group (OR, 1.58; 95% CI, 1.25–2.00; P<0.001). There was significant interaction for effect modification in the association between sarco- penia and NAFLD by age (P of interaction for effect modification, 0.007).
Conclusion: Sarcopenia was significantly associated with the presence and the severity of ultrasonography- graded NAFLD in our study population independent of visceral fatness and other metabolic confounder. Young- er age showed greater magnitude of association between sarcopenia and NAFLD.
Key words: Sarcopenia, Non-alcoholic fatty liver disease, Skeletal muscle, Intra-abdominal fat
Received February 16, 2019 Reviewed March 13, 2019 Accepted June 13, 2019
* Corresponding author Ji Won Yoon
https://orcid.org/0000-0001-9003-0614 Department of Internal Medicine, Seoul National University Hospital Healthcare System Gangnam Center,
152 Teheran-ro, Gangnam-gu, Seoul 06236, Korea
Tel: +82-2-2112-5677 Fax: +82-2-2112-5794 E-mail: [email protected]
INTRODUCTION
Nonalcoholic fatty liver disease (NAFLD) has becoming the most leading cause of chronic liver disease, with prevalence up to 20%–
30% of general population.
1Even though most of NAFLD follows a benign clinical course, simple steatosis can progresses to nonalco- holic steatohepatitis (NASH), 25% of whom may experience pro- gression of liver fibrosis and cirrhosis.
2,3In addition, patients with NASH have been reported to have higher liver-related mortality compared to the general population.
4However, the clinical signifi-
cance of NAFLD is not limited to liver. NAFLD is also associated with various metabolic conditions such as obesity, dyslipidemia, type 2 diabetes mellitus and cardiovascular diseases.
5-7Insulin resis- tance is considered to be a shared pathophysiologic mechanism be- tween NAFLD and the other metabolic diseases.
8Alterations in adipokines, adipose tissue inflammation, and increased serum free fatty acids, which are accompanied with the development of viscer- al obesity, are proposed mechanisms linking insulin resistance and NAFLD and could explain the association between visceral fat and NAFLD.
9Copyright © 2019 Korean Society for the Study of Obesity
This is an Open Access article distributed under the terms of the Creative Commons Attribution Non-Commercial License (http://creativecommons.org/licenses/by-nc/4.0/) which permits unrestricted non-commercial use, distribution, and reproduction in any medium, provided the original work is properly cited.
2017-03-16 https://crossmark-cdn.crossref.org/widget/v2.0/logos/CROSSMARK_Color_square.svg
Skeletal muscle is one of the important target organs of insulin and previous studies have accumulated evidences for a link be- tween sarcopenia and insulin resistance.
10,11Based on the shared common pathophysiology of insulin resistance, the association of sarcopenia with NAFLD has been studied and the relevance has been reported in several studies.
12-16Recently, not only the presence of NAFLD but also the severity of NAFLD is reported to be asso- ciated with sarcopenia.
12,15Also, the existence of effect modification by age, sex, and obesity status, etc. in the association between sar- copenia and NALFD has been suggested in previous studies.
16,17However, the presence or the characteristics of these effect modifi- ers in the relationship between sarcopenia and NAFLD have not yet been fully elucidated.
In this study, we aimed to investigate the relationship between sarcopenia and NAFLD and tried to find out whether this relation- ship differs according to subgroups with different clinical character- istics in health checkup examinees.
METHODS Study population
In this retrospective study, subjects who underwent bioelectrical analysis between January 2012 and December 2012 during health checkup at Seoul National University Hospital Healthcare System Gangnam Center were consecutively enrolled for this study. Initially, a total of 7,239 subjects were enrolled. Among them, 578 subjects with no abdominal sonography data and four subjects without an- thropometric measurement were excluded. We also excluded sub- jects who had potential cause of chronic liver disease; 268 were pos- itive for the hepatitis B virus, 57 were positive for the hepatitis C vi- rus and 343 with significant alcohol intake (>20 g/day for males and >10 g/day for females).
18There was no subjects with preg- nancy, cirrhosis or end stage renal disease in this study population.
Finally, 5,989 subjects were analyzed.
This study was approved by the Institutional Review Board of the Seoul National University Hospital (IRB No. 1803-009-924).
Informed consent was waived because researchers only accessed and analyzed de-identified data.
Clinical and laboratory assessments
Each subject completed a past medical history questionnaire and received an anthropometric assessment and laboratory and radio- logic tests on the same day. A current smoker was defined as a per- son who smoked at least one cigarette per day for the previous 12 months. Systolic and diastolic blood pressure was measured twice, measured twice, and the mean values were reported. The presence of hypertension was defined as a systolic blood pressure ≥ 140 mmHg or diastolic blood pressure ≥ 90 mmHg more than twice or taking anti-hypertensive medication. The presence of diabetes was defined as either taking anti-diabetic medications or a fasting se- rum glucose and glycosylated hemoglobin (HbA1c) level ≥ 126 mg/dL and ≥ 6.5%, respectively.
Blood samples were collected before 10:00 AM after a 12-hour overnight fast. The laboratory tests included serum alanine amino- transferase (ALT), aspartate aminotransferase (AST), gamma-glu- tamyltransferase (GGT), total cholesterol, triglyceride, high-densi- ty lipoprotein (HDL) cholesterol, low-density lipoprotein (LDL) cholesterol, fasting glucose, HbA1c, uric acid, hepatitis B surface antigen and antibody to hepatitis C virus. All laboratory tests were carried out using standard laboratory methods.
Anthropometric measurements
Body weight and height were measured using a digital scale, and body mass index (BMI) was calculated as weight (kg)/height square (m
2). Waist circumference (WC) was measured at the mid- point between the lower costal margin and the anterior superior ili- ac crest by a well-trained person using a tape. For assessing body composition, bioelectrical impedance analysis (BIA) was per- formed using the InBody 720 body composition analyzer (InBody, Seoul, Korea). The subjects were in standing position in 5–10 min- utes with their legs slightly separated and the arms slightly abduct- ed from the trunk. The subjects were instructed to hold the handles of the analyzer, for contacting with electrodes in each limb. When the measurements stabilized, it provides impedance for each seg- ment including the trunk and the four limbs by performing multi- frequency measurements to estimate the appendicular skeletal muscle mass (ASM).
We used a previously described method to assess the visceral fat
area (VFA) on abdominal fat computed tomography (CT) imag-
es.
19Briefly, the individuals were examined in the supine position with a 16-detecter CT scanner (Somatom Sensation 16; Siemens Medical Solutions, Forchheim, Germany). The VFA was measured using commercially available CT software (Rapidia 2.8; IN- FINITT, Seoul, Korea) by setting the attenuation values for adi- pose tissue area with a range of –250 to –50 Hounsfield units.
Definitions of sarcopenia, obesity and abdominal obesity
ASM (kg) was calculated as the sum of the lean muscle mass in the bilateral upper and lower limbs. ASM% was calculated as ASM/
weight (kg)× 100, modified from the Janssen et al.’s study.
20Sarco- penia was defined as ASM% beyond two standard deviation (SD) below the sex-specific mean for young reference population obtained from nationwide health examination in Korean (ASM% < 29.0 in men or < 22.9 in women).
21Obesity was defined as BMI value
≥ 25 kg/m
2according to the WHO recommendation for Asian- Pacific region. Abdominal obesity is defined as a WC ≥ 90 cm for men and ≥ 85 cm for women according to the guideline by Korean Society for the Study of Obesity.
22Assessment of NAFLD
Hepatic ultrasonography (US; Acuson Sequoia 512, Siemens, Mountain View, CA, USA) was performed by experienced radiolo- gists to diagnose fatty liver. They were blinded to the clinical and laboratory details of the subjects at the time of evaluation. The di- agnosis was made with characteristic ultrasonographic findings such as ‘‘bright liver’’ and evident contrast between hepatic and renal parenchyma, vessel blurring, focal sparing, and narrowing of the lu- men of the hepatic veins.
23,24The degree of fatty change by US was graded semi-quantitatively as grade 0–3 according to the criteria by Saadeh et al.
25In this study, we referred to grade 0 as normal, grade 1, 2, and 3 as mild, moderate and severe NAFLD, respectively.
Statistical analysis
Continuous variables were expressed as mean± SD, and categor- ical variables were expressed as number and percent. Comparisons of continuous variables between groups were performed using Stu- dent t-test or analysis of variance, and categorical variables were compared using chi-square test or Fisher’s exact tests. ASM% was divided into quartiles according to sex. The group with the highest
ASM% value was defined as 1st quartile (Q1), and the group with lowest ASM% value is defined as 4th quartile (Q4). In male, ASM%
ranges were Q1 > 33.95, > 32.35 Q2 ≤ 33.95, > 30.78 Q3 ≤ 32.35, and Q4 ≤30.78. In female, ASM% ranges were Q1 >29.61, >27.69 Q2 ≤29.61, >25.97 Q3 ≤27.69, and Q4 ≤ 25.97. The association between Sarcopenia and the severity of NAFLD evaluated by US was evaluated using a chi-square test. Correlations between ASM%
and metabolic variables were analyzed using Pearson correlation coefficient. Univariate analysis was performed to identify risk fac- tors associated with NAFLD. Multivariate logistic regression analysis was performed to determine the independent association between sarcopenia and the presence of NAFLD after adjusting for age and sex in model 1; variables in model 1, VFA, hypertension, and dia- betes mellitus in model 2; variables in model 2, total cholesterol, and LDL cholesterol in model 3. In this analysis, we also used ASM%
quartile (ASM%_Q) as independent variable to identify the dose- response relationship between the muscle mass and NAFLD. An ordinal logistic regression analysis was used to investigate the asso- ciation between sarcopenia/ASM%_Q and the severity of NAFLD with same adjustment in model 1, 2, and 3.
Stratified analysis was performed in subgroups according to age, sex, obesity and abdominal obesity status and diabetes mellitus. Age was divided into tertiles as follows: T1, 19–49 years old; T2, 50–57 years old; T3, 58–87 years old. A P-value of interaction for effect modification was obtained by putting interaction term (ASM%_Q×
subgroups) in the regression model. All statistical analyses were performed using IBM SPSS version 22.0 (IBM Corp., Armonk, NY, USA) and R statistical software version 3.2.2 (R Development Core Team; R Foundation for Statistical Computing, Vienna, Aus- tria). The P-values <0.05 were considered statistically significant.
RESULTS
Clinical characteristics according to the sarcopenia status
Among the total of 5,989 subjects, the prevalence of sarcopenia is 5.3% (315/5,989). Mean age of our study population was 53.2±
9.4 and 57.3% was male participants. The clinical characteristics ac-
cording to the sarcopenia status are summarized in Table 1. The in-
dividuals with sarcopenia are older, had a higher prevalence of male,
higher BMI, WC and, VFA than the control group (P<0.001).
These differences in obesity status and body composition resulted in significantly different metabolic profiles; the individuals with sar- copenia had higher prevalence of diabetes mellitus and hyperten- sion, higher blood pressure, and serum levels of AST, ALT, GGT, total triglycerides, LDL-cholesterol, fasting glucose and HbA1c.
The values of ASM% were significantly lower in the sarcopenia group compared to the control group (P<0.05 for all) (Table 1).
Prevalence and severity of NAFLD in sarcopenia
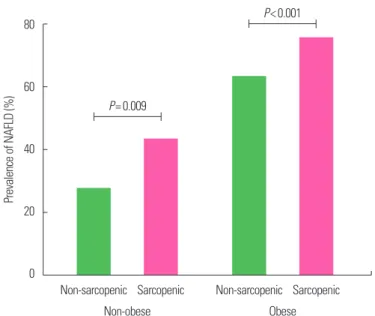
The prevalence of NAFLD was significantly higher in subjects with sarcopenia than in those without (69.5% vs. 36.5%, P<0.001) (Table 1). We stratified subjects into nonobese and obese popula- tion based on BMI at baseline. The prevalence of NAFLD in the sarcopenic group was significantly higher than the non-sarcopenic group not only in obese population (sarcopenic vs. non-sarcopenic, 75.3% vs. 62.8%; P<0.001) but also in non-obese population (42.9%
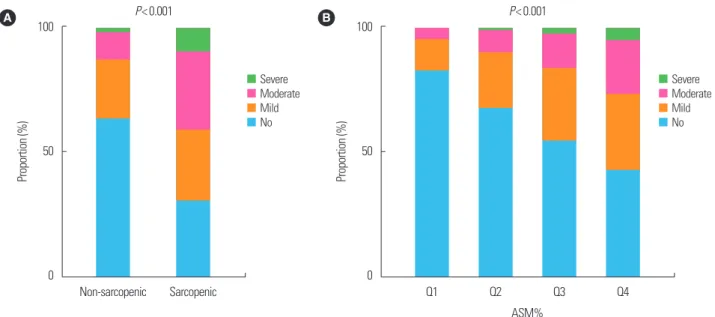
vs. 27.1%; P=0.009) (Fig. 1). We evaluated the US-graded severity of NAFLD according to the quartile of ASM% as well as presence of sarcopenia. Subjects with sarcopenia showed significantly greater severity of NAFLD compared to subjects without sarcopenia (P<0.001, by linear association). It was also observed that subjects with the lower the ASM%_Q, the greater the severity of NAFLD (P<0.001, by linear association) (Fig. 2).
Factors related to ASM% and the presence of NAFLD
A relationship between ASM% and various metabolic parame- ters were investigated by correlation analysis. ASM% was negatively correlated with age, BMI, WC, VFA, systolic blood pressure, total cholesterol, HDL-cholesterol and LDL-cholesterol. On the other hand, height, weight, diastolic blood pressure and uric acid level showed positive correlation with ASM% (P<0.001 for all) (Sup- plementary Table 1). Also, we performed univariate analysis to de-
Table 1. Comparison of baseline characteristics according to the presence of sar-copenia
Variable Total
(n= 5,989) Control
(n= 5,674) Sarcopenia
(n= 315) P
Age (yr) 53.2± 9.4 53.0± 9.2 57.1± 11.4 < 0.001
Male sex 3,431 (57.3) 3,201 (56.4) 230 (73.0) < 0.001 Height (cm) 165.7± 8.2 165.8± 8.2 163.7± 8.4 < 0.001 Weight (kg) 64.7± 11.7 64.1± 11.2 75.0± 14.5 < 0.001 BMI (kg/m2) 23.4± 3.0 23.2± 2.8 27.8± 3.6 < 0.001 WC (cm)
Male 88.0± 7.3 87.4± 6.7 97.3± 8.4 < 0.001
Female 79.7± 7.8 79.2± 7.3 92.8± 10.0 < 0.001 VFA (cm2) 114.4± 55.4 110.9± 53.0 179.3± 57.7 < 0.001
ASM (kg) 19.8± 4.6 19.8± 4.5 19.8± 4.9 0.993
ASM% 30.4± 3.5 30.7± 3.3 26.2± 3.1 < 0.001
SBP (mmHg) 116.4± 13.7 116.0± 13.6 124.1± 14.2 < 0.001 DBP (mmHg) 74.3± 10.4 74.1± 10.3 78.2± 10.8 < 0.001 AST (IU/L) 25.3± 29.6 25.1± 30.3 28.8± 13.4 0.034 ALT (IU/L) 26.3± 34.8 25.8± 35.3 35.9± 23.5 < 0.001 GGT (IU/L) 35.2± 39.1 34.5± 38.7 48.1± 42.7 < 0.001 Cholesterol (mg/dL) 194.7± 35.1 194.6± 35.3 196.5± 37.7 0.352 TG (mg/dL) 107.6± 79.9 106.5± 80.6 128.6± 62.2 < 0.001 HDL cholesterol (mg/dL)
Male 48.0± 9.8 48.1± 9.8 46.4± 8.9 0.010
Female 56.0± 11.4 56.0± 11.4 54.9± 9.7 0.307
LDL cholesterol (mg/dL) 121.9± 30.7 121.6± 30.5 127.4± 33.6 0.004 Fasting glucose (mg/dL) 97.6± 19.7 97.1± 19.1 106.3± 27.4 < 0.001
HbA1c (%) 5.7± 0.6 5.7± 0.6 6.0± 0.8 < 0.001
Uric acid (mg/dL) 5.5± 1.4 5.4± 1.4 6.2± 1.6 < 0.001
Diabetes mellitus 299 (5.0) 272 (4.8) 27 (8.6) 0.004
Hypertension 892 (14.9) 804 (14.2) 88 (27.9) < 0.001
Smoking < 0.050
Never 1,540 (46.5) 1,489 (47.1) 51 (34.0)
Former 1,137 (34.3) 1,068 (33.8) 69 (46.0)
Current 635 (19.2) 605 (19.1) 30 (20.0)
NAFLD 2,290 (38.2) 2,071 (36.5) 219 (69.5) < 0.001
Values are presented as mean± standard deviation or number (%).
BMI, body mass index; WC, waist circumference; VFA, visceral fat area; ASM, appen- dicular skeletal muscle mass; SBP, systolic blood pressure; DBP, diastolic blood pres- sure; AST, aspartate aminotransferase; ALT, alanine aminotransferase; GGT, gamma- glutamyltransferase; TG, triglyceride; HDL, high-density lipoprotein; LDL, low-density li- poprotein; HbA1c, glycosylated hemoglobin; NAFLD, nonalcoholic fatty liver disease.
Figure 1. Prevalence of nonalcoholic fatty liver disease (NAFLD) in sarcopenic and non-sarcopenic subjects according to obesity status.
80
60
40
20
0
Prevalence of NAFLD (%)
Non-sarcopenic
Non-sarcopenic Sarcopenic Sarcopenic
Non-obese Obese
P< 0.001
P= 0.009
termine risk factors for having NAFLD. For evaluation of the asso- ciation between sarcopenia and NAFLD, we performed univariate and multivariate analysis of the risk for NAFLD. Age, sex, BMI, WC, VFA, hypertension, diabetes mellitus, triglyceride, HDL-cho- lesterol, LDL-cholesterol and ALT levels were significantly associ- ated with the risk of NAFLD (P<0.001 for all) (Supplementary Table 2).
Independent impact of sarcopenia on the presence of NAFLD
To verify whether sarcopenia has independent effect on the pres- ence of NAFLD, multiple logistic regression analyses were performed (Table 2). First, the presence of sarcopenia was used as an indepen- dent variable. After adjusting with age and sex, subjects with sarco- penia showed significantly high odds of NAFLD (odds ratio [OR], 3.46; 95% confidence interval [CI], 2.68–4.45, P<0.001). With further adjustment with VFA, hypertension and diabetes mellitus,
this association attenuated but remained statistically significant (OR, 1.38; 95% CI, 1.03–1.85, P=0.030). Additional adjustment with total cholesterol and LDL cholesterol had little impact on the effect size and the significance of the association (OR, 1.37; 95% CI, 1.02–
1.84, P=0.036) (Table 2). Next, ASM%_Q was used as an indepen- dent variable to identify the dose response relationship. ASM%_Q was treated as continuous variable, and OR implies a degree of in- creased risk that NAFLD will accompany each ASM%_Q reduc- tion. Even after adjustment for age, sex, VFA, hypertension, diabe- tes mellitus, total and LDL-cholesterol, low ASM%_Q is signifi- cantly associated with increased with of NAFLD (OR, 1.28; 95%
CI, 1.21–1.37; P<0.001) (Table 2). Even after further adjustment with smoking history, triglyceride and HDL cholesterol, which were significantly associated with sarcopenia as well as NAFLD, ORs and statistical significance were maintained for both sarcopenia and ASM%_Q (Supplementary Table 3).
Figure 2. The severity of nonalcoholic fatty liver disease according to (A) sarcopenia and (B) appendicular skeletal muscle mass (ASM)% quartiles (Qs).
P< 0.001 100
50
0
Proportion (%)
Non-sarcopenic Sarcopenic A
Severe Moderate Mild No
ASM%
P< 0.001 100
50
0
Proportion (%)
Q1 Q2 Q3 Q4
B
Severe Moderate Mild No
Table 2. Multivariate analyses of the risk for NAFLD
Variable Model 1 Model 2 Model 3
OR (95% CI) P OR (95% CI) P OR (95% CI) P
Sarcopenia 3.46 (2.68–4.45) < 0.001 1.38 (1.03–1.85) 0.030 1.37 (1.02–1.84) 0.036
ASM%_Q 1.85 (1.74–1.94) < 0.001 1.29 (1.21–1.37) < 0.001 1.28 (1.21–1.37) < 0.001
Model 1: adjusted for age and sex; Model 2: adjusted for age, sex, VFA, hypertension, and diabetes mellitus; Model 3: adjusted for age, sex, VFA, hypertension and diabetes melli- tus, total cholesterol, and low-density lipoprotein cholesterol.
NAFLD, nonalcoholic fatty liver disease; OR, odds ratio; CI, confidence interval; ASM, appendicular skeletal muscle mass; Q, quartile; VFA, visceral fat area.
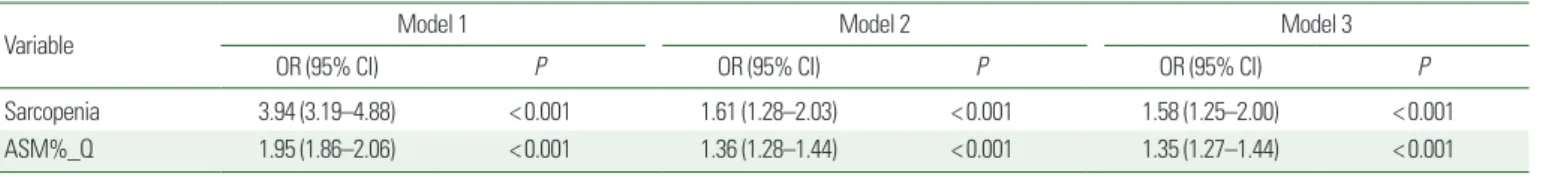
Independent impact of sarcopenia on the severity of NAFLD
Next, we evaluated the relationship between sarcopenia and US- graded severity of NAFLD. Subjects with sarcopenia have more likely severe grade of NAFLD with the OR as 1.58 (95% CI, 1.25–
2.00) compared to non-sarcopenic group, a statistically significant effect, Wald χ
2(1)= 16.308, P<0.001 after adjustment with con- founding factors. Also, each time the ASM% move from Q1 to Q4, the probability of having a severe NALFD increases by 1.35 times (95% CI, 1.27–1.44) after adjustment with statistical significance (P<0.001) (Table 3). Further adjustment with smoking history, triglyceride and HDL cholesterol showed similar results (Supple- mentary Table 4).
Stratified analysis in various subgroups
To investigate the presence of effect modifier, we divided sub- groups according to age, sex, obesity and abdominal obesity status, and existence of diabetes mellitus. Age was categorized as tertiles (T1, T2, T3). In the subgroup analysis by age, adjusted OR was higher in lower age groups and there was significant interaction for effect modification (T1 vs. T2 vs. T3: OR, 1.46 vs. 1.31 vs. 1.22, P of interaction for effect modification= 0.007). Female showed nu- merically smaller effect size than male but it was statistically insig- nificant (female vs. male: OR, 1.17 vs 1.40, P for interaction=0.947).
Differences between subgroups according to obesity, abdominal obesity and diabetes mellitus were insignificant (P for interaction
> 0.05) (Table 4).
DISCUSSION
We aimed to verify the implication of sarcopenia in the presence and severity of NAFLD evaluated by US. In our study population,
sarcopenia is significantly associated with NAFLD even after ad- justing possible confounding factors including visceral adiposity. In addition, sarcopenia independently increased severity of NAFLD.
In the subgroup analysis, risk of NAFLD according to sarcopenia was significantly higher in younger subjects.
Sarcopenia is characterized as loss of skeletal muscle with low muscle strength and/or physical performance
26and is associated with the increased risk of comorbidity, disability and mortality.
27,28The prevalence of sarcopenia varies significantly ranging 5%–13%
in 60- to 70-year-olds, reflecting the differences in study popula- tion, the different methods used to define sarcopenia.
28,29In this study, we adopted the definition of (ASM/weight× 100), which is modified from the definition by Janssen et al.
20In the previous studies using Janssen’s method performed in Korean elderly sub-
Table 3. Ordinal logistic regression analysis for the severity of NAFLDVariable Model 1 Model 2 Model 3
OR (95% CI) P OR (95% CI) P OR (95% CI) P
Sarcopenia 3.94 (3.19–4.88) < 0.001 1.61 (1.28–2.03) < 0.001 1.58 (1.25–2.00) < 0.001
ASM%_Q 1.95 (1.86–2.06) < 0.001 1.36 (1.28–1.44) < 0.001 1.35 (1.27–1.44) < 0.001
Model 1: adjusted for age and sex; Model 2: adjusted for age, sex, VFA, hypertension, and diabetes mellitus; Model 3: adjusted for age, sex, VFA, hypertension and diabetes melli- tus, total cholesterol, and low-density lipoprotein cholesterol.
NAFLD, nonalcoholic fatty liver disease; OR, odds ratio; CI, confidence interval; ASM, appendicular skeletal muscle mass; Q, quartile; VFA, visceral fat area.
Table 4. Stratified analysis of the risk for NAFLD in various subgroups
Variable OR (95% CI) P for interaction
Age (yr) 0.007
T1 (19–49) 1.46 (1.30–1.64)
T2 (50–57) 1.31 (1.18–1.46)
T3 (58–87) 1.22 (1.09–1.36)
Sex* 0.947
Male 1.40 (1.30–1.52)
Female 1.17 (1.04–1.31)
Obesity 0.238
No 1.22 (1.12–1.32)
Yes 1.27 (1.12–1.45)
Abdominal obesity 0.094
No 1.27 (1.12–1.43)
Yes 1.29 (1.20–1.40)
DM 0.816
No 1.33 (1.25–1.42)
Yes 1.35 (1.02–1.80)
Adjusted for age, sex, and VFA.
*Adjusted for age and VFA.
NAFLD, nonalcoholic fatty liver disease; OR, odds ratio; CI, confidence interval; DM, di- abetes mellitus; VFA, visceral fat area.