INTRODUCTION
With a prevalence up to 2% of women and 4% of men in general (1, 2), obstructive sleep apnea (OSA) is a common disorder. Patients with OSA complain of snoring, daytime sleepiness, cognitive dysfunction, sexual dysfunction, and psychiatric disturbances such as depression and personality change (3). Well-known complications comprise cognitive impairment due to hypoxia and cardiovascular impacts, which may develop hypertension (HT), arrhythmia, heart failure, and myocardial infarction.
Among these cardiovascular complications, HT is most typical and challenging. Epidemiological studies have found that 30-35% of patients with essential HT have OSA (4-7) and 60% of patients with OSA have HT (8). This relation- ship between OSA and HT is strongly supported by the finding that tracheostomy or continuous positive airway pressure (CPAP), known to relieve OSA, possibly corrects HT (9, 10). To demonstrate the correlation between HT and OSA, blood pressure (BP) fluctuations during sleep in patients with OSA have been examined. Though it is not certain whether BP is decreased or increased during apnea episodes, it has been consistently found that BP is elevated at the termination of apnea episodes (11).
Several methods used to measure nocturnal BP have limi- tations. The commonly-used invasive method (12) disrupts the subjects’sleep by making subjects uncomfortable. The ambulatory cuff with its measurement interval up to 30 min can not pursue apnea-by-apnea BP fluctuations of patients with OSA (13). Studies using beat-to-beat and non-invasive method have been done during a fraction of nocturnal sleep- ing time (14).
To clarify the pathophysiology of OSA and HT, we mea- sured BP throughout a night of nocturnal polysomnography (NPSG). We traced BP during rapid eye movement (REM) and non-rapid eye movement (NREM) sleep for the whole night, using a non-invasive beat-to-beat method. By com- paring baseline, pre-apneic, and post-apneic BP, we examined BP reactivity in OSA. Among variables such as degree of arousal, hypoxia, and respiratory disturbance (RD) duration, we determined the most influential factor in BP reactivity.
SUBJECTS AND METHODS Subjects
Patients suspected of OSA were referred to the Division In-Young Yoon, Do-Un Jeong*
Yong-In Mental Hospital; Department of Neuropsychiatry and Division of Sleep Studies*, Seoul National University Hospital, Seoul, Korea
Address for correspondence Do-Un Jeong, M.D.
Department of Neuropsychiatry and Division of Sleep Studies, Seoul National University Hospital, 28 Yongon-dong, Chongno-gu, Seoul 110-744, Korea
Tel : +82.2-760-2294, Fax : +82.2-766-1592 E-mail : [email protected]
707
Degree of Arousal Is Most Correlated with Blood Pressure Reactivity During Sleep in Obstructive Sleep Apnea
We investigated blood pressure (BP) reactivity of obstructive sleep apnea (OSA) during rapid eye movement (REM) sleep and non-rapid eye movement (NREM) sleep. The influences on BP reactivity of degree of arousal, the lowest O2satu- ration (SaO2), and respiratory disturbance (RD) duration were compared. Ten normotensive or borderline hypertensive patients with OSA were studied with one-night polysomnography including non-invasive beat-to-beat BP monitoring (Finapres�). We compared baseline BP, pre-apneic BP, and post-apneic BP during both REM and NREM sleep. Also, relationships between delta BP (post- apneic BP minus pre-apneic BP) and degree of arousal, the lowest SaO2, and RD duration were examined. During both REM and NREM sleep, pre-apneic BP was elevated compared with baseline BP. Post-apneic BP elevation was noted compared with pre-apneic BP. The degree of arousal was more significantly cor- related with delta BP than the lowest SaO2. RD duration was hardly correlated with delta BP. Pre-apneic BP elevation seems to result from cumulation of sym- pathetic activation and sympathetic nervous system resetting. The correlation between delta BP and degree of arousal suggests that sympathetic activation causing post-apneic BP elevation may result mainly from an arousal response regardless of hypoxia.
Key Words : Blood Pressure; Sleep Apnea, Obstructive; Arousal; Sympathetic Nervous System; Anoxia
Received : 31 May 2001 Accepted : 6 August 2001
of Sleep Studies, Seoul National University Hospital. After history taking, physical and neurological examinations, and one-night NPSG, we selected 10 subjects meeting the fol- lowing criteria: 1) respiratory disturbance index (RDI) more than 10 RDI defined as the sum of apneas and hypopneas divided by total sleep time per hour - with central apneas excluded but mixed apneas included, reflecting obstructive component (15); 2) absence of narcolepsy or periodic limb movements during sleep (PLMS), which elevates BP (16);
3) without autonomic nervous system diseases or endocrine disorders which might influence BP; 4) without respiratory diseases; 5) normotensive or borderline hypertensive (BP was measured twice both at the day of first visit and at the NPSG night, and their BPs were not higher than 140/95 in any measurements); and 6) without usage of CPAP or surgery to relieve OSA.
METHODS Sleep recording and BP measurement
We used a Grass Model 78 polysomnograph (PSG), and standard electrodes and sensors. Electroencephalography (EEG) electrodes were applied at C3/A2, O1/A2 and O2/A1, and two electrooculography (EOG) electrodes applied at both sides of eye to record horizontal and vetical eye move- ments. Submental electromyography (EMG) electrodes were applied at the submentalis muscle and EMGs of both ante- rior tibialis muscles recorded limb movements during sleep.
We used strain gauges for recording chest and abdominal respiratory movements, and a thermocouple for recording airflow. A photoplethysmographic sensor for oxygen satura- tion was applied at the left index finger.
For continuous non-invasive beat-to-beat BP measurement during sleep, a Finapres�transducer (Ohmeda) was applied to the left middle finger. Finapres�is based on infrared ple- thysmography, measuring blood flow in proportion to in- frared absorption. BP measured at the middle finger was con- nected to the patient interface module (PIM). For real-time downloading and storage of these BP data, we made a com- puter program using the C language. For time synchroniza- tion between NPSG data and BP data, the program sent a time signal to the PSG.
The height of the hand in relation to the heart gives rise to a great difference in the BP values measured with the Finapres�. To allow the subjects to sleep in comfortable state as possible, we fixed the PIM on the wrist. Using videotape records, we excluded data when the subjects lay on their sides or the hand position changed from the original. Based on the criteria of Rechtschaffen and Kales (17), we scored every epoch of 30 sec NPSG.
Parameter definition
We defined BP variables as follows: 1) baseline BP as the mean of BP measurements during 1 min after a 15-min rest in a wakeful state; 2) pre-apneic BP as the mean of 5 BP mea- surements immediately before an apnea or hypopnea; 3) post- apneic BP as the mean of 5 BP measurements around the max- imum BP within 20 sec after an apnea or hypopnea termina- tion; 4) delta BP as the post-apneic BP minus pre-apneic BP.
We divided degree of arousal into 4 grades based on Re- chtschaffen and Kales (17), Bonnet et al. (18), and Davies et al. (19): 1) Grade 0 - no change in EEG frequency and ampli- tude, and chin EMG; 2) Grade 1- when one of the follow- ing criteria was met: i) a shift in EEG frequency to theta, alpha, or frequencies greater than 16 Hz, which lasted less than 10 sec or appearance of high amplitude which lasted less than 10 sec, ii) limb or body movements which lasted less than 10 sec, iii) chin EMG change without sleep stage shift during REM sleep, and iv) K complex appearance in EEG; 3) Grade 2- when one of the following criteria was met: i) a shift in EEG frequency to theta, alpha, or frequen- cies greater than 16 Hz, which lasted more than 10 sec or appearance of high amplitude which lasted more than 10 sec, ii) limb or body movements which lasted more than 10 sec, and iii) chin EMG change with stage shift during REM sleep;
and 4) Grade 3- shift to a wakeful epoch.
Based on airflow amplitude decreases, we manually mea- sured RD duration in 1.5 sec units. We defined the lowest O2saturation (SaO2) as the lowest SaO2within 30 sec after an apnea or hypopnea termination.
Statistical analysis
For statistical analysis, we used SPSS 8.0 for Windows.
Using repeated measures ANOVA, we compared baseline, pre-apneic, and post-apneic BP. Paired t-test was done be- tween 2 BPs if ANOVA showed a significance. To deter- mine the most influential factor in post-apneic BP elevation among degree of arousal, lowest SaO2, and RD duration, stepwise multiple regression analyses were done, with delta BP as a dependent variable, and with degree of arousal, low- est SaO2, and RD duration as independent variables. All tests were two-tailed and significance was defined at p<0.05.
RESULTS Characteristics of subjects
All subjects were men, aged 31 to 69 yr. Table 1 presents daytime BP, obesity-related characteristics, and NPSG results.
Subject 1 and 9 were borderline hypertensive, and the oth- ers were normotensive. All subjects weighed more than 110
% of ideal body weight except Subject 3. The fact that their
waist/hip ratios were around 1 means they were centrally obese. RDI ranged from 10.8 to 79.2, and lowest SaO2ranged from 60% to 85%. Classification of OSA severity based on RDI and lowest O2saturation revealed that it ranged from mild to severe in degree (20).
Comparison among baseline, pre-apneic, and post- apneic BP
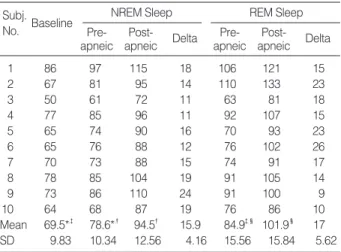
Table 2 shows baseline, pre-apneic, and post-apneic sys- tolic blood pressures (SBP). There were significant differ- ences among 3 SBPs both during NREM and REM sleep (ANOVA, p<0.05, p<0.05, respectively). Similar results were observed when the 3 diastolic blood pressures (DBP) were compared. Paired t-tests were done as post-hoc analy-
ses. Pre-apneic SBP was increased compared with baseline SBP during both NREM and REM sleep (p<0.05, p<0.05, respectively). Post-apneic SBP was significantly higher than pre-apneic SBP during both NREM and REM sleep (p<0.05, p<0.05, respectively). We observed the same pattern of blood pressure reactivity in DBP as in SBP (Table 3).
Comparing BP reactivity between NREM and REM sleep, pre-apneic BP was higher during REM sleep than during NREM sleep both in SBP and DBP (p<0.05, p<0.05, respec- tively). Post-apneic BP was higher during REM sleep than during NREM sleep both in SBP and DBP, but the differ- ence was statistically significant only in SBP (p<0.05, p=
0.052, respectively). Although comparison between delta SBP during REM and NREM sleep showed no significant difference, delta SBP tended to be higher during REM than during NREM sleep (Table 2). Delta DBP showed a similar pattern (Table 3).
Factors influencing post-apneic blood pressure eleva- tion
We obtained the apnea and hypopnea episodes from all study subjects, which amounted to 1591 RDs during NREM sleep and 280 RDs during REM sleep. Based on these RD data and the BP of each RD, we did multiple regression anal- yses with each of delta SBP and delta DBP being a depen- dent variable and with degree of arousal, lowest SaO2, and RD duration being independent variables. As shown in Table 4, variances of delta SBP and delta DBP were explained by degree of arousal and lowest SaO2 during both REM and NREM sleep, and these correlations were more significant during REM sleep (7.4% and 32.2% of delta SBP variance during NREM sleep and REM sleep, respectively, and 17.9%
and 28.9% of delta DBP variance during NREM sleep and REM sleep, respectively). When comparing partial correla-
1 140/95 121 25.8 0.98 14.7 79 6.5
2 130/75 158 34.0 1.01 79.2 79 55.7
3 120/70 105 22.4 1.01 37.8 76 6.1
4 120/85 134 29.6 1.00 10.8 83 1.3
5 130/80 120 26.4 1.01 37.9 60 30.4
6 110/75 135 29.0 1.02 22.1 78 2.7
7 120/75 129 27.9 0.99 14.9 80 2.6
8 120/85 117 25.8 0.94 58.6 74 37.6
9 140/95 111 24.3 0.99 52.2 77 38.3
10 125/65 121 26.0 1.04 16.0 85 1.3
Subj
No. BP %IBW BMI
(kg/m2) W/H
ratio RDI O2saturation Lowest % time<90%
Table 1.Characteristics of the subjects and results of poly- somnographic study
%IBW: weight/ideal body weight multiplied by 100. BMI: body mass index calculated as weight (kg)/(height (m))2 . W/H: waist circumference/
hip circumference. RDI (respiratory disturbance index): the total num- ber of apneas and hypopneas divided by total sleep time (hr). % time
<90%: % time when O2saturation was below 90% during total sleep time
1 86 97 115 18 106 121 15
2 67 81 95 14 110 133 23
3 50 61 72 11 63 81 18
4 77 85 96 11 92 107 15
5 65 74 90 16 70 93 23
6 65 76 88 12 76 102 26
7 70 73 88 15 74 91 17
8 78 85 104 19 91 105 14
9 73 86 110 24 91 100 9
10 64 68 87 19 76 86 10
Mean 69.5*,� 78.6*,� 94.5� 15.9 84.9�,� 101.9� 17 SD 9.83 10.34 12.56 4.16 15.56 15.84 5.62
Subj.
No. Baseline NREM Sleep REM Sleep
Pre- apneic
Post-
apneic Delta Pre- apneic
Post- apneic Delta Table 3.Comparison among baseline, pre-apneic, and post- apneic DBPs
Delta: Post-apneic DBP minus pre-apneic DBP. *p<0.05, �p<0.05,
�p<0.05, �p<0.05
1 136 148 171 23 165 197 32
2 123 137 154 17 168 190 22
3 110 129 152 23 132 159 27
4 113 129 143 14 141 162 21
5 117 132 156 24 132 164 32
6 99 111 123 12 112 141 29
7 120 129 150 21 131 156 25
8 128 145 162 17 152 165 13
9 131 148 173 25 158 169 11
10 117 123 148 25 136 146 10
Mean 119.4*,� 133.1*,� 153.2� 20.1 142.7�,� 164.9� 22.2 SD 10.82 11.75 14.34 4.75 17.7 17.4 8.36
Subj
No. Baseline NREM Sleep REM Sleep
Pre- apneic
Post-
apneic Delta Pre- apneic
Post- apneic Delta Table 2.Comparison among baseline, pre-apneic, and post- apneic SBPs
Delta: Post-apneic SBP minus pre-apneic SBP. *p<0.05, �p<0.05,
�p<0.05, �p<0.05
tions between degree of arousal and lowest SaO2, degree of arousal was more significantly correlated with delta SBP and delta DBP during both REM and NREM sleep.
DISCUSSION
In this study, finger BP was monitored to analyse noctur- nal BP reactivity in OSA. As BP changes along the vascular tree, the BP measured on finger with Finapres�differs from the BP measured on brachial artery. In addition, shift in fin- ger or body position during sleep may change the height of the finger in reference to the heart, changing measured BP value. Therefore, we fixed the finger position and limited data obtained from the supine body position for analysis. A beat-to-beat measurement of BPs using Finapres�provides more reliable data of relative BP changes than absolute val- ues and thus it suited well with our study aims.
Until now, there has been no consistency in defining degree of arousal. Rechtschaffen and Kales (17) described on move- ment arousal using changes in EMG, EOG, and EEG, and Bohnet et al. (18) suggested a guideline for EEG arousal.
Referring to these, Ringler et al. (21) divided arousal into 3 degrees. We assumed that the more finely we divided the degree of arousal, the more reliably we could establish rela- tionship between degree of arousal and other variables. Arous- al was divided into 4 degrees, based on the above-mentioned 3 papers.
Most studies on BP reactivity in OSA have been confined
to measurements during NREM sleep or only to a part of the whole night. This study observed BP reactivity during both NREM and REM sleep for the whole night. Pre-apne- ic BP was elevated compared with the baseline BP measured earlier in the evening. Post-apneic BP was further increased compared with pre-apneic BP. This pattern was observed both in NREM and REM sleep.
Multiple regression and partial correlation analyses showed that the degree of arousal was more influential in post-apne- ic BP elevation than the lowest SaO2and RD duration. These results were more prominent during REM sleep. We could easily explain it by the fact that many physiological variables change more dynamically during REM sleep than during NREM sleep.
Several studies have been done to explain post-apneic BP elevation. Using regression analysis, Shepard (22) suggested that hypoxemia could explain one third of BP elevation. Van Den Aardweg et al. (23) also argued that hypoxemia stimu- lated carotid body chemoreceptors, which caused vasocon- striction and BP elevation. On the contrary, Ali et al. (16) insisted that correction of hypoxemia with oxygen could not relieve BP elevations. Ringler et al. (21) found that even in hypoxemia, BP would not elevate without apnea. Davies et al. (19) stressed arousal and activation of the arousing-ori- ented reflex as the cause of post-apneic BP elevation. In their study, when arousal stimuli were given to normal subjects, BP was elevated in proportion to the degree of arousal. Our finding agrees with those supporting‘the arousal hypothe- sis’: the degree of arousal was most influential in BP eleva- tion. Sympathetic activation causing BP elevation could take place by an arousal response alone without hypoxemia.
Of interest and importance, we found that BP stayed ele- vated even between apnea episodes compared with BP dur- ing wakefulness. This finding could be explained as follows.
First, if another RD episode began before normalization of the prior post-apneic BP elevation, BP might be still elevat- ed. Second, more significantly, with repetitive arousal and hypoxia and consequent sympathetic stimulation, resetting of the baseline sympathetic tone might have occurred.
The mechanism by which nocturnal BP fluctuation would develop into daytime HT is not clear yet. Repetitive arousals during sleep (24) or nocturnal hypoxia (25, 26) are thought to be the culprits for daytime HT. In any event, post-apneic BP elevations should not be overlooked considering their impacts on cerebrovascular and cardiovascular systems (27).
The possibility of cardiovascular and cerebrovacular compli- cations of OSA may be increased, as the patients with OSA are under high BP for a significant time during sleep due to pre-apneic as well as post-apneic BP elevations. In addition to this sustained high BP, nocturnal BP fluctuations observed in OSA might have deleterious effects on vascular walls (14).
In this respect, preventing cardiovascular complications through early treatment of OSA is very important, and meth- ods should be developed to predict treatment effects depend-
NREM sleep
Delta SBP Arousal 1, 1590 0.063 0.252 < 0.01 Arousal 2, 1589 0.073 0.231 < 0.01
Min SaO2 -0.107 < 0.01
RD duration 0.013 0.616
Delta DBP Arousal 1, 1590 0.126 0.355 < 0.01 Arousal 2, 1589 0.179 0.320 < 0.01
Min SaO2 -0.246 < 0.01
RD duration -0.037 0.142
REM sleep
Delta SBP Arousal 1, 279 0.235 0.485 < 0.01 Arousal 2, 278 0.322 0.391 < 0.01
Min SaO2 -0.336 < 0.01
RD duration 0.100 0.97
Delta DBP Arousal 1, 279 0.237 0.486 < 0.01 Arousal 2, 278 0.289 0.406 < 0.01
Min SaO2 -0.262 < 0.01
RD duration -0.770 0.142
Predicted Parameter
Predictive
Measure Df R2
(p<0.01) Partial R p Table 4. Multiple regression analysis for delta SBP and delta DBP
RD: respiratory disturbance; SBP: systolic blood pressure; DBP: dias- tolic blood pressure; Delta SBP: post-apneic SBP minus pre-apneic SBP; Delta DBP: post-apneic DBP minus pre-apneic DBP; Min SaO2: lowest O2saturation during post-apneic 30 sec
ing on such characteristics of patients as age, obesity, and baseline BP.
In conclusion, the more significant correlation between delta BP and degree of arousal than hypoxemia suggests that sympathetic activation causing post-apneic BP elevation may result from an arousal response regardless of hypoxemia.
REFERENCES
1. Partinen M. Epidemiology of obstructive sleep apnea syndrome. Curr Opin Pulm Med 1995; 1: 482-7.
2. Fletcher EC. The relationship between systemic hypertension and obstructive sleep apnea: facts and theory. Am J Med 1995; 98: 118- 28.
3. Guilleminault C. Clinical features and evaluation of obstructive sleep apnea. In: Kryger MH, Roth T, Dement WC, ed. Principles and Prac- tice of Sleep Medicine. Philadelphia, W.B. Saunders Company 1994;
667-77.
4. Fletcher EC, DeBehnke RD, Lovoi MS, Gorin AB. Undiagnosed sleep apnea in patients with essential hypertension. Ann Intern Med 1985; 103: 190-5.
5. Jeong DU, Dimsdale JE. Sleep apnea and essential hypertension: a critical review of the epidemiological evidence for co-morbidity.
Clin Exper Hypertens [A] 1989; 11: 1301-23.
6. Kales A, Bixler EO, Cadieux RJ, Schneck DW, Shaw LC III, Locke TW, Vela-Bueno A, Soldatos CR. Sleep apnea in a hypertensive pop- ulation. Lancet 1984; 2: 1005-8.
7. Williams AJ, Houston D, Finberg S, Lam C, Kinney JL, Santiago S.
Sleep apnea syndrome and essential hypertension. Am J Cardiol 1985; 55: 1019-22.
8. Millman RP, Redline S, Carlisle CC, Assaf AR, Levinson PD. Day- time hypertension in obstructive sleep apnea. Chest 1991; 99: 861-6.
9. Suzuki M, Otsuka K, Guilleminault C. Long-term nasal continuous positive airway pressure administration can normalize hyperten- sions in obstructive sleep apnea patients. Sleep 1993; 16: 545-9.
10. Wilcox I, Grunstein RR, Hender JA, Doyle J, Collins FL, Fletcher PJ, Kelly DT, Sullivan CE. Effect of nasal continuous positive air- way pressure during sleep on 24-hr blood pressure in obstructive sleep apnea. Sleep 1993; 16: 539-44.
11. Shepard JW. Cardiorespiratory changes in obstructive sleep apnea.
In: Kryger MH, Roth T, Dement WC, ed. Principles and Practice of Sleep Medicine. Philadelphia, W.B. Saunders Company 1994; 657- 66.
12. Shepard JW Jr. Gas exchange and hemodynamics during sleep. Med Clin North Am 1985; 69: 1243-64.
13. Noda A, Okada T, Hayashi H, Yasuma F, Yokota M. 24-hr ambu- latory blood pressure variability in obstructive sleep apnea syndrome.
Chest 1993; 103: 1343-7.
14. Davies RJO, Crosby J, Vardi-Visy K, Clarke M, Stradling JR. Non- invasive beat to beat arterial blood pressure during non-REM sleep in obstructive sleep apnea and snoring. Thorax 1994; 49: 335-9.
15. McEvoy RD, Sharp DJ, Thornton AT. The effect of the sleeping posture on obstructive sleep apnea. Am Rev Respir Dis 1986; 133:
662-6.
16. Ali NJ, Davies RJ, Fleetham JA, Stradling JR. Periodic movements of the legs during sleep associated with rises in systemic blood pres- sure. Sleep 1991; 14: 163-5.
17. Rechtschaffen A and Kales A (eds). A Manual of Standardized Ter- minology, Technique, and Scoring System for Sleep Stages of Human Subjects. Los Angeles, BIS/BRI, UCLA 1968.
18. Bonnet M, Carley D, Carskadon M, Easton P, Guilleminault C, Harper Hayes B, Hirshkowitz M, Periklis K, Keenan S, Pressman M, Rothers T, Smith J, Walsh J, Weber S, Westbrook P. EEG arous- als: scoring rules and examples. A preliminary report from the Sleep Disorders Atlas Task Force of the American Sleep Disorders Asso- ciation. Sleep 1992; 15: 173-84.
19. Davies RJO, Belt PJ, Roberts SJ, Ali NJ, Stradling JR. Arterial blood pressure responses to graded transient arousal from sleep in normal humans. J Appl Physiol 1993; 74: 1123-30.
20. He J, Kryger MH, Zorick FJ, Conway W, Roth T. Mortality and apnea index in obstructive sleep apnea: experience in 385 male patients. Chest 1988; 94: 9-14.
21. Ringler J, Basner RC, Shannon R, Schwartzstein R, Manning H, Weinberger SE, Weiss JW. Hypoxemia alone does not explain blood pressure elevations after obstructive apneas. J Appl Physiol 1990;
69: 2143-8.
22. Shepard JW. Hemodynamics in obstructive sleep apnea. In: Fletcher EC, ed. Abnormalities of Respiration During Sleep. Orlando, FL:
Grume and Stratton 1986; 39-62.
23. Van Den Aardweg JG, Karemaker JM. Repetitive apneas induce periodic hypertension in normal subjects through hypoxia. J Appl Physiol 1992; 72: 821-7.
24. Loredo JS, Ziegler MG, Ancoli-Israel S, Clausen JL, Dimsdale JE.
Relationship of arousals from sleep to sympathetic nervous system activity and BP in obstructive sleep apnea. Chest 1999; 116: 655-9.
25. Peled N, Greenberg A, Pillar G, Zinder O, Levi N, Lavie P. Contri- butions of hypoxia and respiratory disturbance index to sympathetic activation and blood pressure in obstructive sleep apnea syndrome.
Am J Hypertens 1998; 11: 1284-9.
26. Brooks D, Horner RL, Kozar LF, Render-Teixeira CL, Phillipson EA. Obstructive sleep apnea as a cause of systemic hypertension.
Evidence from a canine model. J Clin Invest 1997; 99: 106-9.
27. Douglas NJ, Polo O. Pathogenesis of obstructive sleep apnea/hypo- pnea syndrome. Lancet 1994; 344: 653-5.