Fatigue Crack Localization Using Laser Nonlinear Wave Modulation Spectroscopy (LNWMS)
Peipei Liu*, Hoon Sohn*✝ and Tribikram Kundu**
Abstract Nonlinear features of ultrasonic waves are more sensitive to the presence of a fatigue crack than their linear counterparts are. For this reason, the use of nonlinear ultrasonic techniques to detect a fatigue crack at its early stage has been widely investigated. Of the different proposed techniques, laser nonlinear wave modulation spectroscopy (LNWMS) is unique because a pulse laser is used to exert a single broadband input and a noncontact measurement can be performed. Broadband excitation causes a nonlinear source to exhibit modulation at multiple spectral peaks owing to interactions among various input frequency components. A feature called maximum sideband peak count difference (MSPCD), which is extracted from the spectral plot, measures the degree of crack- induced material nonlinearity. First, the ratios of spectral peaks whose amplitudes are above a moving threshold to the total number of peaks are computed for spectral signals obtained from the pristine and the current state of a target structure. Then, the difference of these ratios are computed as a function of the moving threshold. Finally, the MSPCD is defined as the maximum difference between these ratios. The basic premise is that the MSPCD will increase as the nonlinearity of the material increases. This technique has been used successfully for localizing fatigue cracks in metallic plates.
Keywords: Fatigue Crack Localization, Nonlinear Wave Modulation Spectroscopy, Noncontact Laser Ultrasonics, Sideband Peak Count
[Received: November 3, 2014, Revised: December 15, 2014, Accepted: December 16, 2014] *Department of Civil and Environmental Engineering, Korea Advanced Institute of Science and Technology, Daejeon 305-701, Korea,
**Department of Civil Engineering and Engineering Mechanics, University of Arizona, Tucson, Az 85721, USA
✝Corresponding Author: hoonsohn@kaist.ac.kr
ⓒ 2014, Korean Society for Nondestructive Testing
1. Introduction
Structures with inhomogeneities or defects exhibit nonlinear behavior. In particular, strong nonlinear responses can be observed in structures with fatigue cracks. Nonlinear parameters are often more sensitive to fatigue cracks than their linear counterparts [1-3]. Nonlinearity due to crack formation manifests itself as distortion, accompanying wave harmonics, and in sum and difference frequency generation (sidebands). For linear intact structures, these nonlinear responses are weak, but they become remarkably strong for damaged structures [4-8].
Nonlinear wave modulation spectroscopy (NWMS) is one of the nonlinear ultrasonic techniques based on nonlinear mixing of two
distinct input signals [4]. Normally, a low-
frequency pumping input and a high-frequency
probing input are used in NWMS for creating
modulation. Here, the amplitude of modulation
heavily depends on the choice of the probing
and pumping frequencies, and the optimal
combination of these two input frequencies is
also affected by environmental and operational
conditions (e.g., temperature and loading) of the
target structure and even by defect configurtions
[7, 9-11]. Therefore, finding the optimal combin-
ation of the probing and pumping frequencies,
which can maximize the modulation level,
becomes a moving target. To find an optimal
combination of the probing and pumping
frequencies that can maximize the modulation
level, frequency-swept probing signals and a
frequency-fixed pumping signal are used [11].
Similarly, a first sideband spectrogram is created by sweeping both pumping and probing signals over specified frequency ranges to study the effect of pumping and probing frequencies [7].
On the other hand, a laser nonlinear wave modulation spectroscopy (LNWMS) utilizes a laser pulse as an input signal, instead of using two distinct frequency inputs, to excite multiple frequency components simultaneously into the target structure [12]. However, because of the broadband nature of the laser pulse input, no clear modulation frequency can be identified.
Instead, a fatigue crack is detected by counting the number of spectral peaks (Sideband Peak Count, SPC) above a moving threshold based on the premise that a spectral signal obtained from a nonlinear system would have more spectral peaks compared to a linear system [5]. Experi- mental test results obtained from simple plates and aircraft fitting-lugs demonstrate that an increased number of spectral peaks appear with fatigue crack formation.
This study advances SPC to localize a fatigue crack using LNWMS. The proposed damage localization technique offers the following advan- tages: (1) A pulse excitation input is used instead of two distinct sinusoidal inputs for the extrac- tion of nonlinear modulation responses; (2) A complete noncontact laser ultrasonic system is adopted for LNWMS measurement by inte- grating and synchronizing a Q-switched Nd:YAG laser for ultrasonic wave generation and a laser Doppler vibrometer for ultrasonic wave detec- tion; (3) SPC technique is improved for fatigue crack localization.
This paper is organized as follows. In section 2, the working principle of nonlinear wave mod- ulation was briefly reviewed and the proposed damage-sensitive feature, maximum sideband peak count difference (MSPCD) was described. Then, the experimental test is described in Section 3, and the proposed damage detection technique is
applied for localizing of actual fatigue cracks in aluminum plates in Section 4. Finally, the conclu- sion is provided in Section 5.
2. Theoretical Background
2.1 Laser Nonlinear Wave Modulation Spectro- scopy (LNWMS)
It is known that, when two waves having two different frequencies
and
(
<
) propagate through a nonlinear region of a plate- like structure in the z-direction, the solution for the total particle displacement
can be written as the summation of the linear response, harmonics and modulations (Fig. 1) as follows [9,10]:
(1)
where c.c stands for complex conjugate,
and
are the amplitudes of the linear waves at
and
,
and
are the amplitudes of the nonlinear harmonics at 2
and 2
, and
±is the amplitude of the modulation responses at
±
.
,
and
,
are the wavenumbers and phases corresponding to waves a and b, respectively. For simplicity, the higher-order harmonics and modulations are omitted.
In general, two binding conditions must be satisfied for creation of modulated waves [9,10]:
(1) Synchronism condition - Both the phase and
group velocities of the linear waves must match
with those of the modulated waves; and (2)
Non-zero power flux condition - The mode
shapes of the linear waves should be matched
with those of the modulated ones, ensuring
non-zero power transfer from the linear waves
to the modulated waves. These conditions can
Fig. 1 Illustration of nonlinear wave modulation using two distinct sinusoidal inputs, intact (top), damage (bottom)
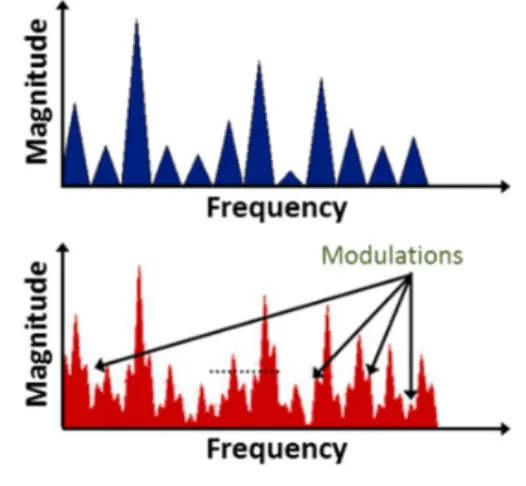
Fig. 2 Illustration of nonlinear wave modulation using a pulse input, intact (top), damage (bottom)
be applied to nonlinear harmonics when
and
.
In practice, it is challenging to find the optimal combination of two input frequencies, which satisfies all binding conditions. In order to tackle this issue, a broadband excitation was used instead of two distinct input frequencies as an input signal [5,12]. When a broadband pulse signal is used as the input signal, nonlinear wave modulation can occur among various frequency components of the input signal and
multiple frequency peaks are generated as shown in Fig. 2. In addition, some of the frequency peaks in Fig. 2 could have been the results of higher-order nonlinear modulations (cascade cross modulations) in presence of cracks [13]. In this paper, since the pulse signal will be provided by a noncontact laser ultrasonic system, this modified nonlinear wave modulation tech- nique is called laser nonlinear wave modulation spectroscopy (LNWMS).
2.2 Maximum Sideband Peak Count Difference (MSPCD)
To quantify the level of nonlinearity generated by a single pulse excitation, a side- band peak count (SPC) technique was proposed [5,12]. This technique does not count the dominant peaks but keeps track of the relatively weak peaks in the neighborhood of the strong peaks generated by the material nonlinearity and/or the anomalies in the material. Eiras et al. [5] discussed the variation of the sideband energy and sideband peak count for monitoring the aging process of Glass Fiber Reinforced Cement (GRC) using two PZT transducers for excitation and sensing. Liu et al. [12] extended the SPC technique for fatigue crack detection in metallic structures, including aircraft fitting-lugs with complex geometries. They all observed that a greater number of relatively stronger minor peaks appear as the degree of material non- linearity increases.
The SPC is defined as the ratio of the number of frequency peaks (
) over a moving threshold (
) to the total peak number (
) in the normalized frequency domain:
(2)
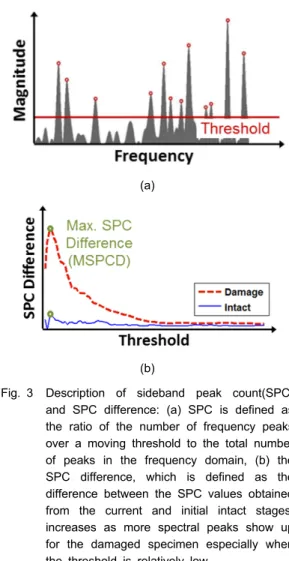
where all peaks are counted as shown in Fig.
3(a), including the dominant peaks as well as
(a)
(b)
Fig. 3 Description of sideband peak count(SPC) and SPC difference: (a) SPC is defined as the ratio of the number of frequency peaks over a moving threshold to the total number of peaks in the frequency domain, (b) the SPC difference, which is defined as the difference between the SPC values obtained from the current and initial intact stages, increases as more spectral peaks show up for the damaged specimen especially when the threshold is relatively low
the sideband peaks above the threshold. It is not necessary to separate the dominant peaks from the sideband peaks since the number of dom- inant peaks is negligible in comparison to the sideband peaks. Due to the nonlinearity induced by defects, more sideband peaks show up in the spectrum and consequently the sideband energy grows. Therefore, the SPC value for the damaged case should be larger than that for the intact case, especially when the threshold value is relatively low. Fig. 3(b) shows a representa- tive plot of SPC difference obtained from the later experiment presented in this study. Here, the SPC difference is defined as the difference
between the SPC values obtained from the current
and baseline
basestatuses.
The SPC difference is positive when there is a fatigue crack in the target specimen, and the maximum SPC difference (MSPCD) is obtained when the threshold value is relatively low. In this study, the MSPCD defined below is selected as the damage feature and used to localize a fatigue crack:
(3)
3. Experimental Setup
3.1 Description of Specimen and Fatigue Testing
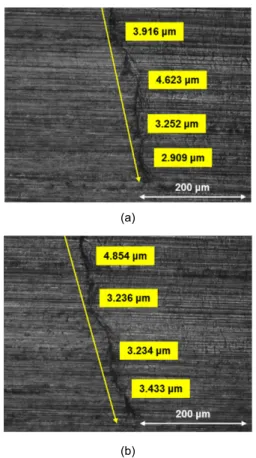
Two identical aluminum plate specimens were fabricated using 6061-T6 aluminum alloy, and a notch was introduced in the middle of one side of the specimen as shown in Fig. 4. A fatigue crack was introduced to each specimen using an INSTRON 8801 fatigue testing system. The specimens were tested under tension-tension cycling of a maximum load of 25 kN and a minimum load of 2.5 kN at a frequency of 10 Hz. 15 mm long cracks were produced to two specimens after 18793 and 20209 loading cycles, respectively. The widths of the fatigue cracks are less than 10 μm and even below 5 μm near the crack tips, as shown in Fig. 5. These cracks are hardly detectable using conventional linear ultrasonic techniques.
Fig. 4 Specimen dimensions, crack location, and laser excitation and sensing arrangement
Fig. 6 Schematic diagram of the noncontact laser ultrasonic system
(a)
(b)
Fig. 5 Microscopic images of fatigue cracks in aluminum specimens: (a) specimen I, (b) specimen II
3.2 Description of a Noncontact Laser Ultrasonic System
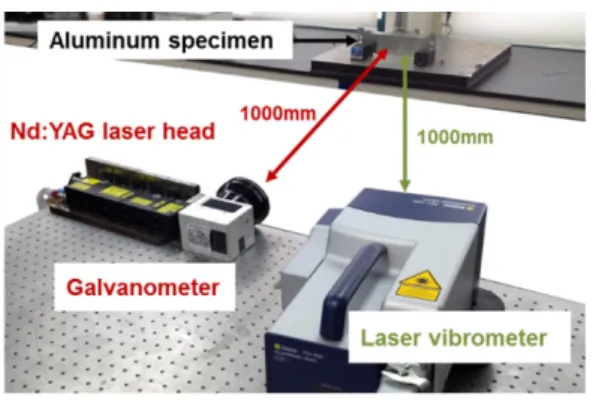
A complete noncontact laser ultrasonic system is used in this study for generation and sensing of ultrasonic waves [14]. As shown in Fig. 6, the excitation unit comprises a Q-switched Nd:YAG pulse laser, a galvanometer and a focal lens. The Nd:YAG laser has a wavelength of 1064 nm and a maximum peak power of 3.7 MW, and generates a pulse input with 8 ns pulse duration at a repetition rate of 20 Hz. Note that, although the available maximum peak power is 3.7 MW, a peak power of around 0.2 MW is used for the experiment in this study. Ultrasonic waves are created by the thermal expansion of an infinitesimal area heated by the laser. Using the galvanometer, the
laser pulse can be aimed at the desired target excitation points.
For the sensing unit, a commercial scanning LDV (Polytec PSV-400-M4) with a built-in galvanometer and an auto-focal lens is used. The laser source used for this LDV is a helium neon (He-Ne) laser with a wavelength of 633 nm.
This one-dimensional (1D) LDV measures the out-of-plane velocity in the range of 0.01 um/s to 10 m/s over a target surface based on the Doppler frequency-shift effect of light. In this experiment, each ultrasonic response is measured with a sampling frequency of 2.56 MHz for 25.6 ms, achieving frequency resolution close to 40 Hz.
The control unit consists of a personal computer(PC), controller, velocity decoder with a maximum velocity sensitivity of 1 mm/s/V and a 14-bit digitizer with a maximum sampling frequency of 5.12 MHz. The controller generates control signals to aim the excitation and sensing laser beams at the desired target positions. In addition, the controller sends out trigger signals to launch the excitation laser beam and to start the data collection simultaneously.
Fig. 7 shows the actual hardware compon-
ents used in this experiment. The distances
between the Nd:YAG laser head and the target
specimen and between LDV and the target
specimen are set to 1 m. To improve the signal
to noise ratio, the responses are measured 100
times and averaged in the time domain.
Fig. 7 Experimental setup using noncontact laser
ultrasonic system (a)
(b)
(c)
Fig. 8 Representative response signals from path 2 in specimen I: (a) time histories, (b) normalized frequency spectra, (c) close-up view of the frequency spectra
As shown in Fig. 4, six pairs of excitation and sensing laser beam points are selected to examine the localization capability of the proposed crack detection technique. For the intact condition of each specimen, ultrasonic responses were recorded three times from every path. One of them was used as the reference sig nal, and the other two as the test signals acquired from the intact case. To take into account variations caused by resetting of the measurement system and the specimen after fatigue test, the whole measurement system was reconfigured even for the intact case. After crack formation, ultrasonic signals were collected again following the same measurement procedure as the intact case.
4. Experimental Results
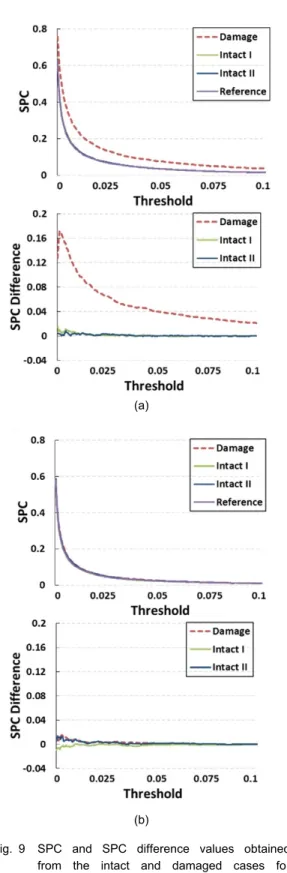
Representative ultrasonic responses obtained from path 2 of specimen I in both time and frequency domains are displayed in Fig. 8(a) and (b). The frequency content of the response signal spans up to 400 kHz. A close-up view of the frequency spectra is shown in Fig. 8(c) and it displays that more sideband peaks appear when the specimen is damaged. A frequency band of 20 kHz to 400 kHz is selected for calculating the MSPCD values. Fig. 9 shows the SPC value and its difference from the reference case obtained for the intact and damage cases of
specimen I. Fig. 9(a) shows the SPC and its
difference from path 2, which passes through
the crack tip. The maximum SPC difference
(MSPCD) reaches above 0.15 for the damage
case when the threshold is quite low (around
0.4% of the largest peak value in the frequency
(a)
(b)
Fig. 9 SPC and SPC difference values obtained from the intact and damaged cases for specimen I: (a) path 2 passing through the crack tip, (b) path 3 not passing through the crack
(a)
(b)
Fig. 10 MSPCD obtained using 0.2 MW peak power laser pulse excitation: (a) specimen I, (b) specimen II
domain). Fig. 9(b) shows the SPC and its diffe rence for path 3, which does not directly pass through the crack. Therefore, it can be seen that the MSPCD obtained from the damage case shows a much higher value compared to the intact cases when the propagating ultrasonic waves pass directly through the crack tip.
Therefore, a fatigue crack can be located based on this finding.
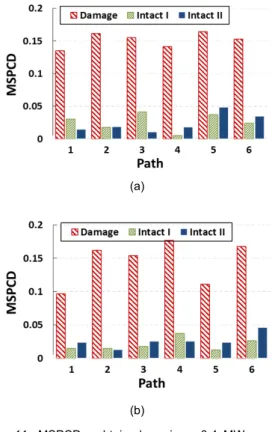
Fig. 10 shows the MSPCD values obtained
from all six paths in specimens I and II. It can
be clearly seen that the MSPCD value whose
path passes through the crack, especially at the
crack tip, is much higher than the others mainly
caused by the measurement noises and the
measurement system reconfiguration after each
fatigue test. Note that, in Liu et al. [12], the
MSPCD value significantly increased even when
the path did not pass through the crack. That is
(a)
(b)
Fig. 11 MSPCD obtained using 0.4 MW peak power laser pulse excitation: (a) specimen I, (b) specimen II