1. Introduction
The technology and internet created new windows of opportunities for customers and companies as well.
Customers are able to surf in domestic and global markets and purchase the product or service of their choice from their comfort of their homes, at a right time and at convenient price; and companies are able to promote their
* Corresponding author, Fatos Ukaj, Associate Professor, Faculty of Economy, University of Prishtina "Hasan Prishtina", Kosovo.
Tel: +383-4413-9106, Email: [email protected].
** Author, Vjosa Mullatahiri, Faculty of Economy, University of Prishtina
"Hasan Prishtina", Kosovo.
Tel: +383-44-43-1246, Email: [email protected]
© Copyright: Korean Distribution Science Association (KODISA)
This is an Open Access article distributed under the terms of the Creative Commons Attribution Non-Commercial License (https://creativecommons.org/licenses/by-nc/4.0/) which permits unrestricted non-commercial use, distribution, and reproduction in any medium, provided the original work is properly cited.
products and compete in global markets only by using internet platforms and mobile phone.
Internet and technology have changed the dynamics of marketing by putting customers in charge, and making companies more fragile (Wind & Mahajan, 2000). Therefore, making use of internet and mobile technology to conduct marketing for reaching new customers and building brand loyalty is a prerequisite for companies that want to stay in business (Cemal, Sahin, Kitapci, & Ozsahin, 2011; Mullatahiri
& Ukaj, 2019). In highly competitive industry such as telecommunication industry it is essential to building long-term relationship with customers (Wind & Mahajan, 2000; Lee, James, & Kim, 2014), create competitive advantage through service quality (Aydin & Ozer, 2005;
Calvin, 2016) and build brand trust (Aydin & Ozer, 2005;
Cemal, Sahin, Kitapci, & Ozsahin, 2011; Chinomona, Mahlangu, & Pooe, 2013; Tabaku & Çerri, 2015) to achieve brand loyalty (Baba & Majeed, 2018; Poku, Ansah, &
Print ISSN: 1738-3110 / Online ISSN 2093-7717
http://dx.doi.org/10.15722/jds.17.10.201910.27
The Relationships among Service Quality and e-Marketing with Trust and Loyalty to Brands of Mobile Telephone Operators in Kosovo
Fatos UKAJ
*, Vjosa MULLATAHIRI
**Received: August 21, 2019. Revised: September 09, 2019. Accepted: October 05, 2019.
Abstract
Purpose - This study explores the relationships between e-Marketing and perceived service quality with brand trust and loyalty towards the brand of mobile telephone operators in Kosovo.
Research design, data, and methodology - The conceptual model of four constructs was developed, while each construct consisted of the set of variables measured by using five-point Likert scale. The primary data was collected via an online survey through SurveyMonkey, distributed via Facebook and email. The collected data were cleaned, validated and tested for its consistency through Cronbach's Alpha; ensured that five assumptions of multiple linear regression are met. To assess the relationships between outcome variable and dependent variables of the model, performed the bivariate correlation, simple, multiple linear and hierarchical regression.
Results - Perceived service quality has a positive significant effect on brand trust and loyalty. e-Marketing presents moderating direct effect on brand loyalty, and slightly higher effect through brand trust of the mobile telephone operators in Kosovo.
Conclusions - The perceived service quality and brand trust are key determinants in achieving brand loyalty in telecommunication industry, followed by e-Marketing as means to creating expectations, delivering on promise to meet customers' perceptions for service quality with a purpose of building trust, that leads to loyalty towards the brands of mobile operators in Kosovo.
Keywords: Service Quality, e-Marketing, Brand Loyalty, Brand Trust, Mobile Operators, Kosovo.
JEL Classifications: M30; M31; M37.
Lamptey, 2014; Rajeswari, Srinivasulu, & Thiyagarajan, 2017).
According to World Bank report, the internet penetration in Kosovo's population is 79.9%, which compared to countries in the region such as Albania (73.5%), Montenegro (71.3%), North Macedonia (76.3%) and Serbia (72.4%), is the highest.
However, the Regulatory Authority of Electronic and Postal Communication (RAEPC) in Kosovo, reported even higher figures, with broadband internet penetration in population of 101% and mobile phone use of 106.3% of population.
Hence, having a mobile phone and an internet connection has become necessity for people around the world and Kosovo as well.
Given high rates of internet and mobile technology penetration in Kosovo's population, which changed the ways how companies are reaching their customers, and made customers more demanding towards the firms, it is essential to explore the relations between e-Marketing and service quality with brand trust and loyalty towards the brands in the service industry in general and mobile telephone operators in particular, since no prior studies of this nature were found.
1.1. Research aim and objectives
The aim of this study is to assess the relationships of e-Marketing and service quality with brand trust and loyalty of customers towards brands of mobile operators in Kosovo.
The study will contribute to complementing the existing literature related to the impact of the e-Marketing and perceived services quality as determinant to brand loyalty;
including their role on brand trust, as well as its mediating effect in brand loyalty.
2. Literature Review 2.1. e-Marketing
The changes in the business environment have triggered changes in marketing practices. Over the years the marketing evolved from product-oriented marketing (Marketing 1.0) focused more production and aggressive sales to customer centered marketing (Marketing 2.0) which focuses addressing the needs of customers. However, the customer was passive recipient of the promotional message (Skorbich
& Kot, 2018).
However, new technology developments and the globalization introduced new perspectives of doing marketing.
Computers, smartphones, internet and online platformes, enabled interaction between individuals and groups of customers (Hamill, 2016 cited in Skorbich & Kot, 2018) by allowing them to share their opinions, experiences and ideas in real time and empowering them to play a proactive role in all marketing functions. Hence, lifting marketing to Marketing 3.0, taking into consideration customers needs,
aspirations, values and emotions (Kotler, Kartajaya, Setiawan, 2010 cited in Skorbich & Kot, 2018).
As indicated by Chaffey (2013 cited in Bala & Verma, 2018) e-Marketing utilizes digital technologies for achieving marketing objectives and conducting marketing activities to match customer needs and offering value for customers, whilst emphasizing the role of 4P's model as basis of marketing planning in virtual world (Chaffey, 2000, cited in Constantinides, 2002). However, 4P's of e-marketing are interrelated, influencing customer's perception about online service and the company (Constantinides, 2002).
Wind and Mahajan (2000) stated that digital revolution has changed marketing dynamics and customers' behavior:
they can co-produce the products as per their needs, propose their own prices, conclude the purchase themselves, create their own promotion message, play the role of a digital agent for the company, which created new opportunities for marketers and companies (Bala & Verma, 2018). Hence, companies need to find new marketing approaches to attain new customers (Wind & Mahajan, 2000; Bala & Verma, 2018) build loyalty towards brands (Mullatahiri & Ukaj, 2019), and redesign marketing strategies from seller-centric to customer-centric (Wind & Rangaswamy, 2001) where customers and suppliers are considered as true partners (Senkus, 2013 cited in Skorbich & Kot, 2018).
The technology and internet are used by both, customers to find offerings with more value for them and companies to identify needs, communicate and deliver value for customers at a lower cost. Digitalization and internet have shifted marketing from mass customization that is IT intensive in production side, to customerization that is IT intensive on the marketing side (Wind & Mahajan, 2000; Bala & Verma, 2018).
Moreover, internet and social media, empowered customers' produce and consume their own news, hence enhancing their engagement with brand and increasing customer trust and loyalty (Erdogmus & Çiçek, 2012;
Lawrence, Fournier, & Brunel, 2013; Mullatahiri & Ukaj, 2019).
Nowadays, customers' lives are more dynamic than ever, thus they prefer user friendly procedures to purchase or market. e-Marketing enabled them to pick their desired products or utilize needed services from the comfort of their home, whilst recalling their purchase experience for their future reference (McKee, 2010 cited in Khan & Islam, 2017).
Nonetheless, if during the purchasing procedure, customers experience distraction, they will not be loyal (Leggatt, 2010, cited in Khan & Islam, 2017), whilst looking for other companies that fulfill their need.
Different authors who studied the effects of marketing communication (Mullatahiri & Ukaj, 2019) and individual elements of mix including the effects of email marketing (Merisavo & Raulas, 2004), social media marketing (Erdogmus & Çiçek, 2012; Geçti & Gumus, 2014; Tatar &
Erdogmus, 2016), online communities (Zafir, 2013) observed
positive effects of each element of e-marketing into brand
image, brand trust, customer satisfaction and brand loyalty.
2.2. Service quality
Service quality is a key determinant of customer retention and loyalty (Aydin & Ozer, 2005; Cemal, Sahin, Kitapci, &
Ozsahin, 2011; Tabaku & Çerri, 2015; Calvin, 2016). Service quality is focused evaluation reflecting customers' perception while comparing the expected services with the perceived services received (Gronroos, 1984; Parasuraman, Zeithaml,
& Berry, 1985; Cemal, Sahin, Kitapci, & Ozsahin, 2011).
Similar to Zeithaml (1988, cited in Aydin & Ozer, 2005;
Kungumapriya & Malarmathi, 2018) this study will assume that service quality infers "the customer's judgment about the service superiority and excellence".
Services are intangible (Kotler, 2012 cited Hafez & Akther, 2017; Aydin & Ozer, 2005; Yarimoglu, 2014) cannot be tested or stored (Parasuraman, Zeithaml, & Berry, 1985) and the production and the consumption take place simultaneously (Gronroos, 1984), thus their performance varies upon service provider and customer perceptions (Aydin &
Ozer, 2005) for the expected quality (Gronroos, 1984).
If the expected service quality, is in the same level as perceived service quality, it will result with customer satisfaction (Gronroos, 1984; Parasuraman, Zeithaml, & Berry, 1985; Loke, Taiwo, Salim, & Downe, 2011; Chang & Chong, 2011; Nawaz & Usman, 2011; Tabaku & Çerri, 2015;
Ramadai, Theresia, & Sadalia, 2018), that will influence customer trust (Aydin & Ozer, 2005; Chinomona, Mahlangu,
& Pooe, 2013; Cemal, Sahin, Kitapci, & Ozsahin, 2011;
Sheikh, Sheikh, & Rizwan, 2014; Zafir, 2013) and customers' loyalty towards the brand (Aydin & Ozer, 2005; Chang &
Chong, 2011; Nawaz & Usman, 2011; Amin, Ahmad, & Hui, 2012; Agyei & Kilika, 2013; Poku, Ansah, & Lamptey, 2014;
Tabaku & Çerri, 2015; Rajeswari, Srinivasulu, & Thiyagarajan, 2017; Izogo, 2017; Ramadai, Theresia, & Sadalia, 2018).
2.3. Trust
Trust is key determinant for brand loyalty, because it reduces customers' uncertainty when facing offering from different brands, since the offering from known brands are considered more reliable (Aydin & Ozer, 2005). Trust occurs when two or more parties in the transaction believe and expect that the actions of the other party would result with positive outcome of themselves (Deutch 1958, cited in Zafir, 2013; Anderson & Narus 1990; cited in Aydin and Ozer 2005), and is regarded as customers' willingness to revisit brand offerings regularly (Tatar & Erdogmus, 2016).
Brand trust facilitates the relationships between consumers and brand, is a "substitute for human contact between brands and customers (Zehir et al., 2011, cited in Chinomona, Mahlangu, & Pooe, 2013; Anik & Putri, 2015).
Hence, companies in service sector including telecom use different marketing techniques to create loyalty programs, to satisfy customer needs and build customer trust (Wind &
Mahajan, 2000; Rajeswari, Srinivasulu, & Thiyagarajan,
2017), in order to encourage repeated purchase (Aydin &
Ozer, 2005; Chinomona, Mahlangu, & Pooe, 2013; Anik &
Putri, 2015; Ikramuddin, Adam, Sofyan, & Faisal, 2018) Internet and technology influenced creation of "global brands" and trust-based marketing, which enables companies to compete in global markets. Buying online has its advantages while customers can buy from their comfort of their home, nevertheless has its disadvantage since customers cannot touch or evaluate the product. Consequently, the customers have a tendency to purchase from trusted brands (Wind & Mahajan, 2000) that represent accountability and commitment (Nawaz & Usman, 2011) while expecting service quality (Gronroos, 1984; Aydin & Ozer, 2005).
Studies of many authors, although conducted in different countries and industries, confirmed the same findings that trust has significant positive effect on brand loyalty (Aydin &
Ozer, 2005; Nawaz & Usman, 2011; Sarwar, Abbasi, &
Pervaiz, 2012; Amin, Ahmad, & Hui, 2012; Sarwar, Abbasi,
& Pervaiz, 2012; Chinomona, Mahlangu, & Pooe, 2013; Anik
& Putri, 2015; Tatar & Erdogmus, 2016; Ikramuddin, Adam, Sofyan, & Faisal, 2018)
2.4. Brand Loyalty
The rapid changes in the business environment necessitate changes in marketing approach for building strong brands as ambassadors to entering new markets (Sarwar, Abbasi, & Pervaiz, 2012) and creating perception for service quality and building customer trust (Gronroos, 1984; Cemal, Sahin, Kitapci, & Ozsahin, 2011; Tatar &
Erdogmus, 2016), whilst creating the base of loyal customers (Khan & Islam, 2017). The brand is defined as a promise from company to customer, to deliver offerings on their benefit and assuring positive experiences, whilst assuming their loyalty (Keller, 2009; Lee, James, & Kim, 2014).
Brand loyalty implies customers' willingness to pay higher price for the same product group and consistently purchase from the same brand (Oliver, 1999; Webster Jr., 2000;
Aaker & Jacobson, 2001; Aydin & Ozer, 2005; Chinomona, Mahlangu, & Pooe, 2013), resulting with increased revenues and larger market share, and more profitability for the company (Aaker & Jacobson, 2001; Keller, 2009; Cemal, Sahin, Kitapci, & Ozsahin, 2011).
In highly competitive industry such as telecommunication, brand loyalty is key asset that helps companies differentiate their services, reduce the marketing cost of acquiring new customers (Keller, 2009; Aaker & Jacobson, 2001; Anik &
Putri, 2015), and create competitive advantage over their competition (Mellens, Dekimpe, & Steenkamp, 1996; Cemal, Sahin, Kitapci, & Ozsahin, 2011).
Given the importance of brand loyalty to stand out from
harsh competition, many authors have studied factors
influencing brand loyalty in different sectors especially
service sector. Although studies were undertaken in different
situations and countries, all report significant positive
relationship between brand loyalty and one or more dimensions of the service quality (Chang & Chong, 2011;
Nawaz & Usman, 2011; Hassan, Malik, & Faiz, 2012; Amin, Ahmad, & Hui, 2012; Agyei & Kilika, 2013; Poku, Ansah, &
Lamptey, 2014; Tabaku & Çerri, 2015; Khizindar, Al-Azzam,
& Khanfar, 2015; Izogo, 2017) (Rajeswari, Srinivasulu, &
Thiyagarajan, 2017; Baba & Majeed, 2018; Ramadai, Theresia, & Sadalia, 2018). However Pollack reported that the significance of various service quality dimensions differ depending on given service (Pollack, 2009) and service provider (Aydin & Ozer, 2005)
Many authors have found positive significant relationship between brand loyalty and trust in brands of telecom providers or mobile operators (Aydin & Ozer, 2005; Amin, Ahmad, & Hui, 2012; Sarwar, Abbasi, & Pervaiz, 2012;
Chinomona, Mahlangu, & Pooe, 2013; Sheikh, Sheikh, &
Rizwan, 2014). But, Nawaz and Usman (2011) and Hafez and Akther (2017) in their studies of telecom industry in Pakistan respectively in Bangladesh, found a degree of the positive relationship between brand loyalty and trust, but not as significant as service quality.
3. Hypotheses and Research model
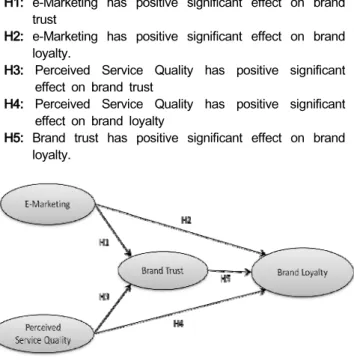
The hypotheses were established, and conceptual model was developed upon literature review. The conceptual model was presented in the Figure 1. which indicates the relations between four constructs, and the arrows point out the path of the effect.
H1: e-Marketing has positive significant effect on brand trust
H2: e-Marketing has positive significant effect on brand loyalty.
H3: Perceived Service Quality has positive significant effect on brand trust
H4: Perceived Service Quality has positive significant effect on brand loyalty
H5: Brand trust has positive significant effect on brand loyalty.
Figure 1. Conceptual Model
4. Methodology and Summary Statistics
The primary data was collected via online survey with the subscribers’ mobile telephone operators in Kosovo. From broader research of doctoral studies, was drawn a conceptual model comprised of four constructs. Variables of each construct were measured by using five-point Likert scale. The construct for e-Marketing was measured through 24 items spread throughout four P's of marketing mix (Wind
& Mahajan, 2000; Constantinides, 2002; Alnaser & Al Shibly, 2016; Lovett & Staelin, 2016; Bala & Verma, 2018), including Product (four items), Price (five items), Place (four items) and Promotions (11 items) (Mullatahiri & Ukaj, 2019). The six items that measure service quality were adapted from previous studies (Aydin & Ozer, 2005; Tabaku & Çerri, 2015;
Cemal, Sahin, Kitapci, & Ozsahin, 2011; Tabaku & Çerri, 2015), which were confirmed if they are valid and reliable to measure ServQual. Brand trust was measured with four indicators and brand loyalty with six indicators adapted from (Aydin & Ozer, 2005; Cemal, Sahin, Kitapci, & Ozsahin, 2011;
Ganiyu, Uche, & Elizabeth, 2012; Tabaku & Çerri, 2015; Izogo, 2017). The items of four constructs were validated and their reliability to measure intended variable was confirmed.
4.1. Data Collection
A self-administered questionnaire developed by Survey Monkey was distributed through Facebook application and via email to subscribers of mobile operators in Kosovo. A questionnaire consisted of 80 questions divided in 12 general questions and statements measuring 12 constructs.
However, for purpose of this study were considered seven constructs including four Ps of e-Marketing, perceived service quality, brand trust and brand loyalty. Whilst the relationship between other constructs (i.e. e-Marketing Communication, customer satisfaction, brand image and brand loyalty) were elaborated and presented in the previous studies of the Corresponding Author and Autor (2019). The questionnaire consisted of two control points: 1) the respondent had to be subscriber of at least one mobile telephone operator in Kosovo; 2) the respondent had to choose only one mobile telephone provider as most preferred.
If, the respondent replied "No" respectively "Neither" to either questions, the survey was not taken into consideration.
Thus, from 564 filled questionnaires, only 75% (423) were considered complete for further analysis. The collected data were coded, cleared and analyzed with SPSS Version 21.
4.2. Data Analysis and Results
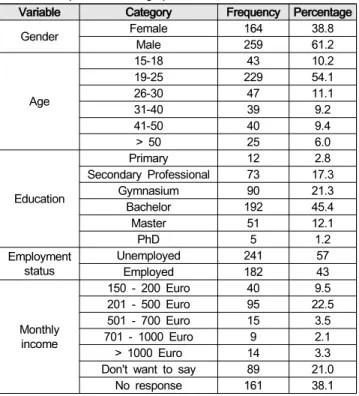
Out of 423 respondents who completed questionnaires and used at least one mobile operator, 47% were subscribed with Vala, 47.7% with IPKO, 14.4% with Z-Mobile; and 9.1%
of respondents were using two or more mobile telephone
operators. The respondent demographics is presented in the
Table 1.
Table 1. Respondent Demographics
Variable Category Frequency Percentage
Gender Female 164 38.8
Male 259 61.2
Age
15-18 43 10.2
19-25 229 54.1
26-30 47 11.1
31-40 39 9.2
41-50 40 9.4
> 50 25 6.0
Education
Primary 12 2.8
Secondary Professional 73 17.3
Gymnasium 90 21.3
Bachelor 192 45.4
Master 51 12.1
PhD 5 1.2
Employment
status Unemployed 241 57
Employed 182 43
Monthly income
150 - 200 Euro 40 9.5
201 - 500 Euro 95 22.5
501 - 700 Euro 15 3.5
701 - 1000 Euro 9 2.1
> 1000 Euro 14 3.3
Don't want to say 89 21.0
No response 161 38.1
To ensure that responses related to four constructs of the research model, reflect subscribers' opinion for one operator,
the respondents were asked to select one preferred operator.
The results show that 45.4% of respondents preferred IPKO, 40.9% preferred Vala, and 13.7% preferred Z-mobile.
The results from the descriptive analysis, show that respondents' perception for e-Marketing performance of telephone mobile operators generally is good, with mean value for e-Marketing (4Ps) of 3.67. The mean value of 3.99 for perceived service quality also is very high, however there is a gap of 1.01 between the expected service and customers' perception for service quality. The mean value for brand trust (4.12) indicates that customers trust their preferred brands deliver on their promise and that brand is more reliable compared to other brands. The high mean value of brand trust is reflected in the brand loyalty whereas the respondents shown high loyalty towards their preferred brand with mean value of 4.06.
To reduce the measurement errors, the validity and reliability test were performed through correlation analysis among all item scales and summated scales (average) of the construct. The validity tests confirmed that the collected data for e-marketing (4Ps), perceived service quality, brand trust and loyalty are valid. To assess the degree of internal consistency and reliability between the items within four constructs of the model, the Cronbach's alpha was performed. According to Ghozali (2006, cited in Ramadai, Theresia, & Sadalia, 2018) for results to be reliable the coefficient Cronbach's alpha scale of .70 is required.
Table 2. Validity and Reliability test for items and the constructs
e-Marketing (4P) The construct of the conceptual model
Dimension Construct Variables Validity Test Cronbach Alpha (α) Dimension Construct Variables Validity Test Cronbach Alpha (α) Product
eM01 .782**
0.749 e-Marketing (4P)
Promotion .775**
0.841
eM02 .723** Product .799**
eM03 .796** Price .851**
eM04 .719** Place .861**
Promotion
eM05 .722**
0.865
Service quality
SC1 .803**
0.904
eM06 .751** SC2 .820**
eM07 .650** SC3 .783**
eM08 .692** SC4 .868**
eM09 .679** SC5 .815**
eM10 .528** SC6 .842**
eM11 .509**
Loyalty
BL1 .777**
0.897
eM12 .737** BL2 .848**
eM13 .715** BL3 .829**
eM14 .695** BL4 .776**
eM15 .589** BL5 .824**
Price/Online buying
eM16 .752**
0.737
BL6 .859**
eM17 .661**
Trust
TR1 .869**
0.920
eM18 .774** TR2 .875**
eM19 .785** TR3 .859**
eM20 .497** TR4 .867**
Place
eM21 .811**
0.798
**. Correlation is significant at the 0.01 level (2-tailed).
eM22 .799**
eM23 .738**
eM24 .810**
**. Correlation is significant at the 0.01 level (2-tailed).
The results presented in the Table 2., point out validity and consistency within the entire scale for every dimension or construct. The items within the construct are highly correlated, and the Cronbach's Alpha for e-Marketing is .841, perceived service quality (.904) and brand trust (.920) presenting high internal consistency of items within the construct. Detailed explanation on the variables used for each construct are presented in Annex1.
As suggested by many authors, to be able to conduct multiple linear regression, a set of assumptions need to be met (Hair Jr., Black, Babin, & Anderson, 2014; Osborne &
Waters, 2002; Harrison, 2018). In this regard to confirm five assumptions, were conducted tests with two constructs of the model (e-Marketing and perception of service quality) as
predictors or independent variables (IV), against brand loyalty as dependent variable (DV), and brand trust having the mediating role.
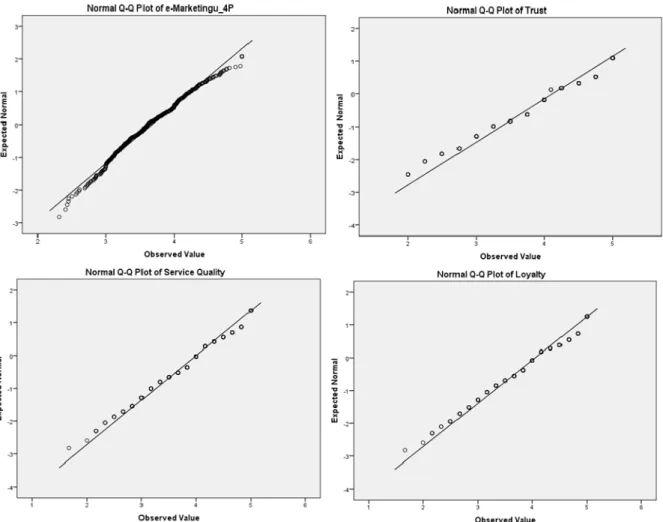
Assumption 1. The relationship between the IVs and the DV is linear and there are no outliers - was tested by using Normal Q-Q Plot for all constructs of the model. The plots show that the assumptions have been met.
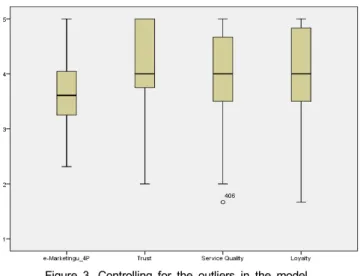
The model has one outlier that appeared in service quality in the record 406. The outlier is not extreme; hence it did not impact the results when it was removed and it was not desirable to remove the outliers that were considered not to affect the results (Osborne & Waters, 2002).
Figure 2. Norma Q-Q plots for four constructs of the model
Figure 3. Controlling for the outliers in the model
Assumption 2. There is no multicollinearity in your data - requires that predictors are not highly correlated with one another, not to exceed scale of .80. In case the correlation is high, one predictor should be dropped (Harrison, 2018).
The results of the simple linear regression confirm the assumption given that the correlation between two predictors (IV), e-Marketing and perceived service quality is .613.
Whereas, the correlation between trust as mediator and perceived service quality as predictor is a bit high .788,
however is within acceptable limits.
Table 3. Correlation between Independent Variables (IV)
Model e-Marketing Trust Perceived Service Quality
Loyalty (DV) .582 .806 .821
e-Marketing (IV) 1.000 .573 .613
Perceived Service Quality (IV) .613 .788 1.000 Trust (DV -Mediator) .573 1.000 .788
This assumption can be tested through Collinearity Statistics as well, deriving from the Coefficients' table.
According to Harrison (2018), to confirm this assumption, the Variance Inflation Factor (VIF) score has be below 10 and Tolerance should be above 0.2. From the results in the Table 4. once again is confirmed that the assumption 2. is met.
Assumption 3. The values of the residuals are independent - requires that the Durbin-Watson Statistics scale to be close to 2. If, values are below 1 or above 3, the analysis maybe considered invalid (Harrison, 2018). As indicated in the Table 5. the result of the test confirm that the assumption.
Table 4. Collinearity Statistics
Coefficients a Model Dependent
Variable Predictors
Unstandardized
Coefficients Standardize
Coefficients t Sig.
Collinearity Statistics
B Std. Error β Tolerance VIF
1 Trust
(Constant) .510 .153 3.327 .001
e-Marketing .192 .050 .143 3.831 .000 .624 1.603
Perceived Service Quality .727 .039 .700 18.705 .000 .624 1.603
2 Loyalty
(Constant) .381 .141 2.707 .007
e-Marketing .166 .046 .125 3.606 .000 .624 1.603
Perceived Service Quality .766 .036 .745 21.459 .000 .624 1.603
3 Loyalty
(Constant) .177 .129 1.379 .169
Perceived Service Quality .475 .044 .462 10.910 .000 .340 2.939
Trust (mediator) .400 .040 .404 9.902 .000 .367 2.727
e-Marketing .089 .042 .067 2.113 .035 .603 1.659
Table 5. Independent Residuals
Model Summary b
Model Dependent Variable R R Square Adjusted R Square Std. Error of the Estimate Durbin-Watson
Model 1. Trust .796a .633 .632 0.464 1.920
Model 2. Loyalty .827a .684 .683 0.427 2.002
a. Predictors: (Constant), Service Quality, e-Marketing_4P
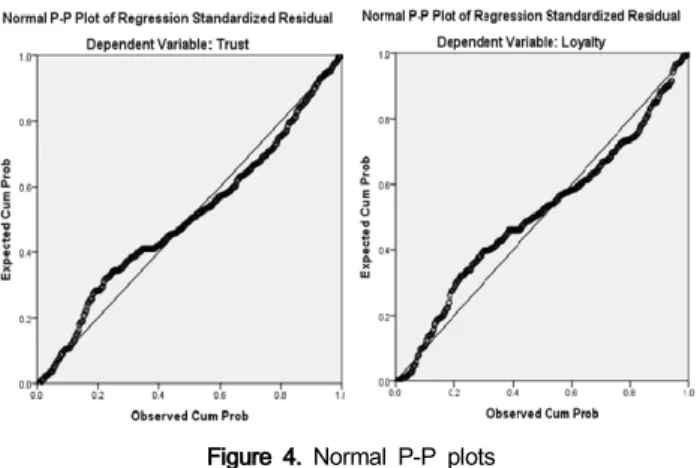
Assumption 4. The values of the residuals are normally distributed - was tested by looking the Normal P-P plots of the regression. As it is presented in the Figure 4. the model suggests that the assumptions of the normality was not entirely met. However, considering there are over 400 respondents and no extreme deviations from normality (Hair Jr., Black, Babin, & Anderson, 2014), the results are considered valid.
Figure 4. Normal P-P plots
Assumption 5. There are no influential cases biasing the model - was tested through Cook's Distance values, which requires that values for each record in database, not exceeding value 1. Should the value be higher, it indicates the presence of the extreme outliers that may influence the model (Harrison, 2018). The results from the analysis confirm that Cook's Distance value for all records in the database was lower than 1. Hence confirming the fifth assumption.
4.3. Testing Model Fit
To test model fit was performed multi linear regression and hierarchical multiple regression. The results from the analysis indicate that Model 2. significantly predicts brand trust with F(2,420)= 362,688, p= .000), with R
2of .633, indicating that 63.3% of variances in the brand trust can be explained by both predictors (e-Marketing and perceived service quality); and Model 3. significantly predicts that variances in Brand Loyalty can be explained by predictors with F(2,420)= 455.596, p= .000), with R
2of .684, indicating that 68.4% of variances in the brand loyalty can be explained by two predictors.
Moreover, Model 4 comprised of three predictors (e-Marketing, Perceive service quality and Trust) more significantly predicts the outcome variable (brand loyalty), with F(3,419)=406.596, p= .000) with R
2of .744, indicating that 74.4% of variance in brand loyalty is explained by e-Marketing and perceived service quality (IV) and brand trust (as mediating variable); with perceived service quality having the highest contribution t(1,421)=10,910, p= .000,
followed by brand trust t(2,420)=9,902, p= .000 and e-Marketing communication t(3,419)=2,113, p= .035.
The Adjusted R
2, for three models is close to R
2suggesting that, if, models derive from the entire population, then 63.2% of variations in the Brand Trust and 68.3% of variation in the Brand Loyalty can be accounted from the two predictor variables. Whereas, 74,2% of variation in the Brand Loyalty can be accounted from two predictor variables and mediating variable Brand Trust.
Hence, results from the Table 6. confirm that the conceptual model presented in the Figure 1. is good model fit for further analysis, since F-ratio > 1, and p < .05 (Uyanik & Guler, 2013; Nimon & Oswald, 2013), wherein Model 2. enables to predict the mediating variable (brand trust), and Model 4. significantly improves our ability to predict the outcome variable brand loyalty, where the mediating variable is influenced by two predictor variables.
Table 6. Model Fit Testing Model Predictors Dependent
Variable R R² Adjusted R² F Value Sig.
1 Perceived
Service Quality Trust .788a.620 .620 688.329 .000b 2 e-Marketing
Perceived
Service Quality Trust .796a.633 .632 362.688 .000b 3 e-Marketing
Perceived Service Quality
Brand
Loyalty .827a.684 .683 455.596 .000b 4
e-Marketing Perceived Service Quality
Trust
Brand
Loyalty .863b.744 .742 406.596 .000c
4.4. Hypothesis Testing
To test the hypothesis, the standardized coefficients (β), un-standardized coefficients, and t value of the variables with level of significance of 0.05, were calculated. In case when the significance level of t value is lower than set level of significance (.05), it indicates that β≠0, hence confirming statistically significant results (Uyanik & Guler, 2013; Nimon
& Oswald, 2013).
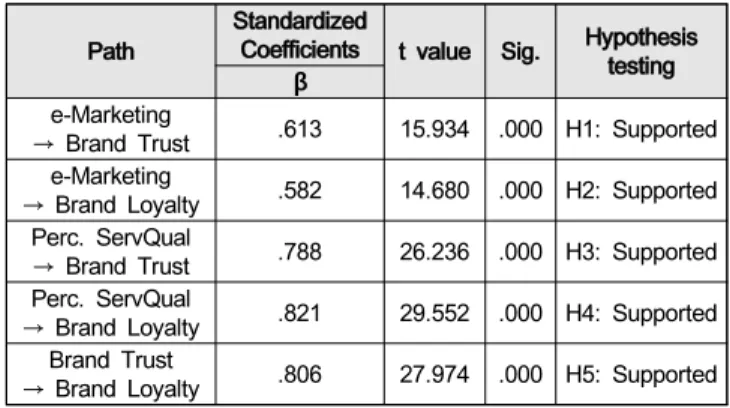
In this regard, the standardized coefficients deriving from the simple linear regression, point out that e-Marketing has significant positive effect on brand trust β= .613, t(1,421)=
15.934, p= .000; significant positive effect on brand loyalty, β= .582, t(1,421) = 14.680, p= .000. Likewise the perceived service quality has positive significant effect on brand trust β
= .788, t(1,421)= 26.236, p= .000, and brand loyalty β=
.821, t(1,421)= 29.552, p= .000, which is higher compared to effects of e-Marketing in both constructs. This indicates that perceived service quality has higher importance in achieving brand trust and loyalty compared to e-Marketing.
The results also point out positive significant effect of
brand trust β= .806, t(1,421)= 27.974, p= .000, on brand
loyalty that compared to the effects other variables is very high.
Table 7. Hypothesis testing Path Standardized
Coefficients t value Sig. Hypothesis testing β
e-Marketing
→ Brand Trust .613 15.934 .000 H1: Supported e-Marketing
→ Brand Loyalty .582 14.680 .000 H2: Supported Perc. ServQual
→ Brand Trust .788 26.236 .000 H3: Supported Perc. ServQual
→ Brand Loyalty .821 29.552 .000 H4: Supported Brand Trust
→ Brand Loyalty .806 27.974 .000 H5: Supported
The findings confirm that five hypotheses of conceptual model are supported. The regression equation for brand trust indicates that perceived service quality has the highest impact in building customer trust, indicating that subscribers of mobile telephone operators in Kosovo perceive service quality as more important factor than e-marketing activities for attaining their trust and becoming loyal towards the brand of the telephone operators. See the regression equation for brand trust:
Brand Trust
= .510 + .727 *Perceived ServQual + .192 * e-Marketing Hence, similar to findings of the other researchers from different countries (Aydin & Ozer, 2005; Chang & Chong, 2011; Nawaz & Usman, 2011; Hassan, Malik, & Faiz, 2012;
Agyei & Kilika, 2013; Poku, Ansah, & Lamptey, 2014;
Tabaku & Çerri, 2015; Khizindar, Al-Azzam, & Khanfar, 2015;
Rajeswari, Srinivasulu, & Thiyagarajan, 2017; Ramadai, Theresia, & Sadalia, 2018), this study also confirms that the perceived service quality in telecommunication industry in Kosovo has the highest impact in brand loyalty compared to other determinants.
The study also confirms significant direct and indirect effect of the brand trust in brand loyalty. Thus, suggesting that brand trust leads to more loyal customers towards the brand, yield higher prices, repetitive purchase from loyal customer, good word of mouth and higher market shares (Aydin & Ozer, 2005; Amin, Ahmad, & Hui, 2012; Sarwar, Abbasi, & Pervaiz, 2012; Chinomona, Mahlangu, & Pooe, 2013; Sheikh, Sheikh, & Rizwan, 2014).
As it was confirmed by regression equation, the perceived service quality has higher indirect impact through brand trust than direct impact in brand loyalty.
Brand Loyalty
= .177 + 475 * Perceived ServQual + .400 * Brand Trust + .089 * e-Marketing
The study suggests that e-marketing presents moderating effect in brand loyalty in relation to perceived service quality and brand trust. The findings compliment previous findings of Mullatahiri and Ukaj (2019) who confirmed the moderating effect of the e-Marketing communication in brand loyalty.
Although, e-marketing has positive significant effect on brand loyalty, its impact in the outcome variable is lower compared to other variables in the equation.
5. Conclusion
The aim of this study was to explore the relations and the effects of e-Marketing and perceived service quality in the brand trust and loyalty. Consequently, a model of four constructs was drawn and five hypotheses were postulated.
To test the hypothesis the data was collected via online survey from subscribers of at least one mobile telephone operators in Kosovo. The empirical analysis supported all five hypotheses.
The results indicate that perceived service quality is key predictors of the outcome variable, having significantly positive and direct effect in brand loyalty (.821) and significant effect on brand trust (.788). Also, the relationship between brand trust and brand loyalty is significantly strong (.806), indicating that perceived service quality had significant indirect effect in brand loyalty through brand trust.
This means that subscribers of the mobile telephone operators in Kosovo, trust brands they perceive provide more qualitative services, and this will have an impact in their loyalty as well.
However, the study points out that the effects of e-Marketing (.582) in brand loyalty as predictor in the model, are moderate compared to perceived service quality and brand trust. The study confirms that e-Marketing (.613) has slightly higher indirect effect in brand loyalty through brand trust. Thus, suggesting that e-Marketing strategies should be focused in building customer relations and trust, because customer will not be loyal, if they don't trust the brand.
In conclusion, can be confirmed that the perceived service quality and brand trust in achieving brand loyalty in telecommunication industry is key determinant, followed by e-Marketing as means to creating expectation while promoting offerings and delivering on promise to meet customers' perceptions for service quality and build loyalty.
5.1. Implications of the Study
The telecommunication industry in Kosovo is becoming
increasingly competitive, thus changing marketing approach
to meet customers expectation and sustain customers'
loyalty is crucial for marketers. The study tries to explore
the relations between e-Marketing and perceived service
quality with trust and loyalty towards the brands of the
mobile telephone operators, since no prior studies were found in Kosovo context. Hence, the findings will provide fruifull insight for practitioners and researchers.
For practitioners - the study points out the importance of subscribers' perception for the service quality in building trust and loyalty towards their brands. Hence, indicating that marketers, have to focus their efforts to change their marketing approach by promoting their services to create expectations to the extent that their service delivery meets their perceived service quality. Since, the subscribers have shown they value more perceived service quality, hence trust more brands that deliver on promise. In return, the customers reward the company by being loyal to the brand even if the competitors offer lower price, while spreading a good word, influencing friends to use the same operator.
However, current marketing approach, had moderating effect in brand trust and loyalty.
For researchers - this study significantly contributes to e-marketing and brand loyalty literature, by exploring the effects of e-marketing and perceived service quality on brand trust and brand loyalty, in service industry in general and in particular, in the telecommunication industry in Kosovo. This study provides indication that in the service industry the e-marketing is an additional determinant to build brand trust that will lead to customers' loyalty towards the brands.
References
Aaker, D. A., & Jacobson, R. (2001). The Value Relevance of Brand Attitude in High Technology Markets.
Journal of Marketing Research, 38(4), 485-493.
Agyei, P. M., & Kilika, J. M. (2013). The Relationship between Service Quality and Customer Loyalty in Kenyan Mobile Telecommunication Service Industry.
European Journal of Business and Management, 5(23), 26-36.
Alnaser, A. S., & Al Shibly, M. S. (2016). Effects of applying e-marketing mix elements on customer satisfaction in telecommunication sector: case study of an Umniah company. Journal of Advanced Social Research, 6(11), 11-39.
Amin, S. M., Ahmad, U. N., & Hui, L. S. (2012). Factors Contributing to Customer Loyalty Towards Telecommunication Service Provider. The 2012 International Conference on Asia Pacific Business Innovation & Technology Management (pp.282-286).
Elsevier Ltd.
Anik, S., & Putri, V. P. (2015). Influence of Trust in a Brand to Brand Loyalty on Consumer Provider Smart Telecom. Global Journal of Emerging Trends in e-Business, Marketing and Consumer Psychology, 1(1), 208-222.
Aydin, S., & Ozer, G. (2005). The analysis of antecedents of customer loyalty in the Turkish mobile telecommunication market. European Journal of Marketing, 39(7/8), 910-925.
Baba, M. M., & Majeed, R. (2018). Service Quality and Customer Loyalty: A Study in Telecom Sector. Asian review of Social Sciences, 7, 60-66.
Bala, M., & Verma, D. (2018). A Critical Review of Digital Marketing. International Journal of Management, IT and Engineering, 8(10), 321-339.
Calvin, O. Y. (2016). The Impact of Service Quality and Brand Awareness on Brand Loyalty: (A Study of Telecommunication Companies in Nigeria. International Journal of Recent Research in Commerce Economics and Management, 3(3), 18-25.
Cemal, Z., Sahin, A., Kitapci, H., & Ozsahin, M. (2011).
The Effects of Brand Communication and Service Quality in Building Brand Loyalty Through Brand Trust;
The Empirical Research On Global Brands. 7th International Strategic Management Conference (pp.
1218-1231). Paris: Elsevier Ltd.
Chang, P. K., & Chong, H. L. (2011). Customer satisfaction and loyalty on service provided by Malaysian telecommunication companies. Proceedings of the 2011 International Conference on Electricla Engineering and Informatics. Bandung, Indonesia:
Institute Technology Bandung, Indonesia.
Chinomona, R., Mahlangu, D., & Pooe, D. (2013). Brand Service Quality, Satisfaction, Trust and Preference as Predictors of Consumer Brand Loyalty in the Retailing Industry. Mediterranean Journal of Social Sciences, 4(14), 181-190.
Constantinides, E. (2002). The 4S Web-Marketing Mix model.
Electronic Commerce Research and Applications, 1, 57-76.
Mullatahiri, V., & Ukaj, F. (2019). The Effects of e-Marketing Communication on Brand Loyalty: The Case of Mobile Telephone Operators in Kosovo.
Journal of Distribution Science, 17(6), 15-23.
Erdogmus, I. E., & Çiçek, M. (2012). The impact of social media marketing on brand loyalty. 8th International Strategic Management Conference. 58, pp. 1353-1360.
Elsevier Ltd.
Ganiyu, R. A., Uche, I. I., & Elizabeth, A. O. (2012). Is Customer Satisfaction an Indicator of Customer Loyalty?
Australian Journal of Business and Management Research, 2(7), 14-20.
Geçti, F., & Gumus, N. (2014). Investigating the Facebook Applications and their Impact on Customer Loyalty in the Turkish Mobile Telecommunication Industry. International Journal of Business and Management, 9(5), 195-207.
Gronroos, C. (1984). A Service Quality Model and its
Marketing Implications. European Journal of Marketing,
18(4), 36-44.
Hassan, M. u., Malik, A. A., & Faiz, M. F. (2012). An Empirical Assessment of Service Quality and its Relationship with Customer Loyalty Evidence from the Telecom Sector of Pakistan. International Journal of Asian Social Science, 1(10), 1647-1663.
Hassan, S. H., Thurasamy, R. T., & Loi, W. Y. (2017).
E-lifestyle, Customer Satisfaction and Loyalty among Mobile Subscribers in Thailand. International Review of Management and Marketing, 7(1), 354-362.
Ikramuddin, Adam, M., Sofyan, H., & Faisal. (2018).
Determination of Brand Loyalty in Telecommunication Industry: Literature Review. International Journal of Engineering & Technology, 7(3.30), 59-62.
Izogo, E. E. (2017). Customer loyalty in telecom service sector: The role of service quality and customer commitment. The TQM Journal , 29(1), 19-36.
Keller, K. L. (2009). Building Strong brands in a modern marketing communications environment. Journal of Marketing Communications, 15, 139-155.
Khan, A. R., & Islam, A. (2017). The Impact of Digital Marketing on Increasing Customer Loyalty: A study on Dhaka City, Bangladesh. International Journal of Economics, Commerce and Management, 5(4), 521-528.
Khizindar, T. M., Al-Azzam, A. F., & Khanfar, I. A.
(2015). An Empirical Study Of Factors Affecting Customer Loyalty Of Telecommunication Industry In The Kingdom Of Saudi Arabia. British Journal of Marketing Studies, 3(5), 98-115.
Kungumapriya, A., & Malarmathi, K. (2018). The Impact of Service Quality, Perceived Value, Customer Satisfaction in Calculative Commitment and Customer Loyalty Chain in Indian Mobile Telephone Sector. IOSR Journal of Business and Management, 20(5), 72-82.
Lawrence, B., Fournier, S., & Brunel, F. (2013). When Companies Don't Make the Ad: A Multi-Method Inquiry into the Differential Effectiveness of Consumer- Generated Advertising. Journal of Advertising, 42(4), 292-307.
Lee, L. J., James, J. D., & Kim, Y. K. (2014). A Reconceptualization of Brand Image. International Journal of Business Administration, 5(4), 1-11.
Loke, S. P., Taiwo, A. A., Salim, H. M., & Downe, A. G.
(2011). Service Quality and Customer Satisfaction in Telecommunication Service Provider. 2011 International Conference on Financial Management and Economics.
11, pp. 24-29. Singapore: IACSIT Press.
Lovett, M. J., & Staelin, R. (2016). The Role of Paid, Earned, and Owned Media in Building Entertainment Brands: Reminding, Informing, and Enhancing Enjoyment. Marketing Science, 35(1), 142-57.
Mellens, M., Dekimpe, M. G., & Steenkamp, J.-B. E.
(1996). A Review of Brand-loyalty Measures in Marketing. Tijdschrift voor Economie en Management, 41(4), 507-533.
Merisavo, M., & Raulas, M. (2004). The Impact of email Marketing on Brand Loyalty. Journal of Product &
Brand Management, 13(7), 498-505.
Nawaz, N.-U.-A., & Usman, A. (2011). What Makes Customers Brand Loyal: A Study on Telecommunication Sector of Pakistan. International Journal of Business and Social Science, 2(14), 213-222.
Nimon, K. F., & Oswald, F. L. (2013). Understanding the Results of Multiple Linear Regression Beyond Standardized Regression Coefficients. Organizational Research Methods, 16, 650-674.
Oliver, R. L. (1999). Whence Customer Loyalty? Journal of Marketing, 63(Special Issue), 33-44.
Osborne, J. W., & Waters, E. (2002). Four Assumptions Of Multiple Regression That Researchers Should Always Test. Practical Assessment Research and Evaluation, 8(2), 1-5.
Parasuraman, A., Zeithaml, V. A., & Berry, L. L. (1985).
A Conceptual Model of Service Quality and Its Implications for Future Research. The Journal of Marketing, 49(4), 41-50.
Poku, K., Ansah, M. O., & Lamptey, D. I. (2014). The Impact of Service Quality Delivery on Customer Loyalty in the Telecommunication Industry: A Case Study of Expresso Telecom, Ghana. Jounal of research in Marketing, 3(1), 212-221.
Pollack, B. L. (2009). Linking the hierarchical service quality model to customer satisfaction and loyalty.
Journal of Services Marketing, 23(1), 42-50.
Rajeswari, S., Srinivasulu, Y., & Thiyagarajan, S. (2017).
Relationship among Service Quality, Customer Satisfaction and Customer Loyalty: With Special Reference to Wireline Telecom Sector (DSL Service).
Global Busienss Review, 18(4), 1041-1058.
Ramadai, Theresia, M., & Sadalia, I. (2018). The Determinants of Customer Loyalty for Telecommunication Providers. journal of Research in Business, Economics and Management, 10(3). 23-31.
Sarwar, M. Z., Abbasi, K. S., & Pervaiz, S. (2012). The Effect of Customer Trust on Customer Loyalty and Customer Retention: A Moderating Role of Cause Related Marketing. Global Journal of Management and Business Research, 12(7), 121-131.
Sheikh, M. A., Sheikh, M. A., & Rizwan, M. (2014). The role of Brand and Company Image in Buidling Brand Loyalty through Service Quality and Brand Trust.
Journal of Socialogical Research, 5(1), 365-177.
Skorbich, L., & Kot, S. (2018). Marketing 3.0 in Contemporary Marketing Management Activities of Enterprises. Proceedings of the 2nd International Conference Contemporary Issues in Theory and Practice of Management (pp.591-597). Çestokova:
Çestokova University of Technology, Faculty of Management.
Tabaku, E., & Çerri, S. (2015). An Empirical Investigation
of Customer Loyalty in Telecommunication Industry in Albania. Mediterranean Journal of Social Sciences, 6(1), 224-231.
Tatar, S. B., & Erdogmus, I. E. (2016). The effect of social media marketing on brand trust and brand loyalty for hotels. Information Technology and Tourism, 16(3), 249-263.
Uyanik, G. K., & Guler, N. (2013). A study on multiple linear regression analysis. 4th International Conference on New Horizons in Education (pp.234-240). Sakarya, Turkey: Elsevier Ltd.
Webster Jr., F. E. (2000). Understanding the Relationships among Brands, Consumers, and Resellers. Journal of
the Academy of Marketing Science, 28(1), 17-23.
Wind, J., & Mahajan, V. (2000). The Challenge of Digital Marketing. European Business, Spring(1), 20-27.
Wind, J., & Rangaswamy, A. (2001). Customerization:
The next revolution in mass customization. Journal of Interactive Marketing, 15(1), 13-32.
Yarimoglu, E. K. (2014). A Review on Dimension of Service Quality Models. Journal of Marketing Management, 2(2), 79-93.
Zafir, H. (2013, March). A study of the impact on brand
loyalties of customer experiences within the context of
online communities. Brunel Business School - Doctoral
Symposium.
Annex 1.
e-Marketing Product eM01 Products can be downloaded online (webpage and social media
eM02 My preferred operator publishes online all product instructions for using the product and accessing services!
eM03 My preferred operator offers warranty of its product via online platforms eM04 My preferred operator offers products in packages that includes services
Promotion
eM05 Commercials in webpage of my preferred operator have interesting and attractive content
eM06 Commercials in social media (Facebook, Instagram, Twitter) of my preferred operator have interesting and attractive content!
eM07 My preferred operator shares the information by using (Facebook, Instagram, Twitter)
eM08 Commercials of my preferred operator I can find in other portals online and are very attractive!
eM09 My preferred operator organizes online events and forums to inform us for new services/products eM10 My preferred operator sends me new offers and messages via email.
eM11 My preferred operator sends me new offers and messages via SMS
eM12 Promotional Sales of my preferred operator are very attractive to purchase services/products
eM13 My preferred operator uses YouTube videos are very attractive when advertizing new services and creating promotional campaigns
eM14 Customer Forums/Chat rooms in the website or social media, created by my operator, provide an opportunity to exchange information with other customers
eM15 My preferred operator sponsors different cultural, sport and educational activities Price-Online purchase
eM16 Products and Services (top-ups) of my preferred operator can be purchased online using webpage eM17 Products and Services (top-ups) of my preferred operator can be purchased online using the Facebook eM18 Products and Services (top-ups) of my preferred operator can be purchased via phone
eM19 Products and Services (top-ups) of my preferred operator can be purchased via e-banking!
eM20 My preferred operator offers different prices depending on packages that I choose Place
eM21 My preferred operator offers online ordering and free delivery!
eM22 My preferred operator distributes electronic products (i.e. updates, applications) via webpage and Facebooks!
eM23 My preferred operator distributes electronic products (i.e. updates, applications) via SMS!
eM24 My preferred operator distributes electronic products (i.e. updates, applications) via email!
Brand trust TR1 I trust my preferred operator more than other operators!
TR2 I feel that I take the best possible product /service from my operator!
TR3 I trust that my operator keeps the promise TR4 My operator is the most reliable operator in Kosovo
Brand Loyalty BL1 I will go on using the same operator
BL2 I recommend this operator to my friends every time I have a chance
BL3 Even if the prices of other operators are cheaper, I will continue using this operator BL4 Even if my friends suggest me to use other operators, I will not change my operator BL5 I will continue using same product/services from my operator
BL6 If, new products will be offered in the market, I will purchase again from the same operator Service Quality
SQ01 The employees of this operator are polite and friendly SQ02 The employees of my operator understand my needs SQ03 The online customer service is qualitative and fast
SQ04 The quality of the services of my operator are as I've expected SQ05 The quality of the coverage area of my operator is very good
SQ06 Services my preferred operator are more qualitative, compared to other operators