†Corresponding author: Jae-Kyung No, Dept. of Food & Nutrition, Kyungsung University, 309, Suyeong-ro, Nam-gu, Busan 608-736, South Korea, Tel. +82-51-663-4651, E-mail. [email protected]
The Relationship between Nutrient Intakes and Health Indicators according to Rice Consumption in Korean Elderly: Using the 2010
Korea National Health and Nutrition Examination Survey
Chorong Oh and Jae-Kyung No
†Dept. of Food & Nutrition, Kyungsung University, Korea
ABSTRACT
The present study was aimed at evaluating whether white rice consumption has any association with selected measures of dietary intake and nutrients, including various variables of energy intake, major vitamin, mineral intakes, and the risk of health characteristics for over 60 years older. A total of 1,433 subjects (658 male and 775 females) 60 years or older from the fifth Korea National Health and Nutritional Examination Survey(KNHANES) 2010 participated and the Food Commodity Intake Database were used in this study. Levels of percent energy intake from rice were classified into 4 groups (R1, R2, R3, R4 groups:
25% of each) between male and female elderly using data from KNHANES. One of the interesting findings was that the higher rice consumers had a significantly sufficient intakes of a range of nutrients such as total energy intake, protein, carbohydrate, calcium, mineral, sodium, potassium, and niacin in female elderly, but not much in male. Other finding was that as the higher intake of rice group, prevalence of hypertension (53.5%, 63.4%, 50.3%, 46.3%, p=0.035), dyslipidemia (16.6%, 18.0%, 14.5%, 11.1%, p=0.008), sarcopenia (46.1%, 46.1%, 40.2%, 28.8%, p=0.012), sarcopenic obesity (25.4%, 31.5%, 23.7%, 15.5%, p=0.008) were significantly less than other groups in female, but not much in male. In conclusion, we obtained valuable basic information on recommended rice-centered diet could give us good nutritional status and eventually bring the prevention of some chronic diseases in elderly, especially in female.
Keywords: rice intake, Korean elderly, nutrients, chronic diseases, sarcopenia
INTRODUCTION
In the context of a steady increase in life expectancy, maintaining health and well-being in aging populations has become a major public health challenge. Over time, nutrition- modifiable disease is potentially responsible for playing a role in age-related chronic diseases: dyslipidemia and heart-related problems; hypertension and stroke; cancer; reduced mobility accompanied by excess body weight with an increased risk of developing type 2 diabetes (De, Bonacci, & Giraldi, 2010).
To encourage and maintain a healthy lifespan in large and increasing populations of elderly individuals, among the most important modifiable factors on health aging, diet is prominent (Kiefte-de, Mathers, & Franco, 2014). Therefore, significant efforts in developing dietary interventions for promoting healthy aging have been devoted identifying effective ways to
modulate metabolism and stress (Haigis & Yankner, 2010).
A traditional Korean meal of agricultural products, depen- ding on the nature and seasonality, livestock, fisheries, etc.
and various types of stocks of rice and side dishes can be called an effective healthy diet on chronic disease prevention (Ahn
& Ha, 2010). However, particularly fast food is increasing as westernized eating habits and have reduced the consumption of staple rice, decreased to 20%, especially over the past 10 years (Cha, 2010). Rice central dish meal is to eat a variety of nutrient balance and a variety of food-selection strategies could be used to influence the energy density of an individual’s diet (Kang, Kim, & Han, 2004). Previously published papers suggested that rice consumers in NHANES 2007∼2008 and the Food Commodity Intake Database had a significantly higher energy intake, yet they had lower percentage calorie intake from fat and saturated fat (Kennedy & Luo, 2015). Rice con-
sumers also had significantly higher intakes of a range of nutrients and lower waist circumference, and triceps skinfold AND muscla mass (Oh & No, 2015). In addition, as rice- centered diet such condiments and spices used together are used with increased immunity to enrich the content of antioxi- dants and phytochemicals, it contains key nutrients, such as folic acid, iron, potassium, etc. and that can lower the risk of obesity (Kim et al., 2012). Another suggestion is that positive associations between total carbohydrate or rice intake and the incidence of diabetes have been reported in Chinese (Appel et al., 1997). and Japanese women (Aoe et al., 2014). The carbohydrate ratio in the Korean meal that contribute to energy intake is still pretty good with a very high 60∼65%
and while the consumption of bread or noodles in a meal of grain-oriented growth, qualitative aspects of carbohydrate intake is changing(Kim, Moon, & Popkin, 2000). Instant noodles and breads are often criticized as unhealthy or as a type of empty Calories food. A single serving of instant noodles and breads are usually high in carbohydrates but is low in fiber, vitamins, and minerals (Park et al., 2011).
Additionally, as people grow older, they need fewer calo- ries but more nutrients to maintain proper health. Generally speaking, aging body gradually loses lean muscle tissue (sarcopenia), and less muscle translates to a lower calorie requirement. To fill these nutrient gaps, consuming a healthful diet can contribute to healthy aging. Until now, there is no research regarding the health status and rice dietary patterns and nutritional status of the Korean elderly. We examined associations between white rice consumption and the risk of health characteristics for over 60 years. We hope that this study will help to construct guidelines for nutritional education regarding rice consumption and rice-centered diet as a healthy diet pattern.
LITERATURE REVIEW
Rice, major source carbohydrate, consumption is higher in Asian countries included South Korea than other western countries. It is a staple food with Kimchi in South Korea.
There are three meals such as breakfast, lunch, diner with rice in traditional Korean style, and various side dishes are provi- ded with boiled rice. Especially, higher rice intake is implying
how important it is for the elderly who are easy to be malnu- trition status (Watanabe et al., 2013). There are controversy on the effect of white rice. Liu et al. (2000) reported that there was association between a high white rice intake and chronic diseases such as cardiovascular disease, diabetes, etc. But there was different result by sex. Among male, high carbohydrate intake was not associated with prevalence of chronic diseases and mortality, but not in female (Tavani et al., 2003). Tra- ditional Korean style meal composed of white rice and various side dishes include kimchi for 3 times a day showed the positive effect of prevention of chronic diseases (Son et al., 2013). The study with 60 years or older Korean elderly by Oh showed that there was significantly association with rice intake and chronic disease related factors of muscle mass which is important factor for prevention chronic diseases (Oh
& No, 2015). Higher white rice intake group revealed that less intake of other refined grain and products from flours include bread and noodle. It means that this group wasn't in risk by too much carbohydrate intake. Recently, there are many studies on the identify structure of rice intake or and rice intake behavior (Lee, 1997). However, there is little study on the rice intake and chronic disease include sarcopenia which is major factor for prevention metabolic disease. Sarcopenia, a progre- ssive loss of muscle mass and strength is natural process (Baumgartner et al., 1998). and it is associated with chronic diseases for the elderly (Chung et al., 2013). Therefore, for the elderly, it can be expected to obtain an effect to prevent muscle decreased to take rich in rice diet, eventually prevent chronic disease. So, it is evidence showed that proper rice intake could be one of way for profection chronic diseases, even though the association between rice intake and chronic diseases prevailance still remain uncertain.
METHODS
Sample and Data Collection
The present study aimed to explore whether white rice in- take has any association with measures of nutrients, including various variables of energy intake, major vitamin, mineral intakes, and prevalence of chronic diseases include sarcopenia for the South Korean elderly.
Therefore, this study used data from the KNHANES 2010
which is a nationally representative survey conducted by the Korean Ministry of Health and Welfare. The sampling units consisted of households selected through a stratified, multi- stage, probability-sampling design based on geographic area, sex, and age group using household registries (KNHANES V-1, 2010). Among 8,473 participants, total of 1,433 samples collected (658 men, 775 women), 60 years or older who par- ticipated in the health examination and nutrition surveys were included in this study. We excluded those who had not per- formed DXA, did not have data on oral daily nutrition intake, and had not undergone prevailance of chronic disease. Dietary intake was measured by the single 24-hdietary recall method and compared with the Recommended Daily Allowance (RDA).
Measurement of Appendicular Skeletal Muscle Mass and Obesity
Body mass index (BMI) was calculated by dividing weight (kg) by height (m2). Adual-energyX-rayabsorptiometry (DXA) scan was performed to measure total bodyfatmass, total bodyfat percentage, and lean mass using fan-beam technology (Lunar Corp., Madison,WI). Appendicular skeletal muscle mass (ASM, kg) was defined as the sum of lean soft tissue mass in the arms and legs following the method of Heymsfield et al.
(1990). We calculated ASM as a percentage of body weight (Wt), modifying methods published by Lim et al. (2010), respectively. Sarcopenia was defined as an ASM divided by Wt (ASM/Wt) that was less than 1 standard deviation (SD) below the mean of a reference sample of 1746 healthy adults age 20∼39 years (748 men, 998 women) from the fifth KN- HANES database. The cutoff value (32.4±2.8 for men, 25.7±
2.3 for women) for sarcopenia was 44% for men and 52% for women. Obesity classification was determined according to the BMI criteria established by the Obesity Task Force (IOTF), World Health Organization (WHO) and the Korean Society for the Study of Obesity (KSSO) (Oh, Jho, No & Kim, 2015).
Subjects were further classified into four groups based on the combination of sarcopenia and obesity definitions above: sar- copenic obese (SO), sarcopenic nonobese (SNO), nonsarcopenic obese (NSO), and nonsarcopenic nonobese (NSNO).
Data Analysis
The data were compiled and analyzed using SPSS version
20.0 (SPSS, IBM, NY, USA). The generalized linear model was used to compare nutrient intakes among the four different rice intake groups and data are presented as means±SE. Chi- square test was used for relationship between prevailance of chronic disease and rice intake. Adjustments for age, sex. The level of significance was set at p<0.05.
RESULTS
The study included 658 men and 775 women with mean ages of 43.2±0.2 and 43.9±0.2 years, respectively (data no shown). By Oh's study (Oh & No, 2015). The prevalence of MS was significantly higher 27.0% in women than 20.4% in men. Therefore, the incidence of metabolic disorder tended to increase with women than men.
Prevalence of Chronic Diseases associated with Rice Consumptions
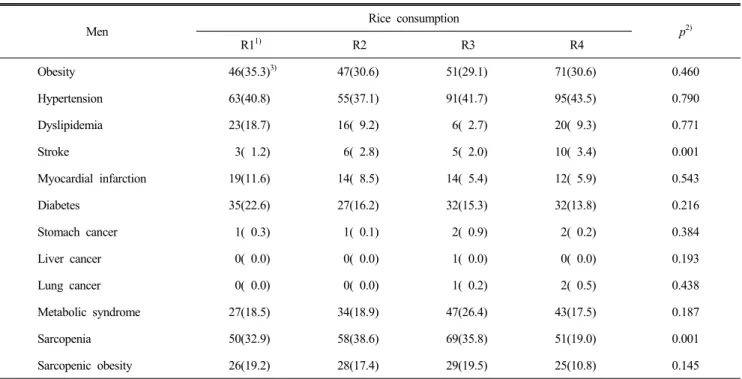
Prevalence of chronic diseases according to quartile cate- gories of rice consumptions for the male and female elderly, separately, are shown in Table 1 and Table 2.
For the male elderly, there were significant different in prevalence of stroke and sarcopenia (p=0.001) by rice con- sumptions. The highest rice consumption group showed higher risk of stroke (1.2%, 2.8%, 2.0%, 3.4%, p=0.001) than other groups. For the female elderly, prevalence of hypertension, dyslipidemia, sarcopenia, sarcopenic obesity were significantly different by rice consumptions. As the higher intake of rice group, prevalence of hypertension (53.5%, 63.4%, 50.3%, 46.3
%, p=0.035), dyslipidemia (16.6%, 18.0%, 14.5%, 11.1%, p=
0.008), sarcopenia (46.1%, 46.1%, 40.2%, 28.8%, p=0.012), sarcopenic obesity (25.4%, 31.5%, 23.7%, 15.5%, p=0.008) were significantly less than other groups.
Unlike males, there was no significant difference in women, but the prevalence of chronic diseases was low in the female elderly with high rice consumption. In women, the prevalence of metabolic syndrome is higher than that of men, suggesting that the controling rice consumption by education would have a high effect on chronic diseases.
Nutrients Associated with Rice Consumptions
Nutrients according to quartile categories of rice consump-
Table 1. The relationship between prevalence of disease and white rice consumption for men
Men
Rice consumption
p2)
R11) R2 R3 R4
Obesity 46(35.3)3) 47(30.6) 51(29.1) 71(30.6) 0.460
Hypertension 63(40.8) 55(37.1) 91(41.7) 95(43.5) 0.790
Dyslipidemia 23(18.7) 16( 9.2) 6( 2.7) 20( 9.3) 0.771
Stroke 3( 1.2) 6( 2.8) 5( 2.0) 10( 3.4) 0.001
Myocardial infarction 19(11.6) 14( 8.5) 14( 5.4) 12( 5.9) 0.543
Diabetes 35(22.6) 27(16.2) 32(15.3) 32(13.8) 0.216
Stomach cancer 1( 0.3) 1( 0.1) 2( 0.9) 2( 0.2) 0.384
Liver cancer 0( 0.0) 0( 0.0) 1( 0.0) 0( 0.0) 0.193
Lung cancer 0( 0.0) 0( 0.0) 1( 0.2) 2( 0.5) 0.438
Metabolic syndrome 27(18.5) 34(18.9) 47(26.4) 43(17.5) 0.187
Sarcopenia 50(32.9) 58(38.6) 69(35.8) 51(19.0) 0.001
Sarcopenic obesity 26(19.2) 28(17.4) 29(19.5) 25(10.8) 0.145
Note: 1) Energy from rice consumption (R1∼R4): R1(≤543), R2(543∼801), R3(801∼1,081), R4(1,081 ∼3,807); 2) P from Chi-square test. p<.05;
3) Numbers and percentages.
Table 2. The relationship between prevalence of disease and white rice consumption for women
Women
Rice consumption
p2)
R11) R2 R3 R4
Obesity 103(35.2)3) 114(47.0) 34( 8.5) 63(32.9) 0.783
Hypertension 133(53.5) 140(63.4) 105(50.3) 84(46.3) 0.035
Dyslipidemia 44(16.6) 42(18.0) 30(14.5) 21(11.1) 0.008
Stroke 6( 1.7) 7( 2.6) 8( 2.4) 0( 0.0) 0.383
Myocardial infarction 21( 8.6) 10( 4.2) 18( 9.2) 9( 3.8) 0.123
Diabetes 52(19.7) 33(15.5) 25( 9.8) 28(17.2) 0.117
Stomach cancer 3( 0.9) 2( 1.1) 0( 0.0) 0( 0.0) 0.129
Breast cancer 3( 0.8) 0( 0.0) 0( 0.0) 0( 0.0) 0.264
Uterine cancer 1( 0.4) 0( 0.0) 0( 0.0) 0( 0.0) 0.592
Metabolic syndrome 61(21.7) 77(31.7) 64(27.0) 47(25.7) 0.166
Sarcopenia (1sd) 117(46.1) 113(46.1) 89(40.2) 53(28.8) 0.012
Sarcopenia (2sd) 38(14.4) 28(10.7) 24(10.1) 16( 8.8) 0.426
Sarcopenic obesity (1sd) 69(25.4) 73(31.5) 54(23.7) 35(15.5) 0.008
Sarcopenic obesity (2sd) 26( 8.6) 25( 9.8) 14( 5.4) 10( 4.8) 0.248
Note: 1) Energy from rice consumption (R1∼R4): R1(≤543), R2(543∼801), R3(801∼1,081), R4(1,081 ∼3,807); 2) P from Chi-square test. p<.05.
3) Numbers and percentages.
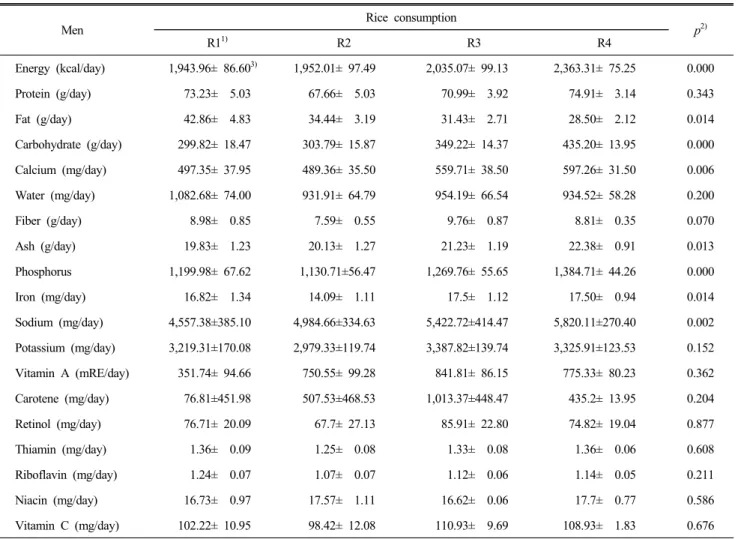
Table 3. The relationship between nutrient intakes and white rice consumption for men
Men
Rice consumption
p2)
R11) R2 R3 R4
Energy (kcal/day) 1,943.96± 86.603) 1,952.01± 97.49 2,035.07± 99.13 2,363.31± 75.25 0.000
Protein (g/day) 73.23± 5.03 67.66± 5.03 70.99± 3.92 74.91± 3.14 0.343
Fat (g/day) 42.86± 4.83 34.44± 3.19 31.43± 2.71 28.50± 2.12 0.014
Carbohydrate (g/day) 299.82± 18.47 303.79± 15.87 349.22± 14.37 435.20± 13.95 0.000
Calcium (mg/day) 497.35± 37.95 489.36± 35.50 559.71± 38.50 597.26± 31.50 0.006
Water (mg/day) 1,082.68± 74.00 931.91± 64.79 954.19± 66.54 934.52± 58.28 0.200
Fiber (g/day) 8.98± 0.85 7.59± 0.55 9.76± 0.87 8.81± 0.35 0.070
Ash (g/day) 19.83± 1.23 20.13± 1.27 21.23± 1.19 22.38± 0.91 0.013
Phosphorus 1,199.98± 67.62 1,130.71±56.47 1,269.76± 55.65 1,384.71± 44.26 0.000
Iron (mg/day) 16.82± 1.34 14.09± 1.11 17.5± 1.12 17.50± 0.94 0.014
Sodium (mg/day) 4,557.38±385.10 4,984.66±334.63 5,422.72±414.47 5,820.11±270.40 0.002
Potassium (mg/day) 3,219.31±170.08 2,979.33±119.74 3,387.82±139.74 3,325.91±123.53 0.152
Vitamin A (mRE/day) 351.74± 94.66 750.55± 99.28 841.81± 86.15 775.33± 80.23 0.362
Carotene (mg/day) 76.81±451.98 507.53±468.53 1,013.37±448.47 435.2± 13.95 0.204
Retinol (mg/day) 76.71± 20.09 67.7± 27.13 85.91± 22.80 74.82± 19.04 0.877
Thiamin (mg/day) 1.36± 0.09 1.25± 0.08 1.33± 0.08 1.36± 0.06 0.608
Riboflavin (mg/day) 1.24± 0.07 1.07± 0.07 1.12± 0.06 1.14± 0.05 0.211
Niacin (mg/day) 16.73± 0.97 17.57± 1.11 16.62± 0.06 17.7± 0.77 0.586
Vitamin C (mg/day) 102.22± 10.95 98.42± 12.08 110.93± 9.69 108.93± 1.83 0.676
Note: 1) Energy from rice consumption (R1∼R4): R1(≤543), R2(543∼801), R3(801∼1,081), R4(1,081 ∼3,807); 2) P from generalized linear model for numerical after adjusted by sex and age variables, p<.05; 3) Numerical variables are given as means±S.E.
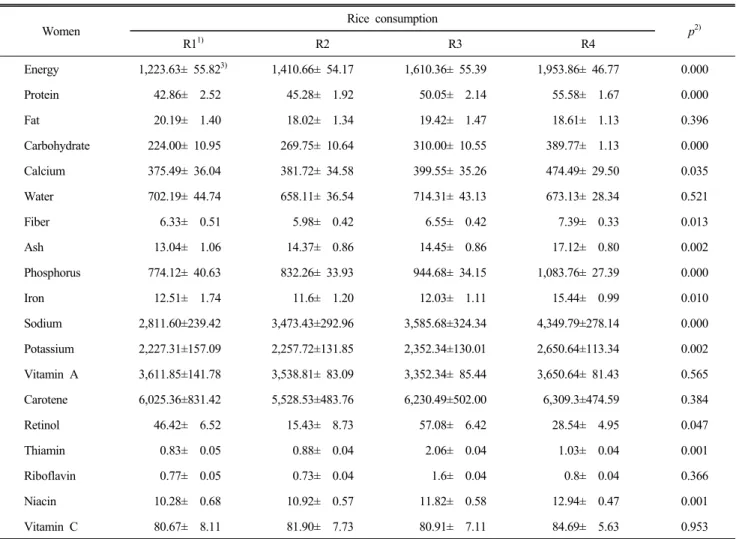
tions for the male and female elderly, separately, are shown in Table 3 and Table 4. The male elderly in higher rice con- sumption group showed significantly more intake of total energy, carbohydrate, mineral, sodium. For women, it showed significantly more consumed total energy, protein, carbohy- drate, calcium, dietary fiber, mineral, phosphorus, iron, sodium, potassium, retinol, thiamin, and niacin.
DISCUSSION AND CONCLUSIONS
According to he National Statistical Office (NSO), annual per capita rice consumption reached the highest level at 134.5 kg in 1972 has started to decline 112.9 kg in 1992, and 69.8 kg in 2012 due to the increase in income, nuclear family, single-person households, and improvements of Women’s
Roles (Mosleh, Hassan, & Chowdhury, 2015).
In the present study, through a analysis 2010 National Health and Nutrition Examination Survey, we investigated the risk of health characteristics in relation to the impact of white rice consumption for nutrition of 60-year-old elderly for provi- ding a basis for the elderly to help the health care and disease prevention. This study aims to provide reliable information on how the increased intake of rice affects chronic diseases in the elderly. One interesting point in Table 1 and Table 2 was that consumed a high-carbohydrate meal group of rice in the elderly could reduce the provenances of chronic diseases: the incidence of stroke and sarcopenia in man and the incidence of high blood pressure, dyslipidemia, and sarcopenia in women.
Muscle reduction in the elderly reduces energy expenditure and, as a result, causes visceral obesity. These changes are
Table 4. The relationship between nutrient intakes and white rice consumption for women
Women
Rice consumption
p2)
R11) R2 R3 R4
Energy 1,223.63± 55.823) 1,410.66± 54.17 1,610.36± 55.39 1,953.86± 46.77 0.000
Protein 42.86± 2.52 45.28± 1.92 50.05± 2.14 55.58± 1.67 0.000
Fat 20.19± 1.40 18.02± 1.34 19.42± 1.47 18.61± 1.13 0.396
Carbohydrate 224.00± 10.95 269.75± 10.64 310.00± 10.55 389.77± 1.13 0.000
Calcium 375.49± 36.04 381.72± 34.58 399.55± 35.26 474.49± 29.50 0.035
Water 702.19± 44.74 658.11± 36.54 714.31± 43.13 673.13± 28.34 0.521
Fiber 6.33± 0.51 5.98± 0.42 6.55± 0.42 7.39± 0.33 0.013
Ash 13.04± 1.06 14.37± 0.86 14.45± 0.86 17.12± 0.80 0.002
Phosphorus 774.12± 40.63 832.26± 33.93 944.68± 34.15 1,083.76± 27.39 0.000
Iron 12.51± 1.74 11.6± 1.20 12.03± 1.11 15.44± 0.99 0.010
Sodium 2,811.60±239.42 3,473.43±292.96 3,585.68±324.34 4,349.79±278.14 0.000
Potassium 2,227.31±157.09 2,257.72±131.85 2,352.34±130.01 2,650.64±113.34 0.002
Vitamin A 3,611.85±141.78 3,538.81± 83.09 3,352.34± 85.44 3,650.64± 81.43 0.565
Carotene 6,025.36±831.42 5,528.53±483.76 6,230.49±502.00 6,309.3±474.59 0.384
Retinol 46.42± 6.52 15.43± 8.73 57.08± 6.42 28.54± 4.95 0.047
Thiamin 0.83± 0.05 0.88± 0.04 2.06± 0.04 1.03± 0.04 0.001
Riboflavin 0.77± 0.05 0.73± 0.04 1.6± 0.04 0.8± 0.04 0.366
Niacin 10.28± 0.68 10.92± 0.57 11.82± 0.58 12.94± 0.47 0.001
Vitamin C 80.67± 8.11 81.90± 7.73 80.91± 7.11 84.69± 5.63 0.953
Note: 1) Energy from rice consumption (R1∼R4): R1(≤543), R2(543∼801), R3(801∼1,081), R4(1,081∼3,807); 2) P from generalized linear model for numerical after adjusted by sex and age variables, p<.05; 3) Numerical variables are given as means±S.E.
known to be associated with insulin resistance and type 2 diabetes, hyperlipemia, and hypertension, which are common- ly observed in the elderly. According to the 2010 National Health and Nutrition survey, there was also a correlation between bone mineral density and ASM/height2 in both men and women after adjusted for age, exercise, nutrition (for men β=0.027, p<0.001, for women β=0.016, p=0.002) (Lee et al., 2014). As a result, if we can reduce age-related and disease- related muscle loss in the high rice consumption group in both men and women, it is expected that the diet with rice popular as a stock will give a good influence to the muscle reduction and various chronic diseases can be prevented. The relation- ship between high carbohydrate intake and risk factors for metabolic diseases was very relevant in adults as shown in the analysis of US National Health and Nutrition Survey data
that the ratio of serum triglyceride to serum HDL-cholesterol increased when the carbohydrate energy intake rate was over 60%, and the risk of cardiovascular disease was low at 50∼ 60% (Tester, Laraia, Leung, & Mietus-Snyder, 2016).
In other studies of Korean adult population, the risk of metabolic syndrome was significantly higher when the energy intake rate of the carbohydrates and the dietary blood glucose index were higher in adult women (Woo, Shin, & Kim, 2014).
These characteristics suggest that high carbohydrate intake is associated with high triglyceride levels and low HDL-cholesterol concentrations (Chan et al., 2014). Data from the Framingham Heart Study, 398 elderly people aged 72∼92 showed a 2-fold increase in the risk of death (HR=1.9; 95% CI, 1.3∼2.6) for two years, as reduced 1 kg/m2 of lean mass (SMI) (Ho et al., 2016). In this study, high rice intake group showed significan-
tly reduced sarcopenia prevalence. Therefore, for the elderly, it can be expected to obtain an effect to prevent muscle decreased to take rich in rice diet, eventually prevent chronic disease. Other interesting results are shown in Table 3 and Table 4 for both males and females aged over 60 years of age with good nutritional status in the high-intake group. It is presumed that the elderly Korean women over 60 years old are not able to enjoy diverse high-quality dietary habits due to the lack of economic conditions. In this study, the elderly who are over 60 years old have higher energy intake, (1,943.96±86.60 vs. 2,363.31±75.25 in man) (1,223.63±55.82 vs. 1,953.86±46.77 in woman). On the other hand, intake of other nutrients was significantly higher. Men with higher rice intakes significantly consumed more total energy, carbohyd- rate, mineral, sodium and women significantly consumed more total energy, protein, carbohydrate, calcium, dietary fiber, mi- neral, phospho\rus, iron, sodium, potassium, retinol, thiamin, and niacin. According to a report by Kim et al. (2011). Nutri- tional status was significantly lower in males than in females in 13 large cities and small and medium-sized cities across the country. The worse was the degree of malnutrition as the age of the elderly women increased than that of the elderly men.
In developed countries, the elderly are atherosclerosis, obesity and high blood pressure due to excess nutrition concerns but the elderly have been reported to be more malnutrition pro- blems in South Korea (Lee, Kim, & Lee, 1998). Providers of care for dependent elderly individuals need to pay attention to overall diet quality, and not just total energy and protein intake. Indeed, a good quality diet has been associated with a lower risk of fragility, which is a significant risk factor in the development of disabilities (Morris & Jacques, 2013), which, in turn, are associated with higher costs to the health system. As such, a mediterranean-type dietary pattern may have a protective effect against age-associated physical disabilities (Tangney et al., 2011; Shubair, McColl, & Hanning, 2005).
By Yim & Lee (2004)’s report (Yim & Lee, 2004). In large cities, an small urban areas, nutritional status studies of tar- geted elderly were that woman is significantly poorer than men, and the degree of malnutrition in the elderly were more severe with aging. According to the study by Jung, a high per- centage of LDL and HDL cholesterol abnormalities who has taken over 60% high carbohydrate compared to total energy
rate were observed and the risk of cardiovascular disease was low at 50∼60% (Baik, 2011). High intake of carbohydrates or the glycemic index meal is significantly higher metabolic syndrome risk in Korean elderly women, because the high carbohydrate intake is asso- ciated with low HDL-cholesterol level and high triglyceride concentration (So & Yoo, 2015).
In the present study, higher rice intakes group showed significantly consumed more other nutrients as well as total energy. Recently, trends in Korean adults’ rice intake during the period from 1998 to 2005 was decreasing every year and resulting in the adoption of a western diet pattern, with a shift away from unrefined foods towards a diet higher in both plant-derived high PUFA and total fats and refined carbohy- drates. Although the traditional Korean diet has many healthy components, few studies have been conducted on the health advantages of the Korean dietary pattern. In addition, because the rice is still a carbohydrate meal, the impact of this is a need to look systematically effects on health risk factors in the Korean elderly. The major causes of chronic diseases are living habits of diet as well as genetic factors and environmental factors such as exercise, smoking, drinking, etc. If emerging epidemic of chronic diseases such as cardiovascular are pre- vented by diet, we can lower annual costs of treatment for patients
REFERENCES
Ahn, J. Y., & Ha, T. Y. (2010). Nutritional superiority of rice.
Food Preserv Process Ind, 9(2), 60-62.
Aoe, S., Ikenaga, T., Noguchi, H., Kohashi, C., Kakumoto, K., & Kohda, N. (2014). Effect of cooked white rice with high β-glucan barley on appetite and energy intake in heal- thy Japanese subjects: A randomized controlled trial. Plant Foods for Human Nutrition, 69(4), 325-330.
Appel, L. J., Moore, T. J., Obarzanek, E., Vollmer, W. M., Svetkey, L. P., Sacks, F. M., & Lin, P. H. (1997). For the DASH collaborative research group: A clinical trial of the effects of dietary patterns on blood pressure. N Engl J Med, 336(16), 1117-1124.
Baik, I. K. (2011). Studies on dietary patterns in the preven- tion of metabolic syndrome. Food Ind Nutr, 16(2), 45-48.
Baumgartner, R. N., Koehler, K. M., Gallagher, D., Romero,
L., Heymsfield, S. B., Ross, R. R., & Lindeman, R. D.
(1998). Epidemiology of sarcopenia among the elderly in New Mexico. American Journal of Epidemiology, 147(8), 755-763.
Cha, H. M. (2010). A study on the trend analysis regarding the rice consumption of Korean. Woosong University, 96- 106.
Chan, T. F., Lin, W. T., Huang, H. L., Lee, C. Y., Wu, P. W., Chiu, Y. W., Huang, C. C., Tsai, S., Lin, C. L., & Lee, C. H. (2014) Consumption of sugar-sweetened beverages is associated with components of the metabolic syndrome in adolescents. Nutrients, 6(5), 2088-2103.
Chung, J. Y., Kang, H. T., Lee, D. C., Lee, H. R., & Lee, Y. J. (2013). Body composition and its association with cardiometabolic risk factors in the elderly: A focus on sar- copenic obesity. Archives of Gerontology and Geriatrics, 56(1), 270-278.
De Luca, D. A. E., Bonacci, S., & Giraldi, G. (2010). Aging populations: The health and quality of life of the elderly.
La Clinica Terapeutica, 162(1), 13-8.
Haigis, M. C., & Yankner, B. A. (2010). The aging stress re- sponse. Molecular Cell, 40(2), 333-344.
Heymsfield, S. B., Smith, R., Aulet, M., Bensen, B., Licht- man, S., Wang, J., & Pierson, R. N. (1990). Appendicular skeletal muscle mass: Measurement by dual-photon absor- ptiometry. The American Journal of Clinical Nutrition, 52 (2), 214-218.
Ho, J. E., Larson, M. G., Ghorbani, A., Cheng, S., Chen, M.
H., Keyes, M., Rhee, E. P., Clish, C. B., Vasan, R. S., Gerszten, R. E., & Wang, T. J. (2016). Metabolomic pro- files of body mass index in the framingham heart study reveal distinct cardiometabolic phenotypes. PLoS One, 11 (2), e0148361.
Kang, J. H., Kim, K. A., & Han, J. S. (2004). Korean diet and obesity. Journal of Korean Society for the Study of Obesity, 13(1), 34-41.
Kennedy, E., & Luo, H. (2015). Association between rice con- sumption and selected indicators of dietary and nutritional status using National Health and Nutrition Examination Survey 2007-2008. Ecol Food Nutr, 54(3), 224-239.
Kiefte-de, Jong J. C., Mathers, J. C., & Franco, O. H. (2014).
Nutrition and healthy ageing: The key ingredients. Procee-
dings of the Nutrition Society, 73(2), 249-259.
Kim, H. J., Lee, K. S., Eom, J. S., Lim, K. Y., Lee, & K.
W, Hong CH. (2011). Relation between nutritional risk and metabolic syndrome in the elderly. Arch Gerontol Geriatr, 52(1), e19-22.
Kim, I. S., Yang, M., Goo, T. H., Jo, C., Ahn, D. U., Park, J. H., & Kang, S. N. (2012). Radical scavenging-linked antioxidant activities of commonly used herbs and spices in Korea. International Journal of Food Sciences and Nu- trition, 63(5), 603-609.
Kim, S., Moon, S., & Popkin, B. M. (2000). The nutrition transition in South Korea. Am J Clin Nutr, 71(1), 44-53.
Lee, J. H, (1997). Decreasing rice consumption: Is it because rice is an inferior goods. Journal of Rural Development, 20(3), 1-14.
Lee, J. W., Kim, K. A., Lee, & M. S. (1998). Nutritional intake status of the elderly taking free congregate lunch meals compared to the middle-income class elderly. Korean Journal of Community Nutrition, 3(4), 594-608.
Lee, S. K., Lee, J. A., Kim, J. Y., Kim, Y. Z., & Park, H.
S. (2014) The risk factors of sarcopenia among Korean elderly men: based on 2009 Korean National Health and Nutrition Examination Survey Data. Korean J Obes, 23, 23-31.
Lim, S., Kim, J. H., Yoon, J. W., Kang, S. M., Choi, S. H., Park, Y. J., & Jang, H. (2010). Sarcopenic obesity: Pre- valence and association with metabolic syndrome in the Korean Longitudinal Study on Health and Aging (KLo- SHA). Diabetes Care, 33(7), 1652-1654.
Liu, S., Willett, W. C,, Stampfer, M. J., Hu, F. B., Franz, M., Sampson, L., Henkens, C. H., & Manson, J. E. (2000). A prospective study of dietary glycemic load, carbohydrate intake, and risk of coronary heart disease in US women.
Am J Clin Nutr, 71, 1455-1461.
Morris, M. S., & Jacques, P. F. (2013). Total protein, animal protein and physical activity in relation to muscle mass in middle-aged and older Americans. Br J Nutr, 109(7), 1294- 1303.
Mosle, M. K., Hassan, Q. K., & Chowdhury, E. H. (2015).
Application of remote sensors in mapping rice area and forecasting its production. Sensors (Basel), 15(1), 769-791.
Oh, C., & No, J. K. (2015). Study on white rice consumption
and metabolic risk factor in Korean elderly: Focused on muscle mass. Culinary Science and Hospitality Research, 21(5), 147-159.
Oh, C., Jho, S., No, J. K., & Kim, H. S. (2015). Body com- position changes were related to nutrient intakes in elderly men but elderly women had a higher prevalence of sar- copenic obesity in a population of Korean adults. Nutrition Research, 35(1), 1-6.
Park, J., Lee, J. S., Jang, Y. A., Chung, H. R., & Kim, J. (2011).
A comparison of food and nutrient intake between instant noodle consumers and non-instant noodle consumers in Korean adults. Nutrition Research and Practice, 5(5), 443- 449.
Shubair, M. M., McColl, R. S., & Hanning, R. M. (2005).
Mediterranean dietary components and body mass index in adults: the peel nutrition and heart health survey. Chronic Dis Can, 26(2-3), 43-51.
So, E. S., & Yoo, K. S. (2015). Waist circumference cutoff points for central obesity in the Korean elderly population.
J Appl Gerontol, 34(1), 102-117.
Son, S. H., Lee, H. J., Park, K., Ha, T. Y., & Seo, J. S. (2013).
Nutritional evaluation and its relation to the risk of meta- bolic syndrome according to the consumption of cooked rice and cooked rice with multi-grains in Korean adults:
Based on 2007-2008 Korean National Health and Nutrition Examination Survey. Korean J Community Nutr, 18(1), 77- 87.
Tangney, C. C., Kwasny, M. J., Li, H., Wilson, R. S., Evans, D. A., & Morris, M. C. (2011). Adherence to a mediterra-
nean-type dietary pattern and cognitive decline in a com- munity population. Am J Clin Nutr, 93(3), 601-607.
Tavani, A., Bosetti, C., Negri, E., Augustin, L. S., Jenkins, D. J. A., & La, Veccia, C. (2003). Carbohydrates, dietary glycemic load and glycemic index, and risk of acute my- ocardial infarction. Heart, 89, 722-726.
Tester, J. M., Laraia, B. A., Leung, C. W., & Mietus-Snyder, M. L. (2016). Dyslipidemia and food security in low-income US adolescents: National Health and Nutrition Examination Survey, 2003-2010. Prev Chronic Dis, 11(13), E22.
The Fifth Korea National Health and Nutrition Examination Survey (KNHANES V-1). (2010). Korea Centers for Di- sease Control and Prevention.
Watanabe, Y., Saito, I., Asada, Y., Kishida, T., Matsuo, T., Yamaizumi, M., & Kato, T. (2013). Daily rice intake strong- ly influences the incidence of metabolic syndrome in Japanese men aged 40-59 years. Journal of Rural Medicine, 8(1), 161.
Woo, H. D., Shin, A., & Kim, J. (2014). Dietary patterns of Korean adults and the prevalence of metabolic syndrome:
A cross-sectional study. PLoS One, 9(11), e111593.
Yim, K. S., & Lee, T. Y. (2004). Sociodemographic factors associated with nutrients intake of elderly in Korea. Ko- rean Journal of Nutrition, 37(3), 210-222.
Received:
Revised:
Accepted:
04 January, 2017 20 January, 2017 23 January, 2017