1
Food & Nutrition Research 2018. © 2018 Jae-Ho Lee et al. This is an Open Access article distributed under the terms of the Creative Commons Attribution 4.0 International License (http://
ORIGINAL ARTICLE
Dietary intake of pantothenic acid is associated with cerebral amyloid burden in patients with cognitive impairment
Jae-Ho Lee
1, Soo-Yeon Ahn
1, Hyon Ah Lee
2, Kyoung Sook Won
3, Hyuk Won Chang
4, Jungsu S. Oh
5and Hae Won Kim
3*
1
Department of Anatomy, Keimyung University Dongsan Medical Center, Daegu, Republic of Korea;
2Department of Neurology, Keimyung University Dongsan Medical Center, Daegu, Republic of Korea;
3Department of Nuclear Medicine, Keimyung University Dongsan Medical Center, Daegu, Republic of Korea;
4Department of Radiology, Semyung Radiology Clinic, Gumi, Republic of Korea;
5Department of Nuclear Medicine, Asan Medical Center, University of Ulsan College of Medicine, Seoul, Republic of Korea
Abstract
Alzheimer’s disease (AD) is a neurodegenerative disease characterized by the deposition of amyloid-β pep- tide (Aβ) in diffuse and neuritic plaques. Previous research has suggested that certain vitamins may pre- vent this process. In the present study, we evaluated the relationship between vitamin intake and cerebral Aβ burden in patients with cognitive impairment. This study included 19 patients with subjective cogni- tive impairment and 30 patients with mild cognitive impairment. All patients underwent brain MRI and
18
F-florbetaben positron emission tomography. The Food Frequency Questionnaire was used to evalu- ate dietary intake of the 15 vitamins. Intake of vitamin B6 (p = 0.027), vitamin K (p = 0.042), vitamin A (p = 0.063), riboflavin (p = 0.063), β-carotene (p = 0.081), pantothenic acid (p = 0.092), and niacin (p = 0.097) was higher in the Aβ-positive group than in the Aβ-negative group. Multivariate linear regression analy- sis revealed that pantothenic acid intake was an independent determinant of cerebral Aβ burden (β = 0.287, p = 0.029). No significant correlations were observed between cerebral Aβ burden and the intake of other vitamins.
Our findings demonstrated that pantothenic acid intake may be associated with increased cerebral Aβ burden in patients with cognitive impairment. These results may offer insight into potential strategies for AD prevention.
Keywords: Alzheimer’s disease; mild cognitive impairment; pantothenic acid; subjective cognitive impairment; vitamin; diet
Received: 29 April 2018; Revised: 25 September 2018; Accepted: 5 November 2018; Published: 10 December 2018
T he prevalence and economic costs of Alzheimer’s disease (AD) have continued to increase along with increases in the number of older adults in the population (1). Although the diagnosis of AD is primarily based on clinical symptoms, recent advances in genetics and neuroimaging have indicated that these modalities may aid in the diagnosis of AD (2–4). Additional research has suggested that positron emission tomography (PET) with 18F-florbetaben (
18F-FBB) can be used to identify cerebral amyloid-β (Aβ) pathology in patients undergoing assessments for AD (5, 6). They showed a sensitivity of 80% and a specificity of 91% of PET scan for the diagno- sis of Alzheimer’sdisease (6).
Although the etiology of the disease remains to be fully established, evidence suggests that the Aβ peptide plays an important role in the pathogenesis of AD (5–7). In ad- dition, several risk factors for AD have been identified,
including age, certain genetic alleles, and specific nutri- tional characteristics (8–12). Accumulating evidence in- dicates that diet – one of the most important modifiable lifestyle factors – may play a role in preventing or delaying cognitive decline and AD (13–16). Epidemiological stud- ies have reported that low intake of vitamins increases the risk of AD, and that several vitamins may be associated with the pathological processes of AD (17–20). However, whether vitamin intake influences the accumulation of cerebral Aβ remains to be investigated.
Previous studies have established the validity of reliabil-
ity on the Food Frequency Questionnaire (FFQ), which
was developed to assess the association between chronic
diseases and diet in Korean populations (21, 22). In the
present study, we aimed to evaluate the association be-
tween vitamin intake and cerebral A β burden in patients
with cognitive impairment using
18F-FBB PET and the
Jae-Ho Lee et al.
FFQ. We hope that the results of our study will improve our understanding of AD pathogenesis, which may aid in the treatment and prevention of AD.
Materials and methods Study population
The present prospective study included consecutive patients (age range: 50–90 years) who had visited the memory clinic at Keimyung University Dongsan Med- ical Center (Daegu, Korea) for the evaluation of cogni- tive function between June 2015 and January 2017. All patients underwent standard clinical and neuropsycho- logical evaluations. All patients were divided into syn- dromal categories based on the 2018 National Institute on Aging-Alzheimer’s Association Research Framework:
subjective cognitive impairment (SCI) and mild cognitive impairment (MCI) (23). The Mini-Mental State Examina- tion (MMSE), Digit Span Memory Test, Korean-Boston Naming Test (K-BNT), Rey-Osterrieth Complex Figure Test, and Recognition Trial (RCFT) were used to assess cognitive function (24). SCI was defined as subjective memory disorder wherein patients report worsening of their thinking abilities, including memory, but the decline cannot be verified by the tests. MCI was defined as a con- dition in which subjects had mild but measurable changes in thinking abilities that are noticeable to the person af- fected and to family members and friends, but do not affect the individual’s ability to carry out everyday activi- ties (2). All participants underwent FFQ, brain magnetic resonance imaging, and
18F-FBB PET within 4 weeks of visiting the clinic. Patients with AD or an MMSE score
<20 were excluded to ensure the reliability of the FFQ.
Patients with conditions that could affect cognition (e.g.
vascular dementia, a history of psychiatric episodes or substance abuse, or a previous diagnosis of dementia) were also excluded. And patients with other neurodegen- erative diseases (e.g. Parkinson’s disease); inflammatory brain diseases (multiple sclerosis); medications history such as sedatives, tranquilizers, and anticholinergics; and cancers were also excluded. The study was approved by the Institutional Review Board of Dongsan Medical Cen- ter, and written informed consent was obtained from all participants or caregivers.
Dietary assessment
The categories listed in the FFQ were based on ques- tions from the 2005 Korean Health and Nutrition Survey.
A well-trained dietary interviewer used the FFQ to record participants’ typical dietary intake. The questionnaire consisted of a list of foods with standard serving sizes, for which patients were requested to select from among nine frequency categories: three times daily, twice daily, once daily, five or six times weekly, three or four times weekly,
once or twice weekly, two or three times monthly, once monthly, and never or seldom. Portion sizes were classi- fied into three categories (i.e. small, medium, and large) based on the patient’s intake in relation to an appropri- ately defined unit (e.g. cup or bowl). Dietary intake of nu- trients and food groups was assessed using computerized assessment software (CAN-Pro 4.0, Korean Nutrition Society, Seoul, Korea).
Amyloid PET
A PET/CT system (Biograph mCT-64, Siemens Healthcare, Knoxville, TN) was used to acquire three- dimensional
18F-FBB PET images 90–100 min after the intravenous injection of
18F-FBB (300 MBq). Nonen- hanced, low-dose CT was performed for attenuation correction and localization. A light, foam-rubber holder was used for fixation of the head. The PET images were subjected to iterative reconstruction using ordered sub- set expectation maximization. Attenuation correction of PET images was performed using attenuation data from the CT images.
Quantitative analyses were conducted on volumes of in- terest (VOI) using PMOD software (PMOD Technologies Ltd., Zurich, Switzerland), as previously described (5).
Image processing was performed using SPM12 (Well- come Department of Imaging Neuroscience, Institute of Neurology, University College London) implemented in MATLAB 2013a (MathWorks Inc., MA, USA) and MRIcro version 1.37 (Chris Rorden, Columbia, SC, USA, www.mricro.com).
Each MRI and PET image was co-registered using a
standard mutual information algorithm and spatially nor-
malized. An automated anatomical labeling template was
subsequently applied for standardized sampling of count
densities in VOIs. VOIs were individually defined in the bi-
lateral frontal, temporal, and parietal cortices; anterior and
posterior cingulate; and cerebellar cortex. Standardized
uptake values were obtained from the regional VOIs, and
regional standardized uptake value ratios (SUVRs) were
calculated by dividing the standardized uptake values for
the different target regions by that for the reference region
(i.e. cerebellar cortex). A composite SUVR was calculated
as the mean of the values for the frontal, parietal, lateral,
temporal, and occipital cortices as well as the anterior and
posterior cingulate, as previously described (6). Regional
and composite SUVRs were used to evaluate the relation-
ship between vitamin intake and cerebral A β burden. Pa-
tients with a composite SUVR ≥ 1.5, which is considered
indicative of an abnormally high cerebral Aβ burden, were
considered positive for A β (Aβ-positive group), while those
with a composite SUVR < 1.5 were considered negative for
A β (Aβ-negative group) (6). We then compared differences
in vitamin intake between the A β-positive and Aβ-negative
groups. This analysis was performed in blinded manner.
Statistical analyses
All statistical analyses were performed using IBM SPSS statistics for Windows, V.20 (IBM Corp). Mann–Whitney U tests, Kruskal–Wallis tests, and simple correlation anal- yses were used to analyze associations between variables.
We also assessed the relationship between vitamin intake, MMSE score, and SUVR (cerebral A β burden) using Pearson’s correlation coefficients and multiple linear re- gression analyses adjusted for age, sex, and body mass index (BMI). APOE4 as a covariate in the primary model was excluded to avoid variance inflation given its high correlation with cerebral A β burden (25, 26). A P-value of < 0.05 was considered statistically significant. Data for all study variables are expressed as means ± standard deviations.
Results
A total of 49 patients with cognitive impairment were enrolled in the present study. Among them, 19 patients were clinically diagnosed with SCI, while the remaining 30 were diagnosed with MCI. The demographic, clini- cal, and biochemical characteristics of the SCI and MCI groups are shown in Table 1. MMSE scores were signifi- cantly lower in patients with MCI than in those with SCI (p < 0.001). Increased cerebral Aβ burden was observed in 10.5% (2/19) of patients with SCI and 23.3% (7/30) of patients with MCI, although there was no significant dif- ference between the groups (p = 0.247). A negative cor- relation between cerebral Aβ burden and MMSE score was shown (r = −0.395, p = 0.007).
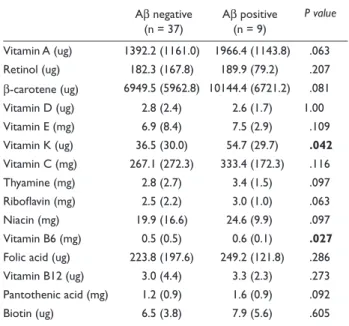
Vitamin intake for the A β-negative and Aβ- positive groups is presented in Table 2. Intake of vitamin K (p = 0.042) and vitamin B6 (p = 0.027) was significantly higher in the Aβ-positive group than in the Aβ-negative group. Similar tendencies were observed for vitamin A (p = 0.063), β-carotene (p = 0.081), riboflavin (p = 0.063), niacin (p = 0.097), and pantothenic acid (p = 0.092), al- though these results did not reach statistical significance.
When stratifying patients into SCI and MCI, a correlation between cerebral A β burden and intake of pantothenic acid was found not in SCI (r = −0.126, p = 0.618) but in MCI (r = 0.494, p = 0.008).
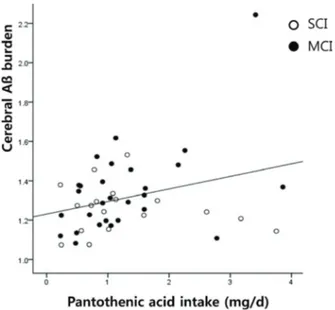
Pearson’s correlation analysis revealed that the intake of pantothenic acid was positively correlated with com- posite SUVR(r = 0.303, p = 0.041; Fig.1). When stratified by SUVR, this correlation was found not in A β- negative group (r = 0.034, p = 0.844) but in Aβ-positive group (r = 0.789, p = 0.012). No additional associations were observed between vitamin intake and composite SUVR.
The results of the multiple linear regression analysis adjusted for age, sex, and BMI are presented in Table 3. In- take of pantothenic acid was identified as an independent determinant of composite SUVR(R
2= 0.289, p = 0.029).
No such independent relationships were observed between composite SUVR and other vitamins.
We then divided patients into two groups based on me- dian pantothenic acid intake (1.27 mg), following which we compared regional cerebral Aβ burden between pa- tients with high and low pantothenic acid intake (Table 4).
In all cerebral regions, regional SUVR was significantly higher in the high-intake group than in the low-intake group. Multivariate analyses adjusted for age, sex, and BMI revealed that regional SUVR in the frontal, parietal, and temporal cortices was associated with pantothenic acid intake (Table 5). Although a similar tendency was observed in the cingulate cortices, this result did not reach statistical significance (right, p = 0.073 and left, p = 0.063).
Table 1. Characteristics of patients
aSCI MCI P value
(n = 19) (n = 30)
Age, y 62.7 (5.5) 64.3 (9.7) 0.540
Female, % 46.4 53.6 0.763
BMI 24.3 (4.4) 23.6 (2.1) 0.479
Education, y 14.33 (3.5) 12.8 (5.6) 0.310
APOE4+, % 21.8 24.3 0.610
SUVR for Aβ 1.26 (0.12) 1.35 (0.23) 0.140
MMSE 28.9 (1.2) 25.7 (2.6) < 0.001
Digit span 11.7 (2.3) 10.0 (2.2) < 0.001
K-BNT 51.8 (3.9) 46.3 (9.4) < 0.001
RCFT 33.0 (2.4) 30.6 (5.3) < 0.001
a
All values are means (SD). K-BNT: Korean-Boston Naming Test; RCFT:
Rey-Osterrieth Complex Figure Test and Recognition Trial.
Table 2. Comparisons of vitamin intake between Aβ negative and Aβ positive groups
aAβ negative
(n = 37) Aβ positive (n = 9)
P value
Vitamin A (ug) 1392.2 (1161.0) 1966.4 (1143.8) .063 Retinol (ug) 182.3 (167.8) 189.9 (79.2) .207 β-carotene (ug) 6949.5 (5962.8) 10144.4 (6721.2) .081 Vitamin D (ug) 2.8 (2.4) 2.6 (1.7) 1.00
Vitamin E (mg) 6.9 (8.4) 7.5 (2.9) .109
Vitamin K (ug) 36.5 (30.0) 54.7 (29.7) .042 Vitamin C (mg) 267.1 (272.3) 333.4 (172.3) .116
Thyamine (mg) 2.8 (2.7) 3.4 (1.5) .097
Riboflavin (mg) 2.5 (2.2) 3.0 (1.0) .063
Niacin (mg) 19.9 (16.6) 24.6 (9.9) .097
Vitamin B6 (mg) 0.5 (0.5) 0.6 (0.1) .027 Folic acid (ug) 223.8 (197.6) 249.2 (121.8) .286 Vitamin B12 (ug) 3.0 (4.4) 3.3 (2.3) .273 Pantothenic acid (mg) 1.2 (0.9) 1.6 (0.9) .092
Biotin (ug) 6.5 (3.8) 7.9 (5.6) .605
a
All values are means (SD).
Jae-Ho Lee et al.
Discussion
In the present study, we aimed to evaluate the relation- ship between vitamin intake and cerebral A β burden in patients with cognitive impairment. Some of SCI pop- ulation and patients with MCI had A β positive result.
Although subjects with A β positive are not cognitively impaired, these would be changed into dementia within 20 years. Our results indicated that cerebral A β burden was positively associated with dietary intake of pantothenic acid in patients with MCI and SCI. Interestingly, subjects with A β positive showed this correlation with more sig- nificance. Furthermore, higher intake of pantothenic acid
from food sources was linearly associated with cerebral Aβ burden in various brain regions, even after controlling for multiple covariates.
In general, humans require adequate amounts of four fat-soluble vitamins (A, D, E, K) and nine water-soluble vitamins, which comprise vitamin C and the eight B vi- tamins: thiamine (B
1), riboflavin (B
2), niacin (B
3), panto- thenic acid (B
5), vitamin B
6, vitamin B
7,folate (B
9), and vitamin B
12(17, 18). Pantothenic acid (B
5) is a substrate for the synthesis of the ubiquitous coenzyme A (CoA) (27). Beyond its role in oxidative metabolism, CoA con- tributes to the structure and function of brain cells via its involvement in the synthesis of cholesterol, amino acids, phospholipids, and fatty acids (28, 29). Notably, panto- thenic acid is also involved in the synthesis of multiple neurotransmitters and steroid hormones via pathways in- volving CoA (28).
Supplementation of several vitamins such as folate, vitamin B
12, and vitamin B
6has been recommended for the prevention of cognitive decline (14–19). In contrast, our results indicate that increased pantothenic acid intake may increase cerebral A β burden. And over intakes of Vitamin K and Vitamin B6 tended to be risk factor for A β burden uptake. Vitamin K and Vitamin B6 tended to Table 3. The relationships of cerebral β-amyloid burden with vita-
min intake
Adjusted R
2Standardized β P value
Vitamin A — .115 .398
Retinol — .073 .593
β-carotene — .103 .450
Vitamin D — .100 .456
Vitamin E — .079 .564
Vitamin K — .140 .306
Vitamin C — −.010 .942
Thyamine — .104 .443
Riboflavin — .103 .451
Niacin — .108 .429
Vitamin B6 — .133 .333
Folic acid — .126 .362
Vitamin B12 — .132 .326
Pantothenic acid — .287 .029
Biotin — .096 .487
Table 4. Comparison of regional SUVR between pantothenic acid low-intake and high-intake groups
aRegion Side pantothenic acid P value
Low-intake (n = 19)
High-intake (n = 30)
Frontal lobe Rt 1.15 (0.11) 1.29 (0.21) 0.01 Lt 1.17 (0.12) 1.32 (0.21) 0.01 Parietal lobe Rt 1.17 (0.14) 1.29 (0.29) 0.06 Lt 1.25 (0.13) 1.39 (0.32) 0.04 Temporal lobe Rt 1.22 (0.12) 1.33 (0.19) 0.02 Lt 1.31 (0.12) 1.43 (0.24) 0.03 Cingulate Rt 1.56 (0.16) 1.72 (0.27) 0.02 Lt 1.44 (0.17) 1.60 (0.35) 0.05
a