Population Pharmacokinetic Analysis of Doripenem after Intravenous Infusion in Korean Patients with Acute Infections
Dong-Hwan Lee,
a,bYong Kyun Kim,
cKyubok Jin,
dMyoung Joo Kang,
eYoung-Don Joo,
eYang Wook Kim,
fYoung Soo Moon,
gJae-Gook Shin,
hSungmin Kiem
cDepartment of Clinical Pharmacology, Pusan National University Hospital, Busan, Republic of Korea
a; (Bio)Medical Research Institute, Pusan National University Hospital, Busan, Republic of Korea
b; Division of Infectious Diseases, Department of Internal Medicine, Inje University Haeundae Paik Hospital, Inje University College of Medicine, Busan, Republic of Korea
c; Division of Nephrology, Keimyung University Dongsan Medical Center, Daegu, Republic of Korea
d; Division of Hemato-Oncology, Department of Internal Medicine, Inje University Haeundae Paik Hospital, Inje University College of Medicine, Busan, Republic of Korea
e; Division of Nephrology, Department of Internal Medicine, Inje University Haeundae Paik Hospital, Inje University College of Medicine, Busan, Republic of Korea
f; Division of Gastroenterology, Department of Internal Medicine, Inje University Haeundae Paik Hospital, Inje University College of Medicine, Busan, Republic of Korea
g; Department of Clinical Pharmacology, Inje University College of Medicine, Busan, Republic of Korea
hABSTRACT We investigated the population pharmacokinetics (PK) of doripenem in Korean patients with acute infections and determined an appropriate dosing regi- men using a Monte Carlo simulation for predicting pharmacodynamics (PD). Patients (n ⫽ 37) with a creatinine clearance (CL
CR) of 20 to 50 ml/min or ⬎50 ml/min who received a 250-mg or 500-mg dose of doripenem over the course of 1 h every 8 h, respectively, were included in this study. Blood samples were taken predosing and 0 h, 0.5 h, and 4 to 6 h after the fourth infusion. A nonlinear mixed-effect modeling tool was used for the PK analysis and pharmacodynamic simulation; doripenem PK were well described by a one-compartment model. The population mean values of the body weight (WT)-normalized clearance (CL/WT) and the body weight-normalized volume of distribution (V/WT) were 0.109 liter/h/kg of body weight (relative standard error, 9.197%) and 0.280 liter/kg (relative standard error, 9.56%), respectively. Dorip- enem CL was significantly influenced by CL
CR. The proposed equation to estimate doripenem CL in Korean patients was CL/WT ⫽ 0.109 ⫻ WT ⫻ (CL
CR/57)
0.688, where CL/WT is in liters per hour per kilogram. CL in Korean patients was expected to be lower than that in Caucasian patients, regardless of renal function. The Monte Carlo simulation showed that 90% attainment of target PK/PD magnitudes could be achieved with the usual dosing regimens when the MIC was ⱕ1 mg/liter. However, prolonged infusions (4 h) should be considered, especially when patients have aug- mented renal function and for patients infected with pathogens with a high MIC.
Our results provide an individualized doripenem dosing regimen for patients with various renal functions and for patients infected with bacteria with decreased sus- ceptibility.
KEYWORDS doripenem, population pharmacokinetics, Monte Carlo simulation, clearance, probability of target attainment, prolonged infusion, augmented renal function, MIC
D oripenem is the latest available carbapenem and has a broad antibacterial spec- trum against Gram-positive and Gram-negative pathogens. It is indicated for the treatment of complicated intra-abdominal infections, complicated urinary tract infec- tions, and/or nosocomial pneumonia, including ventilator-associated pneumonia (1).
Received 11 October 2016 Returned for modification 26 November 2016 Accepted 12 February 2017
Accepted manuscript posted online 21 February 2017
Citation Lee D-H, Kim YK, Jin K, Kang MJ, Joo Y-D, Kim YW, Moon YS, Shin J-G, Kiem S. 2017.
Population pharmacokinetic analysis of doripenem after intravenous infusion in Korean patients with acute infections. Antimicrob Agents Chemother 61:e02185-16. https://
doi.org/10.1128/AAC.02185-16.
Copyright © 2017 American Society for Microbiology. All Rights Reserved.
Address correspondence to Sungmin Kiem, smkimkor@paik.ac.kr.
D.-H.L. and Y.K.K. contributed equally to this article.
crossm
on March 22, 2018 by Keimyung University Medical Library http://aac.asm.org/ Downloaded from
Doripenem has potency similar to that of imipenem against Gram-positive bacteria and potency similar to that of meropenem against Gram-negative bacteria in vitro (2–5).
Moreover, in nonclinical and clinical studies, the risk that it would cause seizures was shown to be lower than that for other carbapenems (6, 7).
To improve clinical efficacy and prevent the development of resistance or adverse events, the dosing of doripenem is important. The recommended dose of doripenem is initially determined on the basis of the glomerular filtration rate (GFR) and is maintained to achieve a maximized time in which the free drug concentrations exceeds the MIC (fT
MIC) (8, 9). However, the doripenem dosing regimen should be individualized on the basis of each patient’s characteristics. For example, when sepsis and, in particular, when septic shock induce a greater volume of distribution (V) and a greater total body clearance (CL), which contribute to lower plasma concentrations of hydrophilic antibi- otics, such as doripenem, the probability of target attainment (PTA) may be compro- mised due to a shorter fT
MIC(10–12). In addition, race is an important individual characteristic that may affect the pharmacokinetics (PK) or pharmacodynamics (PD) of antimicrobials, possibly owing to differences in fat distribution, metabolism, and anti- biotic CL (13, 14).
Several recent studies analyzing the PK of doripenem in Asian populations (15, 16) reported equations for calculating antibiotic CL according to renal function, reflected by creatinine clearance (CL
CR); however, most studies have been conducted in Western populations (12, 17, 18). To our knowledge, there are no studies that have specifically addressed the population PK of doripenem in Korean patients with infections. Inves- tigations using this type of approach to characterize interethnic differences in PK models may be worthwhile to provide physicians with information that will help them optimize antimicrobial therapies in various populations.
We have previously performed studies to develop and validate the individualized dosing of important antibiotics in Korean patients (19). In this study, we aimed to determine the PK profiles of doripenem and equations for doripenem CL in Korean patients with acute infections and various renal functions and investigated appropriate dosing regimens for doripenem using population PK analysis and a Monte Carlo simulation for predicting the PD of doripenem.
(This study was presented in part at the 55th Interscience Conference on Antimi- crobial Agents and Chemotherapy/International Congress of Chemotherapy and Infec- tion 2015, San Diego, CA, 17 to 21 September 2015.)
RESULTS
Patients. The demographic characteristics of the 37 patients (10 male and 27 female patients) are described in Table 1. For this analysis, 36 and 112 plasma samples from the 250-mg and 500-mg groups, respectively, were used. Serum creatinine levels were 1.25 ⫾ 0.470 and 0.800 ⫾ 0.220 mg/dl for the 250-mg and 500-mg groups, respectively.
CL
CRs (as determined by the Cockcroft-Gault equation) were 38.3 ⫾ 10.9 and 75.9 ⫾ 34.5 ml/min for the 250-mg and 500-mg groups, respectively.
Population PK analysis. The time course of the doripenem concentrations was well described by a one-compartment model. The basic PK parameters were weight (WT), body weight-normalized total body clearance (CL/WT), and body weight-normalized volume of distribution (V/WT). CL
CRwas the only significant covariate for CL/WT (change in the objective function values [ΔOFV] ⫽ ⫺9.89).
Population mean values for CL/WT and V/WT were 0.109 liter/h/kg (relative standard error, 8.57%) and 0.280 liter/kg (relative standard error, 9.60%), respectively (Table 2).
The proposed equation to estimate the CL of doripenem in Korean patients in this study was CL/WT ⫽ 0.109 ⫻ WT ⫻ (CL
CR/57)
0.688(where CL/WT is in liters per hour per kilogram), which differed from an equation developed for Caucasian patients, CL ⫽ 13.6 ⫻ (CL
CR/98)
0.659(where CL is in liters per hour) (17) (Fig. 1). The coefficients of variation (CVs) of the interindividual variability for CL/WT and V/WT were 55.0% (relative standard error, 14.4%) and 47.3% (relative standard error, 21.6%), respectively (Table 2).
on March 22, 2018 by Keimyung University Medical Library http://aac.asm.org/ Downloaded from
Residual variability was best explained by a Poisson error model, defined as Y
ij⫽ Y
ij,PRED⫹
ij⫻ Y
ij,PRED, where Y
ijis the jth concentration in individual i, Y
ij,PREDis the jth predicted concentration in individual i, and
ijis the random residual effect for the jth concentration in individual i distributed as a normal distribution with a mean of 0 and a variance of
2.
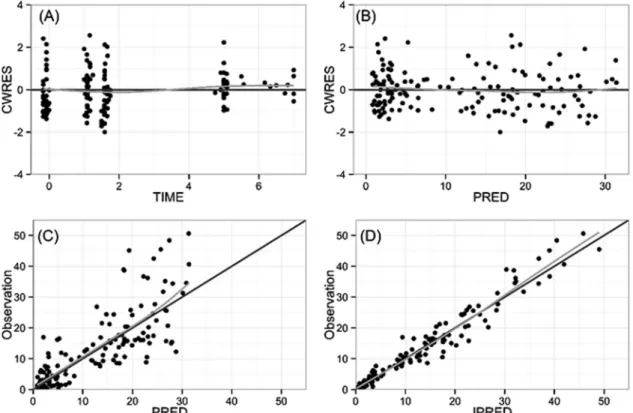
Goodness-of-fit plots for the final PK model indicated unbiased results, although there was underprediction for a few high concentrations (Fig. 2).
Most of the observed data were within the 90% prediction interval in the visual predictive check, and 50th percentile lines for observations and simulated concentra- tions nearly overlapped, indicative of an adequate model (Fig. 3).
PD target. When the PTA for the current dosing regimens (for a CL
CRof ⬎50 ml/min, 500 mg every 8 h by intravenous [i.v.] infusion over 1 h; for 30 ml/min ⱕ CL
CR⬍ 50 ml/min, 250 mg by i.v. infusion every 8 h over 1 h; for 10 ml/min ⬍ CL
CR⬍ 30 ml/min, 250 mg by i.v. infusion every 12 h) were simulated using a Monte Carlo simulation with the final model, the current empirical dosing regimens were optimum when the MICs were below 1 g/ml (Fig. 4). Since the four CVs (0%, 10%, 20%, and 30%) for MICs represented insignificant differences, the next Monte Carlo simulations investigated dosing regimens for personalized treatment and were conducted with a 0% CV.
TABLE 1 Demographics of study patients
aCharacteristic
Value(s) for the following group:
Total 250-mg dose 500-mg dose
Sex (no. of males/no. of females) 10/27 3/6 7/21
Mean ⫾ SD age (yr) 61.7 ⫾ 17.9 70.9 ⫾ 16.1 58.8 ⫾ 17.7
Mean ⫾ SD wt (kg) 59.8 ⫾ 12.4 55.1 ⫾ 13.3 61.3 ⫾ 11.9
Mean ⫾ SD ht (cm) 161 ⫾ 9.20 159 ⫾ 8.40 162 ⫾ 9.40
Mean ⫾ SD BMI (kg/m
2) 22.9 ⫾ 3.60 21.6 ⫾ 3.30 23.3 ⫾ 3.60 Mean ⫾ SD Scr concn (mg/dl) 0.910 ⫾ 0.350 1.25 ⫾ 0.470 0.800 ⫾ 0.220 Mean ⫾ SD CL
CR(ml/min) 66.7 ⫾ 34.4 38.3 ⫾ 10.9 75.9 ⫾ 34.5 Median (range) APACHE II score 7 (0–15) 9 (6–13) 6 (0–15) Median (range) Glasgow coma scale 15 (8–15) 15 (14–15) 15 (8–15) No. of patients with:
Sepsis 30 6 24
Severe sepsis 7 3 4
Infection
Pyelonephritis 27 6 21
Intra-abdominal infection 9 3 6
Neutropenic fever 1 0 1
a
Abbreviations: BMI, body mass index; Scr, serum creatinine; APACHE II, Acute Physiology and Chronic Health Evaluation II.
TABLE 2 Population PK parameter estimates of final model for doripenem
aParameter Estimates RSE (%) Bootstrap median (95% CI
b) Structural model
CL ⫽
1⫻ WT ⫻ 共CL
CR/57 兲
2
1(liter/h/kg) 0.109 8.57 0.109 (0.0903–0.128)
20.688 22.9 0.693 (0.334–1.04)
V (liter/kg) 0.280 9.60 0.276 (0.235–0.342)
Interindividual variability
CL(%) 55.0 14.4 52.5 (37.6–69.2)
V(%) 47.3 21.6 45.3 (29.7–70.0)
Residual error (
Poisson) 0.633 7.50 0.624 (0.532–0.716)
a
RSE, relative standard error; CL, doripenem CL; WT, weight (in kilograms); CL
CR, creatinine clearance;
V, volume of distribution; CI, confidence interval.
b
The 95% confidence intervals were estimated with 1,000 resampled data sets using the final population PK model.
on March 22, 2018 by Keimyung University Medical Library http://aac.asm.org/ Downloaded from
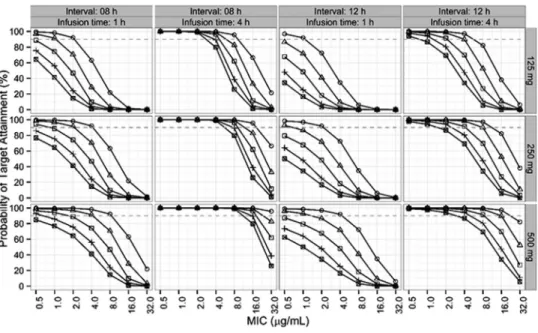
Figure 5 describes the Monte Carlo simulation results, which were generated for a fixed weight of 60 kg, three doses (125, 250, and 500 mg), four ranges of renal function (10 ml/min ⬍ ml/min CL
CR⬍ 30 ml/min, 30 ml/min ⱕ CL
CRⱕ 50 ml/min, 50 ml/min ⱕ CL
CR⬍ 90 ml/min, 90 ml/min ⱕ CL
CR⬍ 130 ml/min, and 130 ml/min ⱕ CL
CR⬍ 170 ml/min), two infusion times (1 h and 4 h), two dosing intervals (8 h and 12 h), and seven MICs (0.5, 1, 2, 4, 8, 16, and 32 g/ml). In the case of patients with a CL
CRof 10 to 30 ml/min, a dosing regimen of 125 mg every 8 h by i.v. infusion over 1 h was optimum FIG 1 Comparison of doripenem clearances between Caucasian and Korean patients (when calculated for patients with a body weight of 70 kg). *, data are from reference 17.
FIG 2 Goodness-of-fit plots: (A) conditional weighted residuals (CWRES) versus time; (B) conditional weighted residuals (CWRES) versus population model-predicted concentration (PRED); (C) observed concentration versus population model-predicted concentration (PRED); (D) observed concentration versus individual model-predicted concentration (IPRED). Gray lines, smooth curves.
on March 22, 2018 by Keimyung University Medical Library http://aac.asm.org/ Downloaded from
when the MIC was 2 g/ml or less. In the case of patients with a CL
CRof 30 to 50 ml/min, a dosing regimen of 250 mg every 8 h by i.v. infusion over 1 h was suboptimal when the MIC was equal to or greater than 4 g/ml. If the patient had a normal renal function (CL
CR⬎ 90 ml/min), a dosing regimen of 500 mg every 12 h by i.v. infusion over 4 h was superior to one of 500 mg every 8 h by i.v. infusion over 1 h. The infusion of 500 mg every 8 h by i.v. infusion for 1 h was inappropriate for patients with augmented renal clearance (130 ml/min ⱕ CL
CR⬍ 170 ml/min) (20), whereas the infusion of 500 mg every 8 h by i.v. infusion over 4 h was appropriate.
Safety. No patients experienced adverse events after the administration of dorip- enem.
FIG 3 Visual predictive check for 250-mg (left) and 500-mg (right) dosing groups by the use of simulated concentrations and 1,000 virtual data sets. Open circles, observed concentrations; solid lines, 95th, 50th, and 5th percentiles for observations;
dashed lines, 95th, 50th, and 5th percentiles for simulated concentrations; shaded areas, 95% confidence intervals for the 95th, 50th, and 5th percentiles for simulated concentrations.
FIG 4 Probabilities of target attainment (fT
MICabove 40%) with current dosing regimens for simulated patients and various MICs with CVs of 0%, 10%, 20%, and 30% (1,000 patients for each MIC).
on March 22, 2018 by Keimyung University Medical Library http://aac.asm.org/ Downloaded from
DISCUSSION
In the present study, population PK data for doripenem in Korean patients with acute infections were analyzed. The final PK model was best described by a one- compartment model in the sparse sampling scheme, although doripenem PK were usually explained by a two-compartment model (11, 12, 21–23). CL
CRwas the only significant covariate for CL/WT in this study. Notably, the CL of doripenem in Korean patients with both normal and lower levels of renal function was expected to be lower than that in Caucasian patients. In addition, our results suggest that current dosing regimens might be optimum when MICs are below 1 g/ml, and patients with augmented renal function should be administered 4-h infusions of doripenem to attain a probability of target attainment above 90%.
Administration of antibiotics on the basis of an understanding of PK/PD profiles can maximize patients’ clinical outcomes through the individualization and optimization of dosing regimens. Growing evidence suggests that the prolonged infusion of -lactams improves clinical outcomes in critically ill patients with severe infections (24), and previous studies revealed that the use of prolonged doripenem infusions more effec- tively achieved the target blood concentrations (11, 17, 21, 25, 26). It is noteworthy that the infusion of doripenem over 4 h in patients with augmented renal function led to more optimal antibiotic exposure in this study. Although there are conflicting results regarding the association between low or undetectable blood -lactam levels and poor clinical outcomes in infected patients (27, 28), the increased glomerular filtration and drug elimination caused by augmented renal function is known to predict subthera- peutic -lactam concentrations (20, 29). Limited data evaluating doripenem PK in patients with augmented renal function indicate a decreased PTA in such patients, which favors the use of extended infusions (16, 21). Furthermore, one recent study comparing the clinical outcomes of patients with ventilator-associated pneumonia due to Gram-negative bacteria treated with doripenem versus imipenem-cilastatin sug- gested that doripenem-treated patients with a supranormal renal function (CL
CRⱖ 150 ml/min) had poor clinical cure rates (44%, 8/18 patients) (30). Our study highlights and reinforces the importance of prolonged infusion in this particular population, and further clinical studies to identify the benefit of this strategy would provide clinicians with the information that they need to help treat such patients.
FIG 5 Probabilities of target attainment (fT
MICabove 40%) with various dosing regimens (a dosing interval of 8 or 12 h, an infusion time of 1 or 4 h, and a dose of 125, 250, or 500 mg) for simulated 60-kg patients infected with
bacteria with various MICs (CVs of 0%) and with various CL
CRs. on March 22, 2018 by Keimyung University Medical Library http://aac.asm.org/ Downloaded from
Our study results also indicate that bacterial susceptibility may be an important issue when the use of doripenem, either empirically or definitely, is considered because the PTA rapidly declines when MICs are above 2 g/ml under current treatment regimens. As two recent studies have suggested, the carbapenem MIC might influence the clinical outcome in patients with Gram-negative bacterial infections (31, 32);
therefore, optimization of the doripenem dosing regimen according to the MIC for the causative organism is required. In this context, the application of PK profiles to adjust the dosing regimen and the mode of administration is particularly important for infections caused by pathogens with decreased in vitro susceptibility and higher MICs, such as Pseudomonas aeruginosa (33). From our point of view, local susceptibility data could be precious. Recent data from an Asia-Pacific surveillance study and a Korean tertiary care center indicate that doripenem has excellent in vitro activity against Enterobacteriaceae, while the MIC values of doripenem for nonfermentative Gram- negative pathogens (Pseudomonas aeruginosa and Acinetobacter baumannii) were wor- risome (34, 35). Therefore, we suggest that empirical dosing of doripenem without determination of an MIC would result in treatment failure.
Because of evidence that the efficacy of doripenem is influenced by appropriate dosing, the mode of administration, and the MIC, the current dosing regimens would be appropriate only in patients who are not in a state of septic shock and who are infected by a pathogen with a MIC below 1 g/ml. Since doripenem has a time- dependent antibiotic effect and our results indicate that an extended 4-h infusion produces a better PD profile than a 1-h infusion, we recommend the use of extended infusions to bring about better clinical outcomes, especially when patients have either normal or augmented renal function or the MIC for the pathogen is above 2 g/ml.
Recent data on the in vitro activity of doripenem against P. aeruginosa, an important pathogen in both intensive care units (ICU) and non-ICU, in the Asia-Pacific region indicated that the MIC
90was 8 mg/liter (34). Thus, from the simulated data used in our study, we consider that 250 mg of doripenem should be administered by i.v. infusion over 4 h in the case of patients with a CL
CRof 10 to 50 ml/min (every 8 h in the case of patients with a CL
CRof 30 to 50 ml/min and every 12 h in the case of patients with CL
CRof 10 to 30 ml/min). If the patients have a CL
CRof ⬎50 ml/min, the regimen of at least 500 mg every 8 h by i.v. infusion over 4 h would be appropriate. However, a dose of more than 1,000 mg every 8 h by infusion over 4 h should be considered in patients with augmented renal clearance (130 ml/min ⱕ CL
CR⬍ 170 ml/min), as several previous studies recommended (36, 37). Furthermore, dose optimization using therapeutic drug monitoring to improve the clinical success rate in patients receiving doripenem needs consideration on the basis of the findings of previous studies (38).
It is of interest to note that the estimated CL of doripenem in Korean patients was lower than that in Western subjects, regardless of renal function, suggesting that the optimized dosing of doripenem in Korean patients might be different from that in Western patients. Because doripenem is exclusively eliminated in urine and the renal clearance of doripenem is controlled by glomerular filtration, which is a passive process with minimal interethnic differences (39, 40), there is limited evidence that carbapen- ems have different pharmacokinetics between races (41). However, the possibility of ethnic differences in doripenem clearance was already raised in a previous study, in spite of the difficulty with the interpretation of the results (17). From our point of view, physiological differences, such as body size, may contribute to interethnic differences in the pharmacokinetics of carbapenems (42–45), which would help to explain the results of our study. The lower doripenem CL in Korean patients with either normal or lower levels of renal function, possibly due to differences in BW and body mass between Korean and other populations (42, 43), may result in a greater chance of attaining a PK or PD target, even with lower doripenem doses. Nevertheless, a cautious interpretation of our results is necessary until a firmer understanding of the interethnic differences in the pharmacokinetics of doripenem is obtained, because several recent studies did not show significant differences in doripenem PK among different popu-
on March 22, 2018 by Keimyung University Medical Library http://aac.asm.org/ Downloaded from
lations (15, 16). Data regarding ethnic differences in PK/PD would be precious for the optimization and individualization of doripenem dosing regimens. Further clinical trials to evaluate if clinical outcomes are influenced by different doses of doripenem in Korean patients may allow more conclusive recommendations to be made.
This study has several limitations. First, we did not include patients who had septic shock or who were on continuous renal replacement therapy. Such factors could alter the PK profiles of doripenem (10, 46). Second, our data do not include doripenem concentrations at the target site of infection. Third, we used a sampling design with only three samples on the basis of practical clinical considerations. The three samples seemed to be appropriate to determine the elimination rate constant and make a one-compartment model, although they would not be appropriate to make a PK model with the best design. Finally, we did not try to validate the clinical outcomes on the basis of the study results. Despite these limitations, our study is valuable because we included a relatively large number of patients (n ⫽ 37) for the PK study, and to the best of our knowledge, the present study is the first to describe data on the population PK of doripenem in Korean patients with acute infections. We plan to perform a clinical trial to confirm and validate the individualized dosing of doripenem on the basis of the equation established for CL and the Monte Carlo simulations performed in this study.
In conclusion, this study appropriately explains the PK profile of doripenem in Korean patients with acute infections using population analysis. Our data suggest that patients without septic shock or patients with infections caused by pathogens with doripenem MICs below 1 g/ml can be treated using the currently recom- mended dosing regimen. However, patients with an augmented renal function or those infected by pathogens with doripenem MICs above 2 g/ml should be treated with 4-h infusions of doripenem to attain a PTA above 90% in order to improve clinical outcomes. Further, therapeutic drug monitoring may be helpful if the MIC is above 2 g/ml or renal function is augmented. This model will be useful for personalized medicine after appropriate model validation using more data.
MATERIALS AND METHODS
Patients. From June 2013 to May 2014, adult patients (ages, ⱖ18 years) with acute infections, such as pyelonephritis, intra-abdominal infections, or neutropenic fever, were eligible for this study. Patients were included if they had sepsis or severe sepsis, as defined by the ACCP/SCCM Consensus Conference (47), and acute-phase infections caused by microorganisms against which doripenem had activity or pathogens that were at least expected to be susceptible to doripenem. The following exclusion criteria were used: a history of hypersensitivity to -lactam antibiotics, severe cardiovascular or hepatic disorders, a central nervous system infection or pneumonia, pregnancy or nursing, and the use of drugs with the potential for interaction with doripenem. Patients who had septic shock or who were receiving renal replacement therapy were excluded.
This study protocol was reviewed and approved by the Institutional Review Board of the Inje University Haeundae Paik Hospital (Busan, Republic of Korea). Informed consent was obtained from each patient or legally authorized representative prior to study inclusion.
Study design. Four consecutive 250-mg or 500-mg doses of doripenem were intravenously (i.v.) infused over the course of 1 h every 8 h in patients with a CL
CRof ⱕ50 or ⬎50 ml/min, respectively. In patients with CL
CRs ranging from 10 to 30 ml/min, we planned to administer 250-mg doses over the course of 1 h every 12 h; however, no patients were administered this dosing regimen.
Blood samples were taken from 37 patients before and at 0 h, 0.5 h, and 4 h after the fourth infusion;
in patients with CL
CRs of ⱕ50 ml/min, samples were taken at 6 h instead of 4 h. The window for taking blood samples to estimate population PK parameters was 10 min for the samples obtained predosing and at 0 h, 20 min for the sample obtained at 0.5 h, and 60 min for the samples obtained at 4 and 6 h.
Drug assay. Plasma doripenem concentrations were determined using a validated liquid chromato- graphy-tandem mass spectrometry assay (48, 49). In brief, 50- l aliquots were vortexed with 10 l internal standard solution (meropenem sodium salt, 20 g/ml) and acetonitrile (250 l) and then centrifuged (5415R centrifuge; Eppendorf, Germany) at 16,000 ⫻ g for 5 min. The supernatant was injected for liquid chromatography-tandem mass spectrometry analysis using a mobile phase consisting of a mixture of 10 mM ammonium formate containing 0.1% formic acid and acetonitrile containing 0.1%
formic acid in a ratio of 90:10 at a flow rate of 0.2 ml/min (Agilent 1200 series; Agilent Technologies, USA).
Mass spectrometry analysis was conducted using electrospray ionization in the positive (ESI
⫹) mode with multiple reaction monitoring (Agilent 6410 triple-quad tandem mass spectrometry system; Agilent Technologies, USA). The lower limit of quantification was 0.2 g/ml. The assay was linear over a range of 0.2 g/ml to 50 g/ml (R
2⫽ 0.9965). The interday precision and the accuracy of the validation concentration range (0.2, 0.6, 10, and 40 g/ml), analyzed with standard samples for 3 days, were 2.75 to 8.16% and 92.59 to 106.67%, respectively.
on March 22, 2018 by Keimyung University Medical Library http://aac.asm.org/ Downloaded from
Population PK analysis. The population PK analysis and PD simulations were conducted using a nonlinear mixed-effect modeling tool, NONMEM (version 7.3; Icon Development Solutions, USA). The first-order conditional estimation with interaction (FOCE-I) method with interactions between interindi- vidual and residual variabilities was used for this study.
One- and two-compartment models were tested using ADVAN1 and ADVAN3 from the PRED (population model-predicted concentrations) population PK library. Interindividual variabilities for PK/PD parameters were assumed to be log-normally distributed and were simulated using an exponen- tial error model, defined as
i⫽ ⫻ exp(
i), where is the typical value of the PK parameter,
iis an individual parameter, and
iis the interindividual random effect, distributed as a normal distribution with a mean of 0 and a variance of
2. An additive error model, a proportional error model, a combined additive and proportional error model, or a Poisson error model was tested for intraindividual variability.
Diagnostic goodness-of-fit plots, NONMEM objective function values (OFVs), and relative standard errors for parameter estimates were evaluated for model selection. A decrease in the OFV (ΔOFV) between two nested models of greater than 3.84 with 1 degree of freedom or 5.99 with 2 degrees of freedom was considered a significant model improvement on the basis of the chi-square test.
To search for significant covariates for PK parameters, including covariates that had a correlation with empirical Bayes estimates for the interindividual variability of a PK parameter and a physiological relationship with the PK parameter, stepwise forward selection and backward elimination were con- ducted. A likelihood ratio test was applied to investigate significant covariates with a significance level with a P value of ⬍0.05 (ΔOFV ⬎ 3.84 with 1 degree of freedom) for selection and a P value of ⬍0.01 (ΔOFV ⬎ 6.64) for elimination (50). In stepwise covariate modeling, the effects of age, sex, height, CL
CR, the blood urea nitrogen concentration, and the Acute Physiology and Chronic Health Evaluation II (APACHE II) score on CL were evaluated. Further, the effects of age, sex, height, plasma protein levels, and the APACHE II score on V were evaluated.
The final PK model was evaluated using Perl-speaks-NONMEM software (version 3.4.2; http://psn.
sourceforge.net). Diagnostic plots and a visual predictive check were performed by comparing the observed plasma concentrations with the 90% prediction intervals from 1,000 simulated data sets using the final PK parameters and significant covariates.
PD target attainment. To simulate the steady-state concentration-time profiles of doripenem for the current dosing regimens used in South Korea (for a CL
CRof ⬎50 ml/min, 500 mg every 8 h by i.v. infusion over 1 h; for 30 ml/min ⱕ CL
CRⱕ 50 ml/min, 250 mg every 8 h by i.v. infusion over 1 h; for 10 ml/min ⬍ CL
CR⬍ 30 ml/min, 250 mg every 12 h by i.v. infusion over 1 h), Monte Carlo simulations for various MICs with coefficients of variation (CVs) of 0%, 10%, 20%, and 30% were conducted using the final PK parameter estimates, the selected covariates, and their distributions to evaluate the current regimen. All PK parameters and the selected covariates were assumed to be log-normally distributed. The steady- state concentrations (C
ss) after multiple intermittent infusions were used to calculate the percentage of a dosing interval during which the free drug concentrations exceeded the MIC (percent fT
MIC). The times above the MIC before and after the steady-state maximum concentration (C
ss,max) were calculated separately and summed.
The peak (maximum) concentration at the end of the infusion (C
ss,max) was determined using the following equation:
C
ss,max⫽ D
V ⫻ k
el⫻
共1 ⫺ e
⫺kel⫻ Tinf兲 共1 ⫺ e
⫺kel⫻ Tint兲where D is dose, V is the volume of distribution, k
elis elimination rate constant, T
infis the infusion time, and T
intis the dosing interval. The trough (minimum) concentration (C
ss,min) before the next dose was calculated using the following equation:
C
ss,min⫽ D
V ⫻ k
el⫻
共1 ⫺ e
⫺kel⫻ Tinf兲共
1 ⫺ e
⫺kel⫻ Tint兲⫻ e
⫺kel⫻共Tint⫺ Tinf兲The equation for the change in the concentration over time after C
ss,minwithout the administration of a new dose (C
ss) becomes
C
ss⫽ D
V ⫻ k
el⫻
共1 ⫺ e
⫺kel⫻ Tinf兲共
1 ⫺ e
⫺kel⫻ Tint兲⫻ e
⫺kel⫻共Tint⫺ Tinf兲⫻ e
⫺kel⫻ timeThen, changes in the concentration over time after the administration of a new dose (C
ss,inf) were calculated by
C
ss,inf⫽ D
V ⫻ k
el⫻
共1 ⫺ e
⫺kel⫻ Tinf兲共
1 ⫺ e
⫺kel⫻ Tint兲⫻ e
⫺kel⫻共Tint⫺ Tinf兲⫻ e
⫺kel⫻ time⫹ V ⫻ k D
el⫻ 1 ⫺ e
⫺kel⫻ time(1)
On the other hand, the equation for the concentrations after C
ss,maxis achieved becomes
C
ss⫽ D
V ⫻ k
el⫻
共1 ⫺ e
⫺kel⫻ Tinf兲共