Journal of the Korea Institute for Structural Maintenance and Inspection Vol. 18, No. 2, March 2014, pp.047-053
http://dx.doi.org/10.11112/jksmi.2014.18.2.047
pISSN 2234-6937 eISSN 2287-6979
처짐한계상태함수를 이용한 노후 강거더 교량의 신뢰성해석 모델 구축
Reliability Analysis Model for Deflection Limit State of Deteriorated Steel Girder Bridges
엄 준 식1)*
Jun-Sik Eom
Abstract
The paper investigates the limit state of deflection for short and medium span steel girder bridges. Deflection depends on stiffness of steel girders and integrity of the reinforced concrete slab (composite action). Load and resistance parameters are treated as random variables. A probabilistic model is developed for prediction of the deflection. The structural performance can be affected by deterioration of components, in particular corrosion of steel girders. In addition, the creep of concrete can greatly influence the deflection of composite structures. Therefore, the statistical models for creep and corrosion of structural steel are incorporated in the model. Structures designed according to the AASHTO LRFD Code are considered. Load and resistance models are developed to account for time-variability of the parameters. Monte Carlo simulations are used to estimate the deflections and probabilities of serviceability failure. Different span lengths and girder spacing are considered for structures designed as moment-controlled and deflection-controlled. A summary of obtained results is presented.
Keywords : Structural reliability, Resistance model, Steel girder bridge, Limit state function
1) 정회원, 상지대학교 건설시스템공학과 교수, 교신저자 * Corresponding author : [email protected]
• 본 논문에 대한 토의를 2014년 4월 30일까지 학회로 보내주시면 2014년 5월호에 토론결과를 게재하겠습니다.
Copyright Ⓒ 2014 by The Korea Institute for Structural Maintenance and Inspection. This is an Open Access article distributed under the terms of the Creative Commons Attribution Non-Commercial License (http://creativecommons.org/licenses/by-nc/3.0)which permits unrestricted non-commercial use, distribution, and reproduction in any medium, provided the original work is properly cited.
Fig. 1 Deficient Bridges and Structural Types in the United States (FHWA, 2005)
1. Introduction
Composite steel girder bridges represent a considerable percentage of the bridge population in the United States.
During the interstate network development in U.S. in the 60’s and 70’s, rapid construction and operation was required.
Therefore, steel composite bridges with a concrete deck became a majority, which allowed for a rapid erection and fast opening to traffic. As a consequence, these bridges represent about 34% of the entire bridge population in United States. However, today they also account for as much as 52.4% of the structurally deficient structures and they tend to deteriorate faster than other structural types, as shown in Fig. 1 (FHWA, 2009). In Korea, DB-24 rated bridges consist of 72% of all bridge population, which indicate 28% of bridges are not functionally sound
(MOLIT 2012). Structural deficiencies are due in part to the increase of traffic, to improper design, as well as development of corrosion. A composite section is subjected to corrosion of the steel girder and of the reinforcing steel
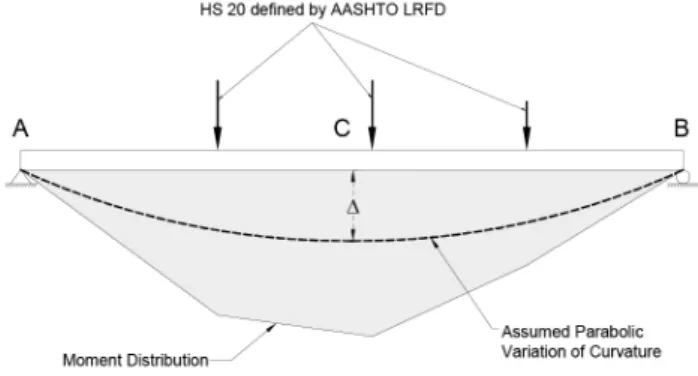
Fig. 2 Deflected Shape of a Simply Supported Member in the concrete slab, but also to the creep of concrete.
Structural steel corrosion is a major concern in the United States. A 2002 study mandated by the U.S. Congress estimated the annual direct cost of corrosion for highway bridges is estimated to be $8.3 billion, consisting of $3.8 billion to replace structurally deficient bridges over the next ten years, $2.0 billion for maintenance and cost of capital for concrete bridge decks, $2.0 billion for maintenance and cost of capital for concrete substructures (without decks), and $0.5 billion for maintenance painting of steel bridges (Koch et al., 2002). In the same report, the authors also mentioned that the non-estimated indirect costs to the users due to traffic delays and loss of productivity are more than 10 times the direct cost of corrosion.
So far, steel girder bridges have been designed according to the AASHTO Standard Specifications and, from 2007, AASHTO LRFD code became the princpal design code.
There are many requirements that have to be fulfilled but the deflection remains as an optional limit state. An NCHRP Study 20-7 (2002) reviewed the live load deflection in different US states and found considerable discrepancies in allowable deflections and live-load definitions used in the calculations. Very few states have any deflection requirements, and most of the states consider this limit state as an optional requirement. Czarnecki (2006) stated that deflection can be a useful parameter to investigated the overall safety of girder bridge structures, considering the system reliability. Therefore, the presented study investigates the effect of deflection limitations in the design on the actual time-dependent deflections to investigate the overall safety, as well as the probability of serviceability limits associated with yielding of the steel section.
2. Time-Dependent Deterioration Model
A time-dependent deterioration model is summarized, using the age-adjusted modulus of elasticity method, to predict the mid-span deflection of steel girder bridges designed according to the moment-carrying capacity (ultimate limit state, ULS) and according to the deflection limit state (serviceability limit state, SLS).
The analysis of time-dependent deformations of statically determinate composite beams in bending was presented by Gilbert (1988). The analysis requires only the estimation of deflections under live loads, and therefore does not include long-term deflection due to sustained load (dead load of the structure). The considered deflections are the result of a short-term load (but with long-term development of creep) and the analysis includes time-dependent variation of the variables.
Provided that the deflections are small and that the theory of elasticity is applicable, the deflection at any point along the beam is obtained by integrating the curvature κ(x) over the length of the member, as follows,
( )x dxdx
v=∫∫κ (1)
where ν = deflection at location x, κ(x) = curvature at any location x along the member.
With an assumption of a parabolic variation of curvature, the maximum deflection occurring at midspan of a simply supported beam (see Fig. 2) can be approximated as,
96 ) ( ) 10 (
L2
t ≈ κC t
Δ (2)
where κc(t) = curvature at midspan at time t, Δ(t) = maximum deflection at midspan at time t, L = length of the member.
The analysis required for the assessment of deflections due to the short-term live load does not account for the
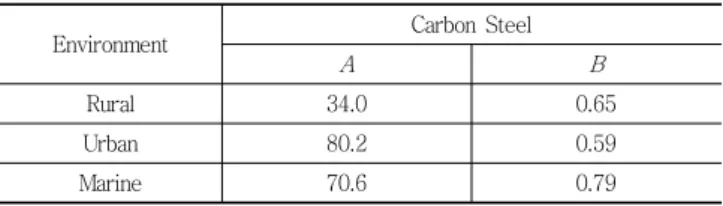
Table 1 Average Values for Corrosion Parameters A and B, for Carbon Steel (Kayser and Nowak 1989)
Environment Carbon Steel
A B
Rural 34.0 0.65
Urban 80.2 0.59
Marine 70.6 0.79
time-dependent relaxation and stress redistribution due to creep and shrinkage of concrete. The strains induced by concrete relaxation under sustained loading are ignored in the present analysis since only instantaneous deflections are considered. Therefore, Eq. 2 can be reduced to its final form since strains at the supports due to shrinkage, are negligible. The curvature C at any time t caused by live load can be determined as,
[ ( ) () ()2]
) , (
) ) (
( E t A t I t B t
M t t A
e e e e
e
C = −
κ τ
(3)
where M = moment induced by live load, Ae(t) = equivalent area of the transformed section at time t, Be(t) and Ie(t)= first and second moment area of the transformed section at time t, Ee(t,τ) = age-adjusted effective modulus at time t, τ = age at first loading. All section properties are calculated from the top of the section using the transformed area method where n(t) = Es/Ee(t,τ). The girder section properties are time-dependent, and they are related to the creep and corrosion development.
Bazant and Baweja (1995) formulated a method that accounted for aging of concrete. He introduced the age-adjusted effective modulus method, sometimes called the Trost-Bazant Method. To account for the aging of concrete, the age-adjusted effective modulus of elasticity is calculated as,
( ) ( ) ( ) ( )τ φ τ
τ χ
, , , 1
t t
t t E
Ee c
= +
(4)
where Ee(t,τ) = age-adjusted effective modulus of elasticity; τ = age of concrete at the time of loading, Ec = initial modulus of elasticity of concrete, χ(t,τ) = aging coefficient, φ(t,τ) = creep coefficient. A value of χ(t,τ) = 0.8 can be assumed for most practical cases. To account for the prediction uncertainty, an associated error function Ψ1 is defined as a lognormal variable with mean value of 1.00 and a coefficient of variation 14.6%.
3. Corrosion of Structural Steel of Bridge Girders
Corrosion of the superstructure may cause a considerable reduction of resistance. It can not only cause fracture, but in addition yielding or buckling of members. Also of primary importance, corrosion may induce an increase in stress, a change in geometric properties (by a decrease of section modulus), or a buildup of corrosion products. These changes are mostly associated with a loss of material. The loss can be on a local or microscopic level, such as pitting; or in a general area, such as surface corrosion. A consequence of surface corrosion is the reduction in member cross section properties, such as the section modulus or the slenderness ratio. Such properties are critical for a member’s ability to resist bending moments or axial forces.
Kayser and Nowak (1989) used the following relationship between the annual corrosion loss, the steel type and the environment exposure, based on the study by Albrecht (1984),
AtB
C=Ψ2 (5)
where C = average corrosion penetration or actual corrosion loss (μm), t = number of years, A and B = parameters determined from the analysis of experimental data, Ψ2 = model error.
Corrosion of steel girder occurs only on the web and on the lower flange. This reduction of the steel section is taken into account in the presented analysis. The error function Ψ2 is defined as a lognormal variable with the mean value of 1.0 and coefficient of variation of 20%.
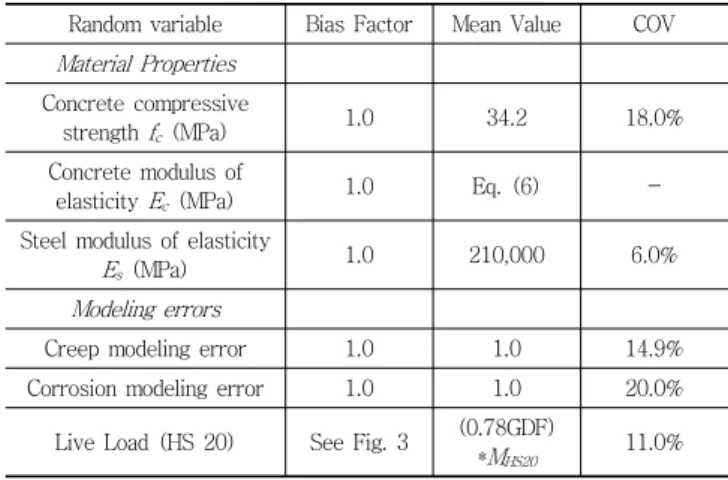
Table 2 Summary of Statistical Parameters
Random variable Bias Factor Mean Value COV Material Properties
Concrete compressive
strength fc (MPa) 1.0 34.2 18.0%
Concrete modulus of
elasticity Ec (MPa) 1.0 Eq. (6) -
Steel modulus of elasticity
Es (MPa) 1.0 210,000 6.0%
Modeling errors
Creep modeling error 1.0 1.0 14.9%
Corrosion modeling error 1.0 1.0 20.0%
Fig. 3 Moment Bias Factor Evolution for Simple Span due to Single Truck Loading (Nowak, 1999)
4. Randomness of the Parameters
In the deflection analysis, the considered random parameters can be grouped into three categories such as (1) material property parameters, (2) modeling errors, and (3) applied load parameters. The dimensional properties are treated as deterministic values since their associated coefficients of variation are usually small and negligible.
Material parameters such as concrete strength fc, steel and concrete modulus of elasticity Es and Ec, are the most influential parameters in the analysis. The modeling errors have been introduced previously for the creep coefficient and corrosion predictions. The concrete modulus of elasticity Ec is described as a random variable, but it is essentially related to the concrete compressive strength by the following formula
c
c f
E =4734 (6)
where fc = concrete compressive strength at 28 days (MPa). Therefore, the variation of the concrete modulus of elasticity is closely related to the concrete compressive strength.
These random variables accounts for the variability inherently associated with practical applications. The relevant statistical parameters such as the bias factor, mean value, and standard deviation are summarized in Table 2. All the presented random variables are considered as having lognormal distributions.
Eom (2009) found that the girder distribution factor (GDF)
defined by AASHTO can be very conservative. Based on field measurements, a more accurate value of the GDF is 0.78% of the code specified value given by AASHTO.
Therefore, in Table 2, the mean value of the live load (truck load) is defined as (0.78(GDF) (MHS20)). Also, a study reported by Nowak (1999) showed that the bias factor for the moment caused by HS20 truck loading varies with time. Figure 3 shows the variability of the bias factor for a single truck and one lane loaded by Nowak (1999). Value of the bias factor increases with time, because the probability of observing a heavier truck also grows with time.
5. Deflection Profiles and Serviceability Failure
Reliability analysis assesses a structure’s safety reserve with respect to a particular performance function. Ultimate limit states such as moment-carrying capacity, shear-carrying capacity can be investigated, as well as serviceability limit states such as flexural cracking, corrosion cracking, or excessive deformations. A probability of failure can be calculated for a particular limit state using analytical solutions.
In most cases, too many random variables are included in the analysis and simulations are required to solve the problem at hand. In this study, Monte Carlo simulations have been selected to carry out the reliability analyses. The
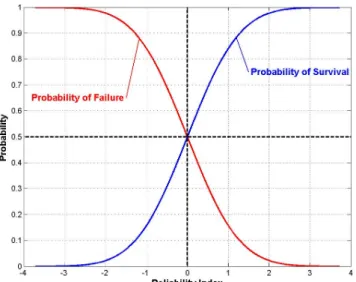
Fig. 4 Relationship Between Reliability Index, Probability of Failure, and Probability of Survival
Fig. 5 Reliability Analysis for L/800 Deflection Limit State, Span Length = 15.24 m, Girder Spacing = 2.74 m
index β using the following formula,
( )β
Φ
f =
P or β =−Φ−1( )Pf (7)
where Φ = standard normal distribution function. Figure 4 shows the relationship between the probability of failure and the reliability index.
An excessive deflection can cause damage in the concrete deck by tension cracking, buckling of the steel girder, or discomfort to the users. AASHTO LRFD (2013) recommends an allowable deflection limit. It is defined as L/800, where L = span length. The deflection caused by the design truck and associated dynamic load is to be checked. However, as stated previously, the real moment observed during bridge operation (under real traffic) can be larger than the calculated design moment. Using the code deflection limit can lead to very low values of reliability indices (well below zero), as shown in Figure 5, for a span length of 15.24 m and a girder spacing of 2.74 m.
Monte Carlo simulations are used to virtually generate sets of random variables. A performance function is defined as G(t). Each time a simulation fails to meet the performance function, the counter increases and the probability of failure is defined by
[ ]
t
f n
t G t n
p ( ) 0
)
( = ≤
(8)
where n[G(t)≤ 0] = number of runs when the deflection exceeds the allowable limit, nt = total number of simulations for each time increment. It has been observed previously that adopting the code deflection limit state is unreasonable due to the nature of the design load compared to the real loads. Since the goal of reliability analysis is to evaluate the safety of a structure under real conditions, it is convenient to define the performance function, or limit state, as the deflection at yielding of the steel section such as,
( )t ( ) ( )t t
G =ΔYielding −Δ (9)
where ΔYielding(t) = deflection at mid-span at yielding of the lower flange of the steel section at time t, Δ(t) = deflection at mid-span at time t.
6. Analysis Results
The considered structures are simply supported composite steel bridge girders. A variety of span lengths have been considered. Sections have been designed according to the AASHTO LRFD design code (U.S. Units), following the ultimate limit state (moment controlled), and the deflection
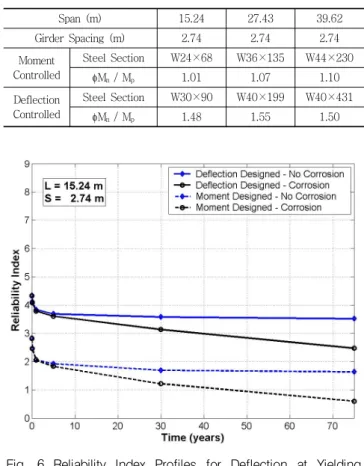
Table 3 Summary of Investigated Sections
Span (m) 15.24 27.43 39.62
Girder Spacing (m) 2.74 2.74 2.74
Moment Controlled
Steel Section W24×68 W36×135 W44×230
φMn / Mp 1.01 1.07 1.10
Deflection Controlled
Steel Section W30×90 W40×199 W40×431
φMn / Mp 1.48 1.55 1.50
Fig. 6 Reliability Index Profiles for Deflection at Yielding Limit State, Span Length = 15.24 m, Girder Spacing
= 2.74 m
Fig. 7 Reliability Index Profiles for Deflection at Yielding Limit State, Span Length = 27.43 m, Girder Spacing
= 2.74 m
Fig. 8 Reliability Index Profiles for Deflection at Yielding Limit State, Span Length = 39.62 m, Girder Spacing
= 2.74 m limit state (deflection controlled). For convenience, Table 3
summarizes the beam selection for all cases considered.
The deterministic material parameters included in the analysis are: thickness of the concrete slab hs = 230mm - no asphalt cover; Type I cement; age at loading = 28 days; relative humidity H = 70% (typical in Michigan, United States); water/cement ratio = 0.45; aggregate/cement ratio = 5.0.
Figure 6, 7 and 8 show the reliability indices for the sections considered as a function of time, exposed to creep only (no corrosion), and exposed to creep and to a marine corrosive environment (corrosion). The span lengths considered cover the short and medium span bridges, exposed to two trucks placed on the bridge side-by-side, which constitutes the worst case scenario.
Reliability indices vary with time, depending on the span length. Lower values of β are obtained for smaller span
longer spans. Corrosion has more influence on smaller spans as well, since the sections considered are smaller and the percentage of section loss is more important. For shorter spans, creep can impact the reliability index almost as much as corrosion. Longer spans are less affected by corrosion, and creep has a positive effect on the reliability.
Indeed, Figure 8 shows that creep can increase the long-term reliability of composite girder bridges. It can be noted that a new generation of design codes such as
요 지
이 연구에서는 중소지간 합성형 강거더교량에 대한 신뢰성 해석을 위해 강거더와 콘크리트슬래브의 강성을 토대로 처짐을 고려한 한계 함수를 구축하여 신뢰성해석을 수행하였다. 확률적 하중과 저항모델을 통해 처짐을 예측하기 위해 계산에 필요한 변수들을 확률변수로 고 려하였다. 강재의 부식에 의한 단면의 감소, 그리고 콘크리트의 크리프는 합성형교의 처짐에 많은 영향을 미친다. 따라서 이 연구에서는 AASHTO LRFD 기준으로 설계된 교량에 대해 시간에 따른 변수를 고려하여 강재단면의 감소와 크리프의 영향을 통계적 모델에 반영하 기 위해 몬테-카를로 시뮬레이션 기법을 이용하였으며, 처짐과 사용성을 고려하여 다양한 지간과 거더간격을 가진 교량에 신뢰성 해석을 수행하였다. 그 결과, 장지간 교량의 경우, 단지간 교량과 비교해 보았을 때 상대적으로 크리프와 강재단면감소의 처짐에 대한 영향이 작았 으며, 이에 반해 단지간 거더 교량의 경우 크리프의 진행에 따라 처짐에 많은 영향을 미친다는 것을 알 수 있었다.
핵심 용어 : 구조신뢰성, 저항모델, 강거더교량, 한계상태함수 reliability index of 3.5 for the ultimate limit state.
7. Conclusions
A probabilistic time-dependent non-linear deflection model for simply-supported composite steel girder bridges is presented. Corrosion of the structural steel is considered and corrosion modeling is included in the analytical solution. A performance function for steel yielding is developed. Reliability indices vary with time, depending on the span length. Lower values of β are obtained for smaller span lengths and higher reliability indices are obtained for longer spans. Corrosion has more influence on smaller spans as well, since the sections considered are smaller and the percentage of section loss is more important. Longer spans are less affected by corrosion, and creep has a positive effect on the reliability. The results of time-dependent reliability analysis indicate that the reduction of safety can be a major concern, especially for shorter spans, and creep has to be considered and monitored closely.
References
1. AASHTO LRFD (2013), Bridge Design Specifications.
American Association of State and Transportation Officials, Washington, D.C.
2. Albrecht, P., and Naeemi, A. H. (1984), Performance of weathering steel in bridges, National Cooperative Highway Research Program, Report 272, July.
3. Bazant, Z. P., and Baweja, S. (1995), Creep and shrinkage prediction model for analysis and design of concrete structures: Model B3, RILEM Recommendations, Materials and Structures, 28, 357-365.
4. Czarnecki, A. (2006), System Reliability Models of Corroded Steel Girder Bridges, Ph.D. Dissertation, University of Michigan.
5. Eom, J. (2009), Verification of Lateral Live Load Distribution Factors for Continuous Steel Girder Bridges Based on Diagnostic Testing Results, Journal of Korea Institute for Structural Maintenance Inspection, 13(4), 180-187 (in Korean).
6. Federal Highway Administration (2009), FHWA bridge programs material type of structure by state.
7. Gilbert, R. I. (1988), Time effects in concrete structures, Elsevier, Amsterdam.
8. Kayser, J. R., and Nowak, A. S. (1989), Reliability of corroded steel girder bridges, Structural Safety, 6, 53-63.
9. Koch, G. H., Brongers, M. P., Thompson, N. G., Virmani, Y. P., and Payer, J. H. (2002), Corrosion cost and preventive strategies in the United States, Report No. FHWA-RD-01-156, Office of Infrastructure Research and Development, Federal Highway Administration.
10. MOLIT (2012), 2013 Survey of Road Bridges and Tunnels, Ministry of Land, Infrastructure and Transportation (in Korean).
11. NCHRP (2002), Improved live load deflection criteria for steel bridges, National Cooperative Highway Research Program Web Document 46 (Project 20-7[133]).
12. Nowak, A. S. (1999), Calibration of LRFD Bridge Design Code, National Cooperative Highway Research Program, NCHRP Report 368, TRB.
Received : 11/22/2013 Revised : 12/10/2013 Accepted : 12/13/2013