Vol.12, No.5, pp.54-68 (2018) https://doi.org/10.20910/JASE.2018.12.5.54
1. Introduction
As a mechanical power transmission medium, aircrafts mainly use hydraulic systems with power oil pressure due to reliability, cost, safety of
supply, certainty of operation, and structural simplicity. Aircraft brake systems using hydraulic systems require complex components, such as a hydraulic reservoir, a pressure accumulator, servo valves, check valves, and electronic control devices, and thus there is a limitation to applying conventional hydraulic system to unmanned aircraft which has weight and space constraints.
Consequently, the miniaturization of the brake
체크밸브 특성이 소형 압전유압펌프 유량에 미치는 효과
응위웬 안 푹1· 황재혁2,†· 황용하1· 배재성2
1한국항공대학교 항공우주 및 기계공학과 대학원
2한국항공대학교 항공우주 및 기계공학부
Effect of Check Valve Characteristics on Flow Rate of the Small Piezoelectric-Hydraulic Pump
Nguyen Anh Phuc1, Jai-Hyuk Hwang2, , Yong-Ha Hwang1, and Jae-Sung Bae2
1Department of Aerospace and Mechanical Engineering, Graduate School at KAU
2Department of Aerospace and Mechanical Engineering, Korea Aerospace University
Abstract
The objective of this study is to analyze the effect of dynamic characteristics of the check valve applied to the small piezoelectric-hydraulic pumps on flow rate formation. The flow rate of the piezoelectric-hydraulic pump is a key factor in the formation of the load pressure to operate the brake system. At this time, the natural frequency of the check valve operating in the fluid has a great influence on the formulation of the flow rate of the piezoelectric-hydraulic pump. In addition, the natural frequency of the check valve is affected by the gap between the check valve and the pump seat. In this study, the natural frequency of the check valve according to the gap between the check valve and the pump seat was calculated through the fluid-structure interaction analysis. The flow rate obtained from the simulation result was verified by comparing it with the result from the flow rate experiment using the developed piezoelectric-hydraulic pump.
초 록
본 논문에서는 소형 압전유압펌프에 적용된 체크밸브의 동적 특성이 유량 형성에 미치는 효과에 대
한 연구를 수행하였다 브레이크 시스템 작동을 위한 부하 압력의 형성을 위해서는 압전유압펌프의 유.
량이 중요한 요소이다 이때 유체 내에서 작동하는 체크밸브의 고유 진동수는 압전 유압펌프의 유량 . ,
형성에 큰 영향을 미친다 또한 체크밸브의 고유 진동수는 체크밸브와 펌프 시트 사이의 간격에 영향. ,
을 받는다 이를 고려하여 본 연구에서는 체크밸브와 펌프 시트 사이의 간격에 따른 체크밸브의 고유진.
동수를 유체 구조 연성 해석을 통해 산출하였다 시뮬레이션을 통해 얻은 유량은 개발된 압전유압펌프- .
를 이용한 유량 형성 실험과의 비교를 통해 검증하였다.
Key Words : Check efficiency(체크 효율), Check valve(체크 밸브), Piezoelectric-hydraulic pump(압전 유압 펌프), FSI analysis(유체 구조 연성 해석- )
Received: Aug. 06, 2018 Revised: Sep. 03, 2018 Accepted: Sep. 08, 2018 Corresponding Author
†
Tel: +82-02-300-0109, E-mail: [email protected] The Society for Aerospace System Engineering
Ⓒ
system applicable to small- and medium-sized unmanned aerial vehicles requires the small-sized hydraulic pump which plays an important role in forming the flow rate and load pressure. Many studies have been performed recently on small-sized smart material micro pumps [1-4], and therefore several types of smart material actuators such as SMA (shape memory alloy), IPMCs (ionic polymer-metal composites), and PZT (piezoelectric) have been studied [5-7]. For the development of brake systems for small- to medium-sized unmanned aircrafts, the PZT actuator is most suitable to form a large load pressure with small displacement. Therefore, a previous study by this team developed a small piezo-electric hydraulic pump with PZT actuator [8]. While the previous smart material pumps have produced pressures up to 100 psi [5-7], the small piezoelectric-hydraulic pump developed by the team is capable of forming a maximum pressure of 750 psi, thereby meeting the operational requirements of small- and medium-sized unmanned aircraft brake systems.
The pump identifies an excellent load pressure forming ability compared to previous smart material pumps [8].
The discharge flow rate affects the load pressure of the brake system with the small piezoelectric-hydraulic pump. The discharge flow rate is influenced by the displacement of the actuator, the cross section of the piston, and the operating frequency [9-13]. In addition, a dynamic characteristics analysis of the check valve is also required because the check valve discharges flow in a single direction. When the check valve is operating in liquid, it receives the additional inertia force due to the mass of the oscillating liquid and the damping force due to viscosity of the liquid. These two forces are proportional to the acceleration and speed of the
check valve, respectively, and affect the dynamic characteristics of the check valve again. Further, the effect of the pump seat where the check valve is placed on the dynamic characteristics of the check valve is considered when analyzing the dynamic response of the check valve. When a sinusoidal input voltage is applied to the PZT actuator, the check valve opens for the fluid to release as the actuator force increases; when the actuator force decreases, the check valve closes to prevent backward flow. In order to entirely prevent backward flow, an O-ring was installed between the pump seat and the check valve. It creates the gap between the pump sheet and the check valve. This gap changes the added mass and added damping which affects the natural frequency of the check valve. This variation in the natural frequency causes a phase shift between the check valve and the PZT actuator movement, and the difference in the phase has a significant effect on the flow rate.
Previous researches on the vibrating check valve in liquid modelled the check valve as a cantilever beam, then analyzed how the parameters, such as the gap between the cantilever beam and the solid wall, fluid viscosity affect the dynamic characteristics of the check valve [14-17]. In their studies, a solid wall means a stationary structure adjacent to the liquid near by the check valve. In this paper, a solid wall corresponds to the pump seat. A simulation technique that would apply to the actual shape of a vibrating structure in a fluid, not to the cantilever beam model, was proposed in this paper. Also analyzed was how the dynamic characteristic change in the check valve vibrating inside the fluid affects the flow rate. In addition, this study examined the variation in the natural frequency with the change in the distance between the check valve and pump seat,
considering that this distance affects the dynamic characteristics of the check valve.
Theoretical developments were made for the calculation of check efficiency by assuming the check valve as a 1-DOF system, and FSI analysis using commercial codes was performed to evaluate its natural frequency. The variation in the natural frequency of the check valve will affect the phase variation between the actuator and the check valve movement during the pump operation. The phase variation will also affect the pump flow rate sequentially. To explain this, the check efficiency parameter is considered in this paper. The check efficiency is a function of phase, and the flow rate is changed according to the check efficiency. In this study, flow rate analysis was performed taking into account the dynamic response of the check valves, and it was validated against the experimental results.
Therefore, it has been confirmed that the variation in the natural frequency of the check valves results in a phase difference between the motion of the PZT actuator and the check valve, resulting in a change in the flow rate and flow direction, having a significant effect on the pump performance.
2. Dynamic characteristics of the check valve in liquid adjacent to a solid wall
2.1 The force acting on the check valve operating in fluid
The type of check valve adopted for the piezoelectric-hydraulic pump is the thin-plate spring check valve. It operates with the oscillation of the PZT actuator at high speed.
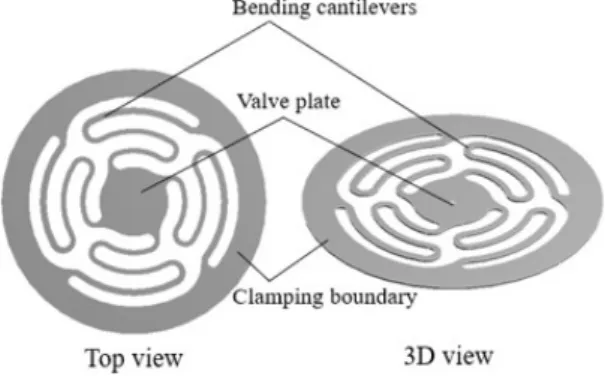
The check valve plays an important role in the hydraulic pump and is designed to effectively prevent fluid back-flow. The thin-plate spring check valve (Fig. 1) consists of a clamping
boundary, bending cantilevers and valve plate which blocks reverse flow. The displacement of the valve plate can be adjusted by changing the size, shape or material of the bending cantilevers.
In this study, the stainless steel was used for a check valve with a chosen thickness of . The use of an O-ring to prevent reverse flow has created a gap between the check valve and the pump seat. The appearance of that gap changes the liquid environment around the valve. Therefore, it is necessary to evaluate the effect of the gap on the valve operation.
Fig. 1 Schematic diagram of thin-plate spring type check valve
The vibration of the thin-plate spring type check valve can be simplified as a mass-spring system.
In this case, bending cantilevers act as the spring of the system. The mass of the system lies in the center of the valve plate. In other words, the oscillation of the check valve can be simplified by the vibration of the valve plate. The dynamic equation of motion for the check valve can be expressed as:
(1)
where is the mass of the thin-plate spring type check valve, refers to the damping coefficient of the check valve, denotes spring
constant of the bending cantilevers, is the displacement of valve plate, and are the time and the external force, respectively.
In the piezoelectric-hydraulic pump, the fluid flow is driven by the vibrating actuator to open or close the check valve. At the same time, the fluid reversely plays a main role in resistance to the check valve vibration. The actuator vibration, the check valve movement and the fluid are thus coupled. The fluid reaction force is represented as an added mass and added damping contribution to the dynamic response of the check valve without affecting its stiffness. Assuming the fluid to be incompressible, the driving force produced by the actuator will apply to the check valve right way. In turn, the external force can be divided into two contributions:
(2)
The first term, in Eq. (2), is a reaction loading component due to the motion of the fluid around the check valve, whereas the second term, represents a driving force that excites the check valve. The driving force usually is represented as a known function of time.
With regard to fluid structure interaction, in – many previous studies, the reaction force (which mainly due to the pressure drag [17]) has been described by two uncoupled terms:
(3)
where is the added mass and is the added damping coefficient. The negative sign in Eq. 3 indicates that the reaction forces always reverse to the check valve motion. Substituting Eq. 3 into Eq. 2, we obtain an uncoupled equation of motion for the check valve:
(4)
where mass and damping coefficient include the contributions from the check valve and the surrounding fluid. The damping coefficient of the check valve is considered as a small value in this study.
Because and are two factors that are affected by fluid around the check valve, the shape of the check valve must be kept in the calculation to accurately calculate them. Due to the complex shape of the check valve, obtaining an analytical expression for added viscous damping coefficient and added mass is not an easy work. Moreover, Eq. 3 is built up by assuming that the nonlinear parts in the Navier-Stokes equations are negligible. However, when the check valve vibrates near the pump seat, the nonlinear terms can become significant due to the small gap between check valve and pump seat. In consequence, the hydrodynamic force may not be decoupled as Eq. 3 [17]. The purpose of the numerical simulation considering the real check valve and ambient liquid is to identify the responses of check valve more accurately. The ANSYS program is also used to simulate the vibration of the check valve in liquid with consideration of the influence of the gap between check valve and pump seat.
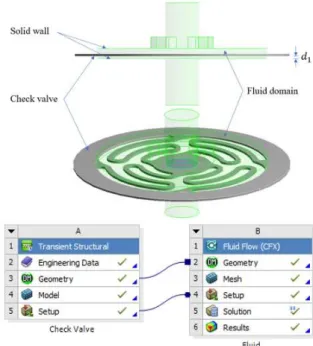
2.2 Fluid-Struture Interaction analysis of check valve operating in fluid using ANSYS To evaluate the effect of fluid on the dynamic response of the check valve, FSI analysis was conducted by using the ANSYS program. Because of the O-ring in the chamber of the pump, the spacing between the pump seat and the check valve can be created. To consider the effect of
the gap on the response of the check valve, the FSI simulations with several gap values were conducted. The one case of FSI simulation concerning the interaction of the check valve and its surrounding fluid is shown in Fig. 2. The FSI simulation process calculating the natural frequency of the check valve is as follows; first, the real check valve is put inside the fluid domain. Next, the initial velocity of the check valve plate is applied. Then, the displacement of the center point is calculated subsequently.
Finally, the natural frequency and damping ratio are evaluated using FFT analysis of the displacement time series.
2.2.1 Modeling of check valve in fluid domain.
The FSI simulation has two separate solvers, one for the structure (FEM) and one for the fluid (CFD) that run in sequential order with integrated coupling of analysis systems to exchange data at the interface of the fluid and structure domains.
In the present study, the two commercially available solvers ANSYS CFX 18.0 and ANSYS Transient Structure 18.0 were applied as CFD and FEM solvers respectively. The interaction between the check valve and the fluid is dealt with a two-way FSI simulation. The results of the CFD analysis are exchanged to the mechanical solver whereas the subsequently computed displacements at the interface are exchanged back to the CFD analysis. The coupling capability that is presently available enables CFX to run with the ANSYS Mechanical solver in an ANSYS Multi-field simulation. During coupled simulations, the Mechanical solver and ANSYS CFX execute the modeling through a sequence of multi-field time steps. Each of time steps contains one or more coupling iterations.
Coupled simulations start with the calculation of
the ANSYS Mechanical and CFX field solvers.
Fig. 2 FSI simulation of the check valve in fluid domain
Concerning the liquid domain, the derivation of the governing equations for the liquid domain requires using the momentum equation, the continuity equation, and the energy equation which was declared to the CFX. In this simulation, Mil-PRF-83282 that generally used in actual aircraft hydraulic brake systems was used as the hydraulic fluid with a density of
and a dynamic viscosity of
× . The realizable model which is common turbulence models was adopted for the turbulence simulation. It is a two equations model which includes two extra transport equations to illustrate the turbulent properties of the flow. Regarding the structural domain, the check valve undergoes a geometric change as well as the effect of added inertia and added damping in the transient analysis. The check valve is fixed at the clamping boundary and the initial velocity is applied at the valve plate to make it vibrate. The behavior of the
vibrating check valve is determined for each value of gap height as the gap height varies from 0.1 to 0.5 .
2.2.2 Meshing and load in simulation
The fine mesh generation for simulation has been done for the check valve and the surrounding fluid. The triangular shape elements are used during the meshing, which can more finely mesh the check valve and the surrounding fluid. A dynamic mesh is necessary to be defined for this coupled analysis where a system receives displacement. In this simulation, the check valve oscillates up and down and the dynamic meshing settings determine how the mesh of the liquid domain reacts to this deformation of the moving check valve. The mesh on the fluid-structure interface is static, so as the liquid mesh is modified to accommodate the deformation in the transient system, the mapping on this coupling interface stays consistent. After meshing, these meshed domains appear as shown in Fig. 3.
Fig. 3 Meshing of the check valve(left) and fluid (right)
The initial velocity of the check valve and fluid solid interface is presented in Fig. 4. The initial velocity is arbitrary but it is chosen to make sure that the check valve just vibrates inside liquid domain. In this study, the initial velocity is set to 8 .
2.2.3 Fluid-Structure Interaction results – Flow field near check valve
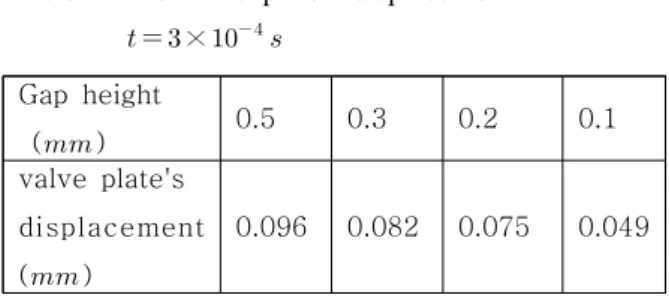
Table 1 and Fig. 5 give the displacement of the valve plate and the flow field near the check valve for the several gap heights at a typical moment.
Gap height
( ) 0.5 0.3 0.2 0.1
valve plate's displacement ( )
0.096 0.082 0.075 0.049 Table 1 The valve plate's displacement at
×
Fig. 4 The initial velocity of the check valve, fluid solid interface and fixed support
(a) Pressure with gap height
(b) Pressure with gap height
(c) Pressure with gap height
(d) Pressure with gap height
Fig. 5 Pressure field result at ×
As the check valve moves up from the pump seat (bottom surface), the magnitude of the
pressure force increases strongly on the approaching surface and decreases marginally on the opposite surface (Fig. 5). With the decreasing gap height, the pressure force between those surfaces is higher, causing a strong decline in the valve plate’s displacement (Table 1). The pressure explained in this section represents the force reaction in Eq. 3 which is proportional to the added mass and added damping. The effect of the gap height on the added mass is consistent with the results from a previous study [18]. The transient displacement was recorded to evaluate the natural frequency of the check valve using Fourier Transform. The vibration of the check valve in a fluid is the response of an underdamped system which will be used to determine the damping ratio and the natural frequency. As the check valve is considered as a spring mass system, with center point vibration, the natural frequency and the damping ratio of system will be determined using FFT (Fast Fourier Transform) and the concept of logarithmic decrement, respectively. The natural frequency and damping ratio are two important factors to affect the flow rate of the piezoelectric-hydraulic pump. Such a flow rate calculation based on them is covered in the next section.
3. Flow rate of the piezoelectric-hydraulic pump with thin-plate spring check valve
3.1 Phase of the thin-plate spring check valve
In this study, the PZT actuator’s stiffness is high, so the displacement is proportional to the acting force with a sinusoidal form (
cos
where is the maximum displacement of the PZT actuator). When the PZT actuator vibrates, the force acting on the check
valve is proportional to the flow rate generated by the PZT actuator, in other words, proportional to the velocity of the PZT actuator. Therefore, the force acting on the check valve is proportional to the form . As mentioned above, a vibration of the thin-plate spring check valve is simplified as a mass spring system to evaluate the flow rate performance of the hydraulic pump. In consideration of the added liquid mass and added damping, the dynamic equation of the check valve can be written as:
(5)
The parameters , , and stand for the total effective mass of the check valve in liquid environment (, where is the mass of the check valve and is the adding mass of fluid), the added damping, the spring constant of the check valve, and the driving force provided by the PZT actuator, respectively. The particular solution to Eq. 5 can be shown as
sin (6)
where and denotes the frequency -dependent amplitude and phase shift of the check valve respectively, which are expressed as
(7)
arctan
(8)
Where
and are the natural
frequency of check valve and the damping ratio
of the check valve in fluid respectively.
The phase shift is the function of the natural frequency and the damping ratio of the check valve. Both of them depend on the added mass and added damping changing according to the shape of check valve. It is not easy to find out the analytical expression of the natural frequency and the damping ratio of the check valve with its complicated shape. The numerical method introduced in the previous section in the paper is used to determine those of the check valve in liquid. However, through Eq. 8 it can be seen that the phase shift will increase as driving frequency increases. The contribution of phase shift to the flow rate is described in the next section.
3.2 Flow rate performance of piezoelectric -hydraulic pump
The piezoelectric-hydraulic pump presented in this paper (Fig. 6) consists of a piezo stack actuator, a piston, two check valves, and a chamber space. When the PZT actuator is driven by fluctuating voltage, the piezoelectric-hydraulic pump can convert mechanical energy into fluid movement. Table 2 shows the specifications of the PZT used in piezoelectric-hydraulic pump.
The chamber transmission part is a piston which is attached to the PZT actuator and liquid domain. When the PZT actuator is oscillating in extending-shrinking vibration mode, the pressured fluid in the pump chamber makes the check valve alternately open and close. Consequently, the fluid flows from the inlet to outlet continuously.
Fig. 6 Schematic of the piezoelectric- hydraulic pump with the thin-plate spring type check valve
Piezo stack-Model P-225.40 Operating Voltage () 0 to 1000 Closed-loop travel ( ) 60
Unload resonance ( ) 7 Frequency Push/pull
capacity () 12500/2000 Mass(with cable) () 610 Table 2 Specifications of the PZT actuator
The PZT actuator is considered as a spring/mass system with high stiffness and its resonant frequency is a function of its stiffness and effective mass. When the driving frequency is lower than the resonant frequency of the PZT actuator, the piston displacement has a linear relation to the driving force, in other words, the piston displacement is linear with the applied voltage. The pump volume per cycle can be calculated by:
(9)
where is maximum displacement of the PZT actuator (or piston), d is diameter of piston. Then the flow rate is expressed by:
× × (10)
where refers to driving frequency, denotes the volume deflection of the pump
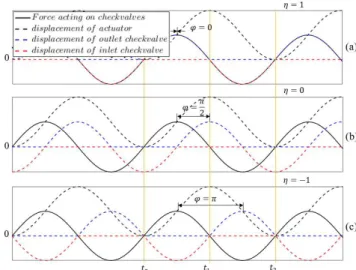
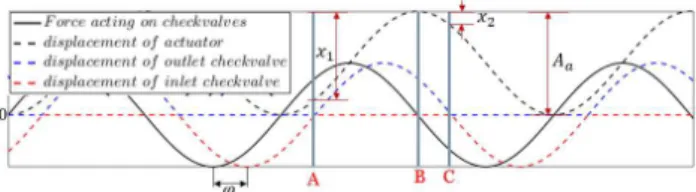
chamber ( depends on the chamber diameter and the maximal displacement of PZT actuator under liquid pressure), is the check efficiency of the check valve. Since the check valve is oscillating at the operating speed, both the valve opening (, defined as frequency dependence amplitude) and the phase shift ( between movement of the actuator and the check valve) exert great influence on the check efficiency of the check valve [15]. The check efficiency depends mainly on the phase shift. As mentioned in this section, the force acting on the check valve is proportional to the derivative of the displacement of the PZT actuator. The displacement of the check valve shown in Eq. 6 has the phase shift with respect to the driving force. The relationship between the displacement of the PZT actuator and the check valve is illustrated for three different phase shift values (Fig. 7).
Fig. 7 The relationship between the displacement of the PZT actuator and the check valves (scaled)
It suggests that the check efficiency of the check valve decreases with increasing phase shift. Each cycle of PZT actuator is divided into 2 processes: one is pushing liquid out of the
chamber (from to in Fig. 7) and another is pulling liquid into the chamber (from to in Fig. 7). With the phase shift is 0 (Fig. 7a), PZT actuator pushes the liquid out of the chamber while inlet check valve closes and outlet check valve opens. That means the whole liquid goes out through outlet check valve. Otherwise, when PZT actuator pulls the liquid out of the chamber, inlet check valve opens and outlet check valve closes. That results in the whole liquid flows into chamber through inlet check valve. Consequently, the liquid flows from inlet to outlet continually and the check efficiency achieves maximum ( ). In the case of the phase shift increasing close to
(Fig. 7b), the incoming and outgoing
flow through each valve is equal in each process.
Therefore, the total flow rate through outlet check valve is zero, that means the check efficiency decreases to zero ( ). In contrast to the first case, with the further increasing of the phase shift to (Fig. 7c), the fluid flows into through the outlet and discharges through the inlet. That contributes to the reverse flow coming forth ( ).
The calculation of check efficiency is based on how much liquid flows out through the outlet check valve. It depends on the displacement of the piston during the opening period of the outlet check valve. The displacement of the check valve and PZT actuator with phase shift are shown in Fig. 8.
Fig. 8 The displacement of the PZT actuator and the check valves with the phase shift ()
Considering the opening period of the outlet
check valve from A to C, the amount of liquid which PZT actuator pushes out of the chamber through the outlet check valve is calculated by formula
×
(11)
where is flow rate which is discharged through outlet in each cycle of the PZT actuator,
represents the height of fluid pushed out, refers to the height of retained fluid, and is the diameter of the piston. With phase shift as ,
and are calculated as the formula below.
(12)
(13)
By substituting and into Eq. 11, the amount of liquid flows through the outlet is expressed as a function of phase and the maximum displacement of PZT actuator in the Eq. 14.
cos cos
××
(14)
It can be seen that Eq. 14 represents the relationship between the amount of liquid flowing out through the outlet and the total liquid exerted by the PZT actuator in each cycle. Therefore, the check efficiency is represented as:
cos cos
(15)
According to Eq. 10 and the above analysis, the flow rate of the pump depends on three factors:
the phase shift, the displacement of the PZT
actuator, and the driving frequency of the PZT actuator. The check efficiency is a function of the phase shift which is affected by the frequency of the driving force. The value and sign of the check efficiency can be varied, depending on the phase shift. For a certain check valve, therefore, the flow rate and the flux direction will change with the changing of operation frequency.
The procedure of the flow rate calculation is summarized as follows; Firstly, determining the displacement of the check valve in liquid by using the FSI analysis simulation. Secondly, calculating the natural frequency and the damping ratio through the displacement response of valve plate after the check valve is considered as a 1 DOF system. Finally, determining the phase shift between the check vale and the PZT actuator, the check efficiency and flow rate by using Eq.
8, Eq. 15 and Eq. 10.
4. Numerical simulation results and discussions
4.1 Check valve responses in ambient fluid in accordance with the gap height
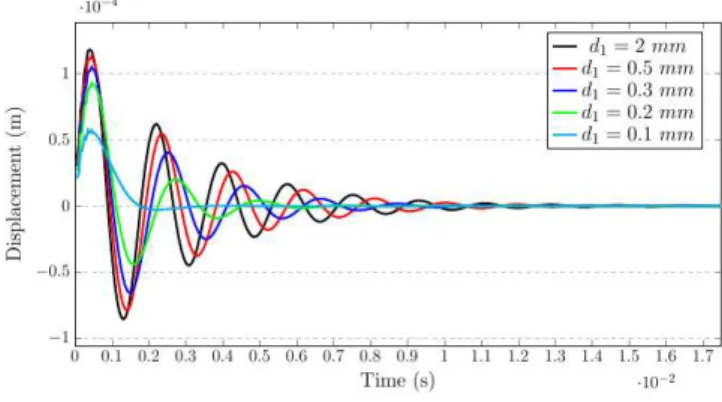
In the following, the effect of gap height , which varied for 0.5 to 0.1 , on the natural frequency of the check valve is investigated. In order to predict the response of check valve with respect to gap height, the FSI analysis of the check valve with different gap heights are performed by using ANSYS program, mentioned in the previous section. The transient amplitude displacement of the valve plate’s center point in MIL-H-83282 oil was shown in Fig. 9.
Fig. 9 Effect of gap height on amplitude displacement of the valve plate
A record of the displacement response of the check valve in liquid can be used to determine the damping ratio. When a single degree of freedom oscillatory system with viscous damping is excited by an impulse input (or the initial velocity excitation), the concept of logarithmic decrement is suitable to estimate the damping ratio. Moreover, with the displacement response, the FFT is used to define the natural frequency of the check valve (Fig. 9). Consequently, the effect of gap height on the damping ratio and check valve’s natural frequency is shown in Table 3.
Gap Height
(mm)
Max.
disp.
(m)
f(Hz) Damping
ratio
0.5 11.31
e-5 526.3 0.7282 0.1151
0.3 10.5
e-5 473.7 0.9576 0.1506
0.2 9.29
e-5 421.1 1.5358 0.2374
0.1 5.74
e-5 210 5.9585 0.6880
Table 3 Summary of results with changing gap height
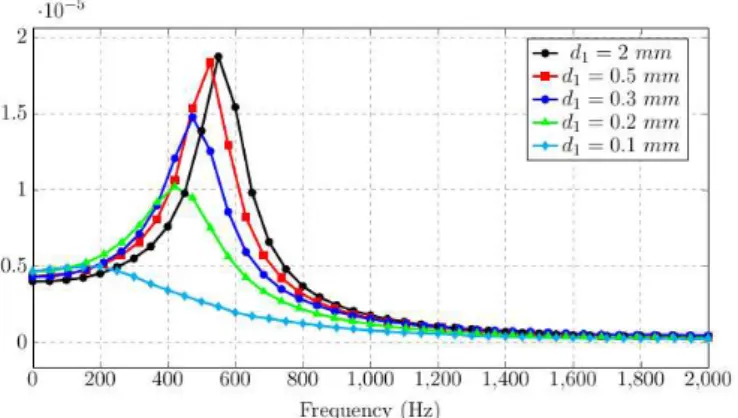
Fig. 10 Effect of gap height on natural frequency of the check valve
In Fig. 10, the resonance frequency is plotted for several gap heights. As the gap height decreases, the natural frequency starts dropping at about . For , the natural frequency is believed to be very close to that of the case in an infinite fluid. In our present study, the largest achievable gap was 0.5 . The decrease in the natural frequency is believed to be caused by increased added mass with decreasing gap height. Fig. 10 displays how decreasing the gap height has a strong effect on natural frequency. Moreover, decrease in the natural frequency as well as increase in added mass and added damping ratio lead to the decrease in amplitude displacement of the valve plate (Fig. 9). In other words, the natural frequency and the oscillation amplitude are proportional to the gap height.
Generally, when the gap height is small, the flow in the gap between the check valve and the pump seat (Fig. 2) performs like a channel flow.
When the check valve moves down towards the pump seat, liquid will be discharged outward from the channel. Since the liquid is discharged outward, the pressure is higher at the channel center. As the gap height decreases, the viscous forces, and consequently the total pressure drop increases. The increased pressure pushes the
check valve away from the pump seat surface.
When the check valve moves up, the pressure in the channel decreases, and the dropped pressure pulls the check valve towards the pump seat surface. Thus, the pressure in the channel regularly opposes the check valve motion. The pressure force is higher for smaller gap (Fig. 5).
That is the reason why decreasing the gap height also leads to the rising in damping ratio (Table 3).
4.2 The frequency-dependent flow rate
The pump shown in this study has a of gap height approximately 0.1 . The displacement of the valve plate in this case is recorded (Fig.
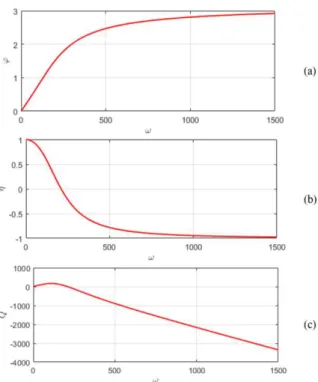
9). Thus, the values of natural frequency and damping ratio are respectively 210 and 0.688 (Table 3) which are used to calculate the flow rate. According to Eq. 8, 15, 10, the phase shift, check efficiency and the flow rate are illustrated in Fig. 11a, b, c, respectively.
The phase shift increases with the rising of operation frequency (Fig. 11a), and the check efficiency of the check valve decreases with the increasing of phase shift (Fig. 11b). Thus, there will be a frequency for the product of and to reach a maximum value (Fig. 11c). When the driving frequency reaches the natural frequency of the check valve at 210 , the phase shift is
that leads the check efficiency toward zero. In
other words, the fluid comes in and out keeping the balance in a cycle of the actuator. When the driving frequency exceeds the check valve’s natural frequency, the direction of flow is inversed and the magnitude of flow increases with increasing driving frequency. Therefore, increasing the operating frequency of the actuator can change the direction of flow without reinstalling the devices.
There is only one optimal range of frequency to achieve maximum flow rate (around 110 ).
To verify the proposed method, a piezoelectric-hydraulic pump was fabricated and tested for flow rate with Mil-PRF-83282 as the hydraulic fluid. The check valves were made of stainless steel 304H, whose thickness is 0.2 . Properties and dimensions of the piezoelectric actuator were listed in Table 2. The experimental devices such as a DAQ program, solenoid valve, high-voltage amplifier, pressure sensor, reservoir, electronic scale were constructed. The selenoid valve connected to the exhaust port of the piezoelectric-hydraulic pump played a crucial role in the exhaust performance test. When the solenoid valve was opened, the flow rate in the no-load state could be measured. If the selenoid valve was closed, a closed loop hydraulic circuit as in a brake system formed. The pressure in the load side could be measured using a pressure sensor.
(a) Schematic diagram
(b) Experimental setup for the test
Fig. 12 Components of the piezoelectric hydraulic pump
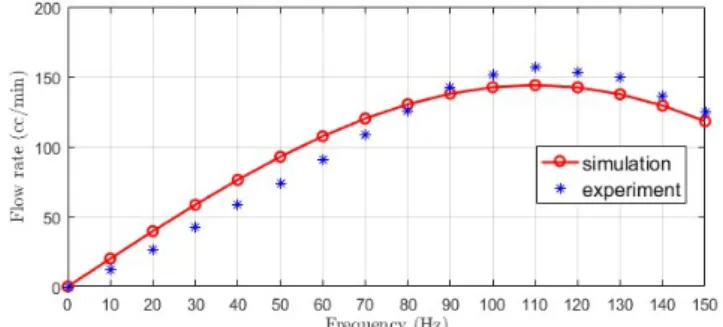
The driving voltage, which is applied to make PZT actuator vibrate, has sinusoidal form with maximum value of 900 V. The piezoelectric- hydraulic pump transfers mechanical energy into fluid movement. To determine the flow characteristics of the piezoelectric-hydraulic pump, the solenoid valve was opened. The liquid flowing through the solenoid valve was measured using an electronic scale. For the accuracy of the experimental data, the average value of the results achieved from several repeated experiments was used. The analytical and experimental flow rate results with an operation frequency range from 0 to 150 were shown in Fig. 13.
Fig. 11 The influence of driving frequency on:
(a) the phase shift; (b) check efficiency;
(c) flow rate
Fig. 13 Comparison between simulation and experimental results
As can be seen in Fig. 13, the simulation predicting flow rate shows good agreement with those obtained from the experiment data. It therefore reveals that the FSI analysis of the check valve in liquid is capable of yielding an accurate prediction for the characteristics of the check valve during operation. The difference may come from the deformation of the O-ring placed around the piston to prevent leaking and the friction caused by the initial compression. Due to those effects, the amount of fluid that is pushed up will be expected to be different from the experiment. The deformation of the O-ring should be further researched to obtain more accurate results.
5. Conclusions
In this paper, the effect of check valve characteristics on the flow rate of the small piezoelectric-hydraulic pump has been investigated. Due to the check valve operates in liquid environment, FSI analysis of check valve should be taken into account. FSI simulation allows study of the vibration behavior of any structural shape in the liquid environment. The obtained results from the FSI analysis suggest that the gap height between the check valve and the solid wall has a strong effect on the response of the check valve which is mainly
affected by added mass and added viscous damping. Because of the effect of solid wall and liquid environment ( ), the natural frequency of the check valve in liquid (210 ) is lower than that in a vacuum. The oscillation of PZT actuator and check valves are different in phase, as shown by the phase variable. That leads to the check efficiency 𝜂 for calculating the flow rate of liquid. The analysis results illustrate that check efficiency, 𝜂 , of the check valve depends on the phase shift, which decreases with the increasing of driving frequency. The lower driving frequency is, the higher check efficiency is obtained.
The simulation predicting flow rate presents a good match with those obtained from the experiment. The maximum flow rate is about 158
min when the driving force operates at a frequency of 110 . The obtained results also show that increasing the natural frequency of the check valve will lead to the increasing product of check efficiency and frequency of driving force.
Consequently, the flow rate performance of the piezoelectric- hydraulic pump will be enhanced.
Acknowledgement
The present study was supported by the Research Fund Support for Basic Research provided by the Agency for Defense Development (ADD-13-01-08-24).
References
[1] Hsiao-Kan Ma, Bo-Ren Hou, Haiyuan Wu, Chin-Yuan Lin, Jing-Jhe Gao, Ming-Chien Kou,
“Development and application of a diaphragm micro-pump with piezoelectric device,” Journal of
Microsystem Technologies, vol. 14, no. 7, pp.
1001-1007, 2008.
[2] P. H. Cazorla, O. Fuchs, M. Cochet, S. Maubert, G.
Le Rhun, P. Robert, Y. Fouillet, E. Defay,
“Piezoelectric micro-pump with PZT thin film for low consumption microfluidic devices,” Journal of Procedia Engineering, vol. 87, pp. 488-491, 2014.
[3] John P Larson, Marcelo J Dapino, “Reliable, high-frequency miniature valves for smart material electrohydraulic actuators,” Journal of Intelligent Material Systems and Structures, vol. 23, no. 7, pp.
805-813, 2012.
[4] Youngbog Ham, Sungjin Oh, Woosuk Seo, Jungho Park, Sonam Yun, “A Piezoelectric Micropump for Microscale Pumping Systems,” Journal of Drive and Control, vol. 36, no. 2, pp. 17-25, 2009.
[5] Daniel J. Laser, Juan G. Santiago, “A Review of Micropumps,” Journal of Micromechanics and Microengineering, vol. 14, no. 6, pp. 35-64, 2004.
[6] Brian D. Iverson, Suresh V. Garimella, “Recent Advances in Microscale Pumping Technologies: A Review and Evaluation,” Journal of Microfluidics and Nano-fluidics, vol. 5, no. 2, pp. 145-174, 2008.
[7] Anirban Chaudhuri, Norman Wereley, “Compact hybrid electrohydraulic actuators using smart material:
A review,” Journal of Intelligent Material Systems and Structures, vol. 23, no. 6, pp. 597-634, 2012,.
[8] Yonghwi Joo, Jaihyuk Hwang, Jiyoun Yang, Jaesung Bae, Junyong Kwon, “On the performance test of the Piezoelectric-Hydraulic Pump,” Journal of The Korea Society for Aeronautical and Space Sciences, vol. 43, no. 9, pp. 706-711, 2015.
[9] Y. M. Sun, G. M. Cheng, P. Zeng, “Driving power supply of single-chamber and single-vibrator piezoelectric pump,” Journal of Applied Mechanics and Materials, vol. 442, no. 9, pp. 386-391, 2014.
[10]J. S. Dong, W. H. Chen, P. Zeng, R. G. Liu, C.
Shen, W. S. Liu, Q. Q. Chen, Y. Yang, Y. Wu, Z.
G. Yang, B. S. Lin, “Design and experiment research on piezoelectric pump with triple vibrators,” Journal
of Microsystem Technologies, vol. 23, no. 8, pp.
3019-3026, 2017.
[11]J. Dong, C. Sheng, Z. Yang, G. Cheng, B. Wu,
“Research on single vibrator gas piezoelectric pump,”
International Conference on Electronic Measurement Instruments, vol. 9, pp. 877-881, 2009.
[12]Junwu Kan, Kehong Tang, Yu Ren, Guoren Zhu, Peng Li, “Study on a piezo-hydraulic pump for linear actuator,” Journal of Sensors and Actuators, vol. 149, no. 2, pp.331-339, 2009.
[13]A. Benaissa, S. Belkhiat, “Performance analysis of a piezo-pump,” The European Physical Journal Conferences, vol. 29, pp. 7-8, 2012.
[14]W. Y. Shih, X. Li, H. Gu, W. H. Shih, I. A. Aksay,
“Simultaneous liquid viscosity and density determination with piezoelectric unimorph cantilevers,”
Journal of Applied Physics, vol. 89, no. 2, pp.
1497-1505, 2001.
[15]G. Y. Chen, R.J. Warmack, T. Thundat, D. P.
Allison, A. Huang, “Resonance response of scanning force microscopy cantilevers,” Review of Scientific Instruments, vol. 65, no. 8, pp. 2532-2537, 1994.
[16]G. Y. Chen, R. J. Warlock, A. Huang, T. Thundat,
“Harmonic response of near-contact scanning force microscopy,” Journal of Applied Physics, vol. 81, no.
3, pp. 7709-7714, 1997.
[17]Tikeswar Naik, Ellen K.Longmire, Susan C. Mantell,
“Dynamic response of a cantilever in liquid near solid wall,” Journal of Sensors and Actuators, vol.
102, no. 3, pp. 240-254, 2003.
[18]S.S. Chen, M.W. Wambsganss, J.A. Jendrzejczyk,
“Added mass damping of a vibrating rod in confined viscous fluids,” Journal of Applied Mechanics, vol.
43, no. 2, pp. 325-329, 1976.