Vibration Characteristics of the Grid Cage Assembly
K. H. Lee, H. S. Kang, K. H. Yoon, K. N. Song, H. K. Kim, T. H. Chun and K. W. Song PWR Fuel Development, KAERI,150 Dukjin, Youseong, Daejeon,
1. Introduction
Newly developed PWR nuclear fuel should received massive out-of-pile tests for verifying its performances prior to in-pile reactor evaluation. KAERI constructed the test facility, called the Fuel Assembly Mechanical Characterization Tester (FAMeCT), to carry a series of static and dynamic mechanical tests to determine the structural characteristics of the nuclear fuel on a full size model basis. These test series cover vibration, impact and stiffness characteristic tests in air.
To setup the test procedure and methodology, the stripped fuel bundle without fuel rods or more commonly referred to as a "grid cage" has been tested in air, room temperature for estimating the lateral vibration characteristics using a sine swept testing. Due to the highly nonlinear behavior of the structure, these characteristics were to be determined over a certain range of the excitation amplitude and frequency [1]. The test grid cage is initially pre-loaded at the begin of life time (BOL) hot condition by the deflection of the upper core plate simulator. Different preloading condition (360 lbs release from the BOL condition) is also applied for an evaluation of the preload effect. The test results will also be used to verify future finite element models and as base data for further experimental and theoretical analysis.
2. Methods and Results
It is widely known that a fuel assembly has highly nonlinear behaviors which can vary the dynamic properties of the bundle according to the excitation force. To evaluate the nonlinear characteristics of the bundle for an exciting condition, sine swept testing should be generally performed by maintaining the shaking force at a certain target value for the fixed swept duration by an external closed loop control scheme.
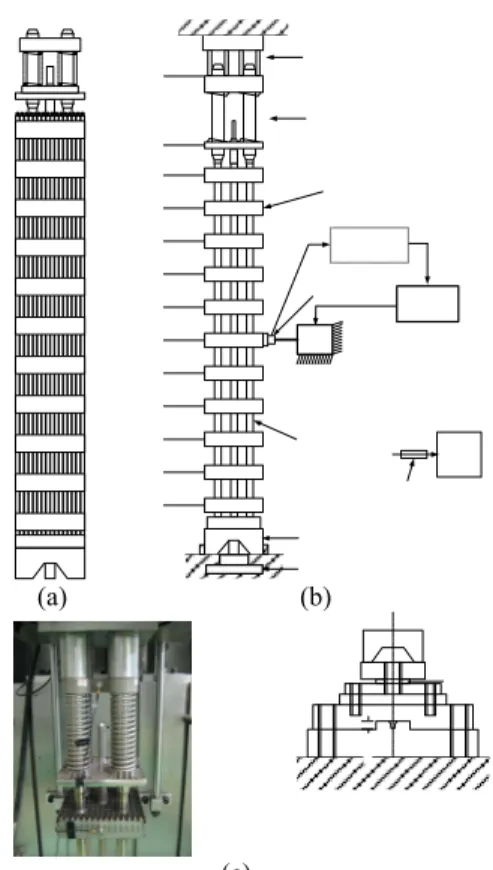
The grid cage assembly was positioned vertically in the test stand mounted on a vibration isolation base and restrained at the top and bottom nozzles with core plate simulators of the reactor core support conditions as in figure 1. The test assembly was axially pre-loaded to 15 mm holddown spring deflection to approximate in-core BOL hot condition. Strain gauge type linear gauges were used at each grid location to measure the lateral displacement. During the swept sine testing, an electro-magnetic shaker was attached to the fuel assembly at the 6th grid location to apply the shaking force through the metal stinger. The schematic of the overall test is also shown in figure 1. The shaker input force was varied from 2N to 6N by 1N, but up to 10N for only BOL hot condition. The shaker output frequency was
varied from 2.5 to 60 Hz at a log sweep rate of 0.2 to 1 octave/period. The input from an electromagnetic shaker and the output from the linear gauges were stored on a data acquisition system (SYSTEM 6000) and were analyzed using I-DEAS TDAS. A typical trace of the linear gauges displacement for the shaking force of 0.5 N is displayed in figure 2. The maximum vibration amplitude at 6th grid appears 0.4 mm at the time duration associated with swept frequency of around 8.0 Hz. With the approach and leave to the resonance frequencies of the bundle, a sonic noise and a mechanical disorder of the rod bundle clearly appears. The fundamental natural frequency, damping and mode shape can be obtain from modal analysis of sine post processing using I-DEAS TDAS software [2] and time domain modal estimator of the MTS Reporter software. Table 1 and 2 show the grid cage assembly free vibration characteristics (natural frequency and percent of damping ratio) with respect to five shaking forces for the two different preload conditions (BOL, Released). The grid cage assembly natural frequencies and percent of damping ratios decreased with increasing input shaking forces. Fundamental natural frequency for 2 N is 8.5 Hz for the BOL hot condition. The second and third natural frequencies for the same shaking force and preload are 18.5 Hz and 30.8 Hz. Figure 3 displays a variation of these vibration characteristics with respect to the shaking forces for the two preload conditions. Similar trends of a decaying due to an increase of the input forces are displayed. Figure 4(a) shows typical grid cage assembly bending vibration mode shapes up to the 3rd as expected in a simply supported single beam
and figure 4 (b) displays the 2nd mode shape indicating mode distortion mainly due to the bad location of the excitation or some nonlinear effect of the system. Change of the excitation location can solve that problem. The grid cage vibrational damping for a fundamental natural frequency depends mainly on the input shaking force with the damping value ranging from 7 to 18 percent and minorly on the preload effect of the mounting condition. There is no trend and meaningful results of the grid cage damping according a preload under these limited cases of the test, but further experimental research using different damping measurement techniques, such as a pluck testing, is required. Fig. 5 displays a summary of a comparison of natural frequency and damping ratio with respect to the two preload conditions.
3. Summary and Conclusion
Sine swept testing for estimating the dynamic properties of the grid cage assembly was performed. Test modal analysis shows the first natural frequency of
Transactions of the Korean Nuclear Society Autumn Meeting Busan, Korea, October 27-28, 2005
the bundle is about from 7.1 to 8.5 Hz with a variation of the shaking forces at the BOL hot condition. After that the 2nd and 3rd modes are 18.2 to 19.6 Hz, 30.3 to
31.0 Hz at the same preload. Preload release makes the grid cage natural frequency a bit higher with a maximum difference of 3%. Grid cage vibrational damping ratio shows 7-18 % decreasing trend during an increasing shaking force and has no meaningful results on the preload change. Mode shapes up to the 3rd mode can be estimated reasonably by applying an input shaking force at the 6th grid, except the 2nd mode due to a space distortion by the excitation.
Acknowledgements
This project has been carried out under the nuclear R&D program by MOST.
References
[1] H.N. Rhee, Fuel Assembly Mechanical Test Report, KNU-FMDE-TR01, KAERI, 1989
[2] SDRC, "I-DEAS Master Series 8.0", Structural Dynamics Research Corporation, OH, USA, 2000.
Table 1 Natural frequency (ω ) and damping ratio(ζ ) for BOL condition
1st 2nd 3rd
Force (N)
Natural frequency, Hz (Damping ratio,%)
2.0 8.51(18.33) - 30.82(15.52) 3.0 8.01(9.78) 18.26(8.05) 31.03(3.32) 4.0 7.72(8.62) 18.36(14.63) 30.89(3.13) 5.0 7.62(7.98) 19.10(11.90) 30.76(3.17) 6.0 7.50(8.54) 19.39(11.33) 30.63(2.97) 8.0 7.26(7.81) 19.28(9.92) 30.48(2.93) 10.0 7.10(7.35) 19.58(8.40) 30.25(2.80)
Table 2 Natural frequency (ω ) and damping ratio(ζ ) for released preload
1st 2nd 3rd Force
(N) Natural frequency, Hz (Damping ratio, %)
1.0 10.06(10.86) - - 2.0 8.59(9.07) 18.68(16.20) 32.58(6.89) 3.0 8.13(8.33) - 31.52(4.55) 4.0 7.95(8.90) 18.73(8.38) 31.22(4.08) 5.0 7.78(9.13) 18.82(10.17) 31.4(4.00) 6.0 7.64(8.21) 18.99(9.22) 31.16(3.64) (a) (b)
Fig. 4 (a) Typical vibration mode shapes up to 3rd, (b) 2nd mode shape according to the shaking force.
(a) (b)
(c)
Fig. 1 (a) Schematics of the fuel assembly, (b) test setup for grid cage assembly, (c) upper and lower core plate simulator.
Fig. 2 Typical vibration trace during sine swept testing.
(a) (b)
Fig. 3 Natural frequency and damping ratio according to the shaking force; (a) released compression, (b) BOL condition.
(a) (b)
Fig. 5 Comparison of natural frequency and damping ratio v.s. input shaking force with respect to two preload conditions.