1. INTRODUCTION
In general, when a tensile load is applied at the bolted connection, shear stress occurs in the direction of the grain, and embedding due to the bolt or artificial splitting, dependent on the di- rection of grain may occur at the time when the bolt connection hole is made. Ultimately, this
leads to the failure of the structural member. In particular, in the case of the wood as lamina that comprises glulam as an anisotropic material, the degree of embedment and progress of split- ting differs depending on the direction of the load. The standard allowed shear strength used for timber structure designs is the European yield model (EYM) expression that was adopted
1Date Received October 14, 2014, Date Accepted June 25, 2015
2Division of Wood Engineering, Department of Forest Products, Korea Forest Research Institute, 57 Hoegiro, Dongdaemun-gu, Seoul 130-712, Republic of Korea
3Program of Forest Biomaterials Engineering, Division of Forest Material Science & Engineering, College of Forest and Environmental Sciences, Kangwon national university, 1 Kangwondaehak-gil, Chuncheon-si, Gangwon-do 200-701, Republic of Korea
† Corresponding author: Soon-il Hong ([email protected])
Bearing Strength of Glass Fiber Reinforced Glulam Bolted Connection
1Keon-ho Kim2⋅Soon-il Hong3,†
ABSTRACT
To study the bearing characteristics of glass fiber reinforced glulam for structural design, bearing strength tests were performed. Bearing loads were applied in the direction parallel to the grains, and the holes were pre- pared in such a way that the bolts would bear and support all the layers. The yield bearing strengths of the glass fiber reinforced glulam were found to be similar to those of the non-reinforced glulam, and were almost constant regardless of increases in bolt diameter. The ratio of the experimental yield bearing strength to the es- timated bearing strength according to the suggested equation of the Korea Building Code and National Design Specification was 0.91∼1.03. For the non-reinforced glulam and the sheet glass fiber reinforced plastic glulam, the maximum bearing load was measured according to the splitting fracture of specimens under bolt. The tex- tile glass fiber reinforced glulam underwent only an embedding failure caused by the bearing load. The failure mode of reinforced glulam according to bearing load will influence the failure behavior of bolted connection, and estimating the shear yield strength of the bolted connection of the reinforced glulam is necessary, not only by using the bearing strength characteristics but also using the fracture toughness of the reinforced glulam.
Keywords : reinforced glulam, glass fiber, bolted connection, bearing strength, splitting fracture
by the National Design Specification (American Society of Civil Engineering, 1997). In the EYM, the bending strength of a bolt and the bearing strength of wood-based material are very important factors. Wilkinson (1991) discussed the relationship of the bearing strength with the direction of load, the density of timber and the diameter of the fastener. Rammer and Winistorfer (2001) discussed the effects of the moisture content of wood on the bearing strength. As stated, the characteristics of wood-based material and fasteners affected the bearing strength. In the case of reinforced wood-based material, the strength characteristics of the reinforcement material and the config- urations with wood-based material would need to be identified. The bearing strength character- istics of the reinforced wood-based material would need to be applied when estimating the yield load of the reinforced bolted connection in a timber structure. However, current studies related to bearing stress characteristics are mostly limited to wood and wood-based materials.
In this study, bearing strength tests were conducted to compare the bearing character- istics of larch glulam and reinforced glulam with glass fiber. As fasteners for the bearing test, bolt diameters of 12 mm, 16 mm and 20 mm were used. Types of glass fiber as the reinforcement were sheet GFRP and textile glass fiber. The 5% yield bearing strengths on type of bearing test specimens were compared and evaluated.
2. MATERIALS and METHODS 2.1. Test Materials and Reinforcements
The lamination material used for the pro- duction of glulam was larch (Larix kaempferi Carr.), and the dimensions of the lamina were 100 mm × 20 mm × 3600 mm. The average moisture content of these laminae was 12%
and the average specific gravity was 0.54. The reinforcement material used in the reinforced glulam was made of glass fibers. Based on the orientation of the glass fibers, the type of reinforcement was classified into textile glass fibers and sheet GFRP. The glass fiber bundles of textile type were arranged in a plain weave direction (parallel to the grain and orthogonal direction), and the thickness was 0.5 mm. For the sheet GFRP, the extruded glass fibers were arranged in the longitudinal direction (parallel to the grain), and the thickness was 1 mm.
2.2. Bearing test specimen preparation
The control glulam (hereinafter referred to as CO) was comprised of 5-ply laminae. For the reinforced glulam, reinforcement material was placed in between the outermost lamina and in- ner lamina. For the sheet GFRP, the direction the fibers was arranged to be parallel to the longitudinal direction of glulam and the layers were plied. Resorcinol adhesive was used for the glulam and textile glass fiber reinforced glulam (hereinafter referred to as GT), and for the sheet GFRP reinforced glulam (hereinafter
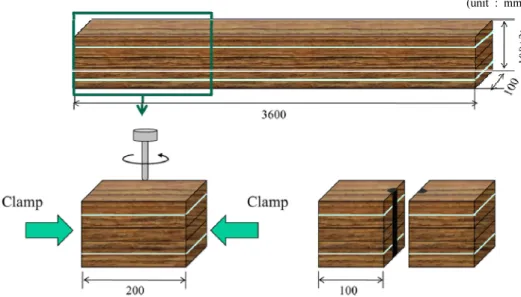
referred to as GS), a vinyl acetate resin type adhesive of MPU500/HH60 was used. As shown in Fig. 1, the bearing strength test speci- mens were cut in the longitudinal direction of the reinforced glulam in 100 mm lengths and were produced as cube-shaped test specimens.
Two of the cut test specimens were fixed using clamps in order to make bolted connection holes that traversed one surface of each of the test specimens using a carpentry drill. A total of 90 test specimens comprised of 10 of each specimen type that corresponded with the types of reinforced glulam and the diameter of bolt hole were used.
2.3. Bearing Strength Test
In accordance with KS F 2156 (Korean Standards Association, 1998), bearing strength tests were conducted. The bearing load was ap-
plied in the direction parallel to the grain, and for the embedment 50 mm displacement trans- ducers were installed in the front and back of the bolt. The average value of the measured strain was used (Fig. 2). The bearing strength tests were performed until the maximum load was reached within 60 ± 30 seconds after the start, or until the embedment of the test speci- men reached one-half of the bolt connection hole. The yield bearing strength means the 5%
yield bearing load of the unit area measured in the test, and it was obtained as follows.
×
··· (1) P : 5% offset yield load (N)
L : Depth of glulam (mm) D : Bolt diameter (mm)
The 5% offset yield load for each test speci- men was obtained by the KS F 2156, and in
(unit : mm)
Fig. 1. Bearing test specimens preparation.
the graph that showed the maximum bearing load due to a momentary beak after the yield point, it was moved 2% in parallel on the di- ameter and used the 2% offset yield load that intersected the load-deformation curve.
2.4. Estimated Bearing Strength
Empirical formulas for estimating bearing strength have been suggested by numerous researchers and design standards, and most estimating empirical formulas are empirical formulas that are obtained through solid wood and are expressed in terms of the spe- cific gravity (G) of that and the diameter of fastener (D). The estimated bearing strengths as suggested by the estimating formulas are div- ided into: 1) when the direction of load is par-
allel to the grain and 2) when the direction of load is perpendicular to the grain. In the case of Korea, the Korean Building Codes (KBC) suggests the following equations when the di- rection of load is parallel to the grain and when the direction of load is perpendicular to the grain (Architectural Institute of Korea, 2005).
When the direction of load is parallel to the grain:
··· (2)
When the direction of load is perpendicular to the grain:
··· (3)
In addition, the National Design Specification (NDS) uses the following equation. This equa- Fig. 2. Schematic diagrams and photo of bearing strength test.
tion was proposed by Soltis et al. (1986).
When the direction of load is parallel to the grain:
··· (4)
When the direction of load is perpendicular to the grain:
··· (5)
Hirai’s equation is an estimating equation that was derived from test specimens that are 0.38
∼0.55 in the proportion of wood as follows (Hirai, 1989). The diameter (d) is diameter of the bolt and it is expressed in mm.
When the direction of load is parallel to the grain:
··· (6)
When the direction of load is perpendicular to the grain:
··· (7)The estimating equations selected by the Eurocode5 (2004, hereinafter referred to as EC5) were proposed by Whale and Smith (1989).
When the direction of load is parallel to the grain:
··· (8)
When the direction of load is perpendicular to the grain:
··· (9)
3. RESULTS and DISCUSSION 3.1. 5% Yield Bearing Load According
to Bolt Diameter
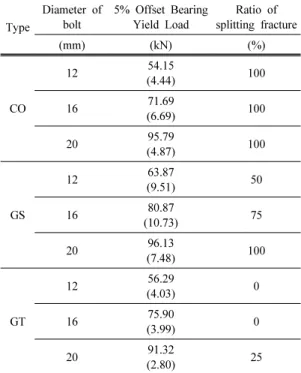
Table 1 shows the comparison of the 5% off- set yield loads of the glulam and reinforced glulam in terms of the diameter. The average yield bearing load of the CO test specimens us- ing a 12 mm bolt was 54.2 kN, and when the bolt diameter increased to 16 mm and 20 mm, the load increased by 32% and 77%, respectively. The average yield bearing load of
Type
Diameter of bolt
5% Offset Bearing Yield Load
Ratio of splitting fracture
(mm) (kN) (%)
CO
12 54.15
(4.44) 100
16 71.69
(6.69) 100
20 95.79
(4.87) 100
GS
12 63.87
(9.51) 50
16 80.87
(10.73) 75
20 96.13
(7.48) 100
GT
12 56.29
(4.03) 0
16 75.90
(3.99) 0
20 91.32
(2.80) 25
Note: The values in parentheses are standard deviations.
Table 1. Experimental bearing yield load and ratio of failures on types of reinforced glulam
the GS test specimens using a 12 mm bolt was 63.9 kN, and those of 16 mm and 20 mm in- creased more than 1.27 times and 1.51 times, respectively, as compared to the 12 mm test specimen. For the GT test specimens (GT12), the average yield bearing load of the test speci- men using a 12 mm bolt was 56.3 kN. When the bolt diameter increased to 16 mm and 20 mm, the average yield bearing loads increased by 1.35 times and 1.62 times, respectively, compared to the 12 mm test specimen. The control and the reinforced glulam showed that the yield bearing load increased with the incre- ment of the bolt diameter.
3.2. Comparison of Yield Bearing Strengths of Reinforced Glulam
The yield bearing strength of the control glulam using 12 mm bolt was 45.13 MPa and it showed a nearly constant value even when the diameter of bolt increased. The value of the control glulam increased more than 1.5 times as compared to that of the larch solid wood, and increased more 1.36 times than a pine tree with 12% moisture content (Gupta and Vatovec, 1996). Park et al. (2005) stated that when the bearing load is applied in the direction perpen- dicular to the grain, the bearing strengths of the larch glulam with 12 mm, 16 mm and 20 mm bolt diameters were about 10% greater com- pared to the larch timber. This was due to the fact that the adhesive that is used in compress- ing layers during the manufacturing process of glulam increases the weight. As the bolt diame-
ter increased, the yield bearing strength of the GS test specimens showed similar results to those of the CO test specimens without any no- table trend. The GT test specimens, regardless of the diameter, also showed an almost constant yield bearing strength. The yield bearing strengths of the GS20 and GT20 test specimens were seen to be similar to those of the CO20 test specimens, and we confirmed that this was attributable to the fact that as the bearing strength area increased per increase in the bolt diameter, the bearing stress characteristics of the glulam more so than the reinforcement ma- terial had greater effects on the yield bearing strength.
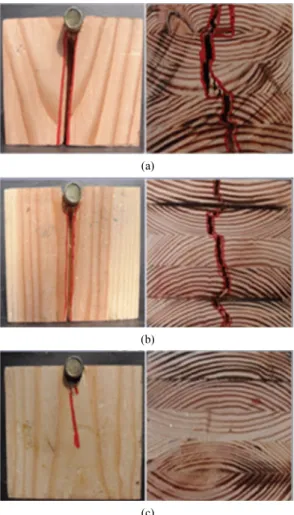
3.3. Comparison of Failure mode on bearing specimens
In the case of the control glulam, the failure modes for the CO12, CO16 and CO20 test specimens were splitting fractures throughout all the layers in the direction of grain. Currently, the lengths of test specimens based on the KS F 2156 are regulated to be greater than 4 times the diameter of the fastener and a minimum of 50 mm. As the length of the bearing specimens is too short, most of the bearing maximum load is measured based on the splitting fractures of the glulam in bearing strength tests of larch glulam. Hwang et al. (2008) reported that the strain of wood by bearing load applied in the direction perpendicular to the grain needs to be measured, and in consideration of the internal deformation of wood, the minimum end dis-
tance needs to be acquired more than the current 7D. In cases of the bearing specimens loaded in the parallel direction, for the reli- ability of the bearing stress characteristics of the glulam, the factors related to the length of the test specimen would need to be considered.
In the sheet GFRP reinforced glulam, as the diameter increased, similarly to the CO test specimens, splitting fractures occurred through- out all the layers after the glulam and reinforce-
ment material were embedded together in the direction of the grain. This is thought to be at- tributable to the fact that the sheet GFRP was aligned parallel to the direction of the grain.
The splitting of the test specimens due to the bearing load was transmitted to the reinforce- ment material and was transitioned to the outer- most lamina. In the case of the textile glass fiber reinforced glulam, unlike the CO test specimens and GS test specimens, only the em- bedding failure caused by the load occurred (Fig. 3). This is believed to be because the glass fiber bundles of textile reinforcement that were aligned in the orthogonal direction to the load inhibit the splitting of glulam, thereby mostly resulting in embedment without the splitting of translation between laminations.
3.4. Comparison of Experimental Bearing Strength (5% yield bearing strength) and Estimated Bearing Strength
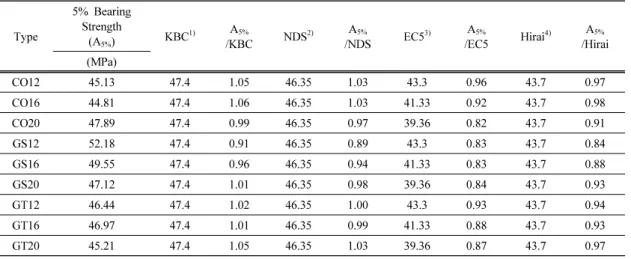
Table 2 shows the comparison of the esti- mated bearing strength suggested by each of the design standards and the 5% experimental yield bearing strength, when the bearing load was applied in the direction parallel to the grain.
The ratio of experimental yield bearing strength to estimated bearing strength was 0.91
∼1.06 in the case of the KBC, and this value was similar to the experimental yield bearing strength. Park et al. (2005) showed that the estimated bearing strength suggested by the NDS for specimens was 1.4 times bigger than the experimental yield bearing strength.
(a)
(b)
(c)
Fig. 3. Typical failure modes of test specimens (a-CO, b-GS, c-GT).
However, in the experiment of our study, the estimated bearing strength suggested by the NDS for the control glulam was well matched at 0.89∼1.03 times the experimental yield bearing strength. The EC5 showed values that were 17% less using the KBC value as the ba- sis, and the values decreased by 1.03∼1.26 times compared to the experimental yield bear- ing strength. In particular, the EC5 displayed, in the estimating equation, a tendency of de- creasing estimated bearing strength in accord- ance with increases in the diameter. Hirai showed values that were 8% less using the KBC value as the basis, and the values were seen to be 0.84∼0.98 times of the ex- perimental yield bearing strength. As such, the estimated bearing strengths of the larch glulam and the reinforced glulam best matched the val- ues of the KBC and NDS.
4. CONCLUSION
The yield bearing strength of the larch glu- lam was almost a constant value, regardless of the diameter. The yield bearing strengths of the sheet GFRP reinforced glulam and the textile glass fiber reinforced glulam were, regardless of the bolt diameter, shown to be similar to that of the larch glulam. As such, we confirmed that, for the bearing strength of the glass fiber reinforced glulam, the bearing characteristics of the glulam itself exerted greater effects than the reinforcement material. The failure mode as a result of the bearing strength was divided by reinforcements. In the case of the sheet GFRP reinforced glulam, we confirmed that the embedding and splitting by the bearing load were being transitioned to all layers through the reinforcement material. The failure of the textile
Type
5% Bearing Strength
(A5%) KBC1) A5%
/KBC NDS2) A5%
/NDS EC53) A5%
/EC5 Hirai4) A5%
/Hirai (MPa)
CO12 45.13 47.4 1.05 46.35 1.03 43.3 0.96 43.7 0.97
CO16 44.81 47.4 1.06 46.35 1.03 41.33 0.92 43.7 0.98
CO20 47.89 47.4 0.99 46.35 0.97 39.36 0.82 43.7 0.91
GS12 52.18 47.4 0.91 46.35 0.89 43.3 0.83 43.7 0.84
GS16 49.55 47.4 0.96 46.35 0.94 41.33 0.83 43.7 0.88
GS20 47.12 47.4 1.01 46.35 0.98 39.36 0.84 43.7 0.93
GT12 46.44 47.4 1.02 46.35 1.00 43.3 0.93 43.7 0.94
GT16 46.97 47.4 1.01 46.35 0.99 41.33 0.88 43.7 0.93
GT20 45.21 47.4 1.05 46.35 1.03 39.36 0.87 43.7 0.97
1) KBC : Korea Building Code
2) NDS : National Design Specification for Wood Construction 3) EC5 : Eurocode 5
4) Hirai : Hirai’s equation
Table 2. Comparison of experimental and estimated 5% Bearing Strength
glass fiber reinforced glulam, due to the orthog- onal glass fibers’ inhibitory effect on splitting of the glulam, ended up in embedding failure.
ACKNOWLEDGEMENT
This research was supported by Basic Science Research Program through the National Research Foundation of Korea (NRF) funded by the Ministry of Education, Science and Technology (2009-0075285).
REFERENCES
American Society of Civil Engineers. 1997. National design specification for timber construction of U.S. ASCE. New York.
Architectural Institute of Korea. 2005. Korean Government Guidelines of Korean Buildings Code-Structural. KGG-KBCS-08.
EN-1995-1-1. 2004. Eurocode 5: Design of timber structures part 1-1: general rules and rules for buildings. CEN, European Committee for Standardization, Brussels.
Gupta, R., Vatovec, M. 1996. Evaluation of dahurian larch in mechanical connections. Forest Products Journal 46(9): 89∼93.
Hirai, T. 1989. Basic properties of mechanical wood-joints II: bearing properties of wood under a bolt. Res. Bull. The College Experiment
Forest, Faculty of Agriculture, Hokkaido University 46(4): 967∼988.
Hwang, K.H., Park, B.S. 2008. Lateral compression and dowel bearing property of Japanese larch grown in Korea. Journal of the Korean Wood Science and Technology 36(3): 61∼69.
Korean Standards Association. 1998. KS F 2156 Method of dowel - bearing strength test for wood and wood - based products. Korea Agency for Technology and Standards, Ministry of Knowledge Economy, Gwacheon.
Park, C.Y., Kim, K.M., Lee, J.J. 2005. Strength property of double shear bolted-connections of larch. Journal of the Korean Wood Science and Technology 33(1): 7∼16.
Rammer, D.R., Winistorfer, S.G. 2001. Effect of moisture content on dowel-bearing strength.
Wood and fiber science 33(1): 126∼139.
Soltis, L.A., Hubbard, F.K., Wilkinson, T.L. 1986.
Bearing strength of bolted timber joints. Journal of Structural Engineering. 112(9): 2141∼2154.
Whale, L.R.J., Smith, I. 1989. A method for measur- ing the embedding characteristics of wood and wood-based materials. Materials and Structures 22: 403∼410.
Wilkinson, T.L. 1991. Dowel bearing strength. Res.
Pap. FPL-RP-505 Madison, WI: U.S. Department of Agriculture, Forest Service, Forest Products Laboratory.