사천 연안 새우조망에서 부수 어획된 어류의 군집구조
송세현·정재묵*·유준택·김희용1
국립수산과학원 수산자원연구센터, 1국립수산과학원 연구기획과
Species composition of bycatch in the shrimp beam trawl fishery of coastal Sacheon, Korea
Se Hyun SONG, Jae Mook JEONG*, Joon Taek YOO and Hee Yong KIM1
Fisheries Resources Research Center, National Institute of Fisheries Science, Tongyeong 53064, Korea
1Research and development planning Division, National Institute of Fisheries Science, Busan 46083, Korea
A study for species composition and abundance of the fish assemblages in the coastal Sacheon Bay, Korea were conducted using monthly collection by a shrimp beam trawl from March 2015 to February 2016. The number of individuals, biomass and species diversity indices fluctuated with the station and month. Of all 73 species collected, the dominant species in terms of numbers were Liparis tanakae, Zoarces gillii, Amblychaeturichthys hexanema, Ricuzenius pinetorum and Pleuronichys cornutus. The peak number of fishes occurred in March and April, whereas the biomass of fishes was highest in April.
The numbers and biomass of fishes were lower in February corresponding with the low temperature, and diversity indices were highest in June. Due to those seasonal difference in abundance of the dominant species, fish community were divided into three main groups. In addition, seasonal difference by station of fish community were devided into four main groups.
Juvenile fishes of coastal Sacheon were presented during the study period. It presented that the study area served as an important role in spawning and nursery ground for fisheries resource.
Keywords : Composition of fish species, Sacheon, Shrimp beam trawl fisheries
서 론
서해와 동해에 비해 다양한 어류가 서식하고 있는 남 해는 동중국해, 동해로 연결되는 여러 수괴와 연안수의 영향을 받고 있어(Han et al., 2002; Ko et al., 2010) 멸치, 대구를 비롯한 주요 어류의 산란장과 성육장으로 알려 져 있다(Yamada et al., 1986; Lee, 1996; Lee et al., 2000;
Kim et al., 2003a, b; Baeck et al., 2005). 특히 사천
해역은 두 개의 큰 섬으로 둘러싸여 있고, 상대적으로 좁은 세 개의 수로를 통하여 해수가 유입되는 반 폐쇄만 (semi-enclosed bay)의 특징을 보인다(Woo, 2007). 또한 얕은 수심과 풍부한 영양염을 바탕으로 다양한 해양생 물이 출현해 생태적 측면에서 중요한 역할을 수행하고 있다.
종조성과 관련된 기존의 연구들은 저인망, 유자망, 통 발어구 등 다양한 어구를 이용한 어류의 계절별 종조성
*Corresponding author: [email protected], Tel: +82-55-650-2231, Fax: +82-55-650-2206 pISSN 1225-827X
eISSN 2287-4623
J Korean Soc Fish Ocean Technol, 54(3), 204-216, 2018 http://dx.doi.org/10.3796/KSFOT. 2018. 54. 3. 204
FISHERIES OCEAN TECHNOLOGY
www.fishtech.or.kr
<Original Article>
사천 연안 새우조망에서 부수 어획된 어류의 군집구조
송세현·정재묵*·유준택·김희용1
국립수산과학원 수산자원연구센터, 1국립수산과학원 연구기획과
Species composition of bycatch in the shrimp beam trawl fishery of coastal Sacheon, Korea
Se Hyun SONG, Jae Mook JEONG*, Joon Taek YOO and Hee Yong KIM1
Fisheries Resources Research Center, National Institute of Fisheries Science, Tongyeong 53064, Korea
1Research and development planning Division, National Institute of Fisheries Science, Busan 46083, Korea
A study for species composition and abundance of the fish assemblages in the coastal Sacheon Bay, Korea were conducted using monthly collection by a shrimp beam trawl from March 2015 to February 2016. The number of individuals, biomass and species diversity indices fluctuated with the station and month. Of all 73 species collected, the dominant species in terms of numbers were Liparis tanakae, Zoarces gillii, Amblychaeturichthys hexanema, Ricuzenius pinetorum and Pleuronichys cornutus. The peak number of fishes occurred in March and April, whereas the biomass of fishes was highest in April.
The numbers and biomass of fishes were lower in February corresponding with the low temperature, and diversity indices were highest in June. Due to those seasonal difference in abundance of the dominant species, fish community were divided into three main groups. In addition, seasonal difference by station of fish community were devided into four main groups.
Juvenile fishes of coastal Sacheon were presented during the study period. It presented that the study area served as an important role in spawning and nursery ground for fisheries resource.
Keywords : Composition of fish species, Sacheon, Shrimp beam trawl fisheries
서 론
서해와 동해에 비해 다양한 어류가 서식하고 있는 남 해는 동중국해, 동해로 연결되는 여러 수괴와 연안수의 영향을 받고 있어(Han et al., 2002; Ko et al., 2010) 멸치, 대구를 비롯한 주요 어류의 산란장과 성육장으로 알려 져 있다(Yamada et al., 1986; Lee, 1996; Lee et al., 2000;
Kim et al., 2003a, b; Baeck et al., 2005). 특히 사천
해역은 두 개의 큰 섬으로 둘러싸여 있고, 상대적으로 좁은 세 개의 수로를 통하여 해수가 유입되는 반 폐쇄만 (semi-enclosed bay)의 특징을 보인다(Woo, 2007). 또한 얕은 수심과 풍부한 영양염을 바탕으로 다양한 해양생 물이 출현해 생태적 측면에서 중요한 역할을 수행하고 있다.
종조성과 관련된 기존의 연구들은 저인망, 유자망, 통 발어구 등 다양한 어구를 이용한 어류의 계절별 종조성
*Corresponding author: [email protected], Tel: +82-55-650-2231, Fax: +82-55-650-2206
변화 및 양적 변동에 관해 조사한 내용이 대부분을 차지 하고 있었다(Kim and Kang, 1991; Lee, 2001; Kim, 2006; Oh, 2006). 사천 해역과 유사한 내만의 특성을 가지는 해역인 도암만과 강진만에서의 군집구조에 관한 연구(Kim et al., 2003a; Kim et al., 2003b), 여자만(Lee et al., 2011)에서 새우조망을 통한 종조성 연구가 있었 고, 진해만과 진주만을 비교하는 연구(Song et al., 2012) 에서도 새우조망어구를 이용하여 어류자원의 종 조성 변화를 파악하는 연구를 주로 하였다. 그 밖에도 연안에 서의 지리적 특성상 장소가 협소한 곳에서 사용이 쉽고 정량적 조사가 가능해 새우조망어구를 이용한 어류 종 조성 연구가 다수 수행되었다(Kim et al., 2003a; Kim et al., 2003b; Oh et al., 2009; Oh, 2010). 새우조망어업 은 연안 어장에서 작은 망목으로 저층을 예망하여 어획 하므로 새우류 이외의 다른 부수어획물이 많이 혼획되 기 때문에 수산자원에 미치는 영향이 매우 커서 어기 및 어구 등에서 많은 규제를 받고 있다(Jang et al., 2009).
새우조망어업으로 인한 부수어획은 일부는 이용되고 대부분은 해상에 투기되면서 자원 손실의 위험성이 있 다(Slavin, 1982; Alverson et al., 1994). 우리나라의 새우 조망어업은 새우를 주로 포획해야하는 어업이지만, 많 은 양의 부수어획이 발생하고 있다. 부수어획된 해양생 물 중 소형개체이거나 경제적 가치가 없는 종일 경우 다시 바다로 투기된 후 연안 먹이망을 교란시켜 생태계 에 영향을 줄 수 있어, 부수어획물의 지속적인 모니터링 이 필요하다.
따라서 이번 연구는 사천 해역 새우조망어업에서 어 획된 어류를 대상으로 부수어획물의 실태를 파악하기 위해 월별 새우 어획량과 부수어획량을 비교해보고 부 수 어획된 1)어류의 종조성, 2)주요종의 체장조성, 3)월 별 유사도 분석을 통해 성육장으로서의 역할을 파악하 고 연안어업의 수산자원 관리정책에 기여할 수 있는 기 초자료를 제공하는데 그 목적이 있다.
재료 및 방법
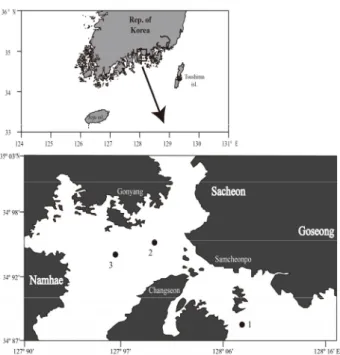
본 연구는 사천해역에서 어획되는 부수어획물 중 어 류의 종조성을 파악하기 위하여 새우조망어업의 조업구 역 내에서 3개 정점을 선정하여 2015년 3월부터 2016년 2월까지 매월 1회 60분씩 예망하여 채집하였다(Fig. 1).
3개 정점의 평균 수심은 19 m이었다. 조사에 사용된 새 우조망어구의 규격은 전체 길이 18 m, 빔 길이 5.2 m이 었으며, 날개 그물과 몸통 그물의 그물코 크기는 23 mm 였고, 끝자루 그물은 8 mm이었다.
환경자료(수온, 염분)는 CTD (Conductivity-Temperature- Depth, Seabird co., SBE-19)를 이용하여 각 1회씩 측정 하였다. 채집된 시료는 현장에서 cooler에 빙장보관 후 실험실로 운반 후 동정하였으며, 체장과 체중은 각각 1 mm와 0.1 g 까지 측정하였다. 종 동정은 Okiyama (1988), Kim and Han (1990), Kim et al. (1993), Lee and Go (2003) 등을 이용하였고, 분류체계 및 학명은 Kim et al. (2005)을 따랐다.
월별 종다양성지수 및 어류의 종조성 변화는 어획된 개체수와 중량을 소해면적으로 나누어 단위면적당 어획 개체수(inds./km2)와 어획중량(kg/km2)을 이용하여 계산 하였다. 종다양성지수(H′)는 Shannon and Weaver (1949)의 방법을 이용하여 계산하였다.
′
ln전체종수군집내의전개체수 종의개체수
정점별, 월별 어류 군집간의 유사성은 조사기간 동안 채집된 어류의 총 출현 개체수 중 1% 이상의 출현빈도를 나타낸 우점 출현종에 대한 개체수 자료를 로그 변환하 여 similarity matrix 후 Bray-Curtis 유사도지수를 사용하 였으며(Bray and curtis, 1957; Somerfield, 2008) 분리된 군집간의 유의도를 알아보기 위하여 ANOSIM test를 실 시하였다. 구해진 유사도는 group-average 방법을 이용 하여 집괴분석(cluster analysis)을 실시한 뒤, 수상도 (dendrogram)로 나타냈다. 또한 월별로 분리된 그룹간의 공간적 분포 특성은 다차원척도분석(nMDS)을 실시하여 2차원 공간에서 군집구조 차이를 파악하였다. 그리고 군 집분석 결과 분리된 생물군집에 영향을 미치는 종을 분 석하고 기여율을 파악하기 위해 SIMPER 분석을 실시하 였으며, 이러한 모든 분석은 Primer v6 statistical package (Clarke and Gorley, 2006)를 이용하였다.
결 과
사천해역의 월별 환경변화를 살펴보기 위하여 표․저
층 수온과 염분을 측정한 결과(Fig. 2), 표층수온은 8월 에 가장 높았고 2월에 가장 낮았다(표층: 24.1℃; 저층:
6.8℃). 저층 수온도 표층과 유사하게 8월에 가장 높았으 며, 2월에 가장 낮게 나타났다(표층: 23.7℃; 저층: 6.
8℃). 표층 염분은 12월에 가장 높았고 7월에 가장 낮았 다(표층: 35.1 psu; 저층: 30.9 psu). 저층 염분도 12월에 35.1 psu로 가장 높았으며, 7월에 가장 낮았다(표층:
35.1 psu; 저층: 31.3psu). 표층과 저층의 염분 차이는 5월에 0.6 psu로 가장 크게 나타났고, 10월까지 근소한 차이가 있었으나, 11~2월에는 차이가 거의 나타나지 않 았다.
전체 어획량을 새우류, 어류, 기타 갑각류와 두족류로 구분하여 월별 어획비율을 나타냈다(Fig. 3). 새우류는 2015년 3월에 50.9%로 어획비율이 가장 높게 나타났으 나, 4월에 32.4%로 낮아지기 시작하였고, 8월에 12.6%
의 비율을 제외하고 2016년 2월까지 10% 내의 어획비율 을 나타냈다. 어류의 어획비율은 9월에 19.5%로 가장 낮 은 비율을 나타냈으나, 매월 20% 이상의 어획비율을 나 타냈고, 5월에는 72.2%로 가장 높은 어획비율을 나타냈 다. 기타갑각류와 두족류의 어획비율은 매월 20% 이상의 어획비율을 나타냈으며, 3월에 20.6%로 가장 낮았고 9월
에 77.6%로 가장 높은 어획비율을 나타냈다.
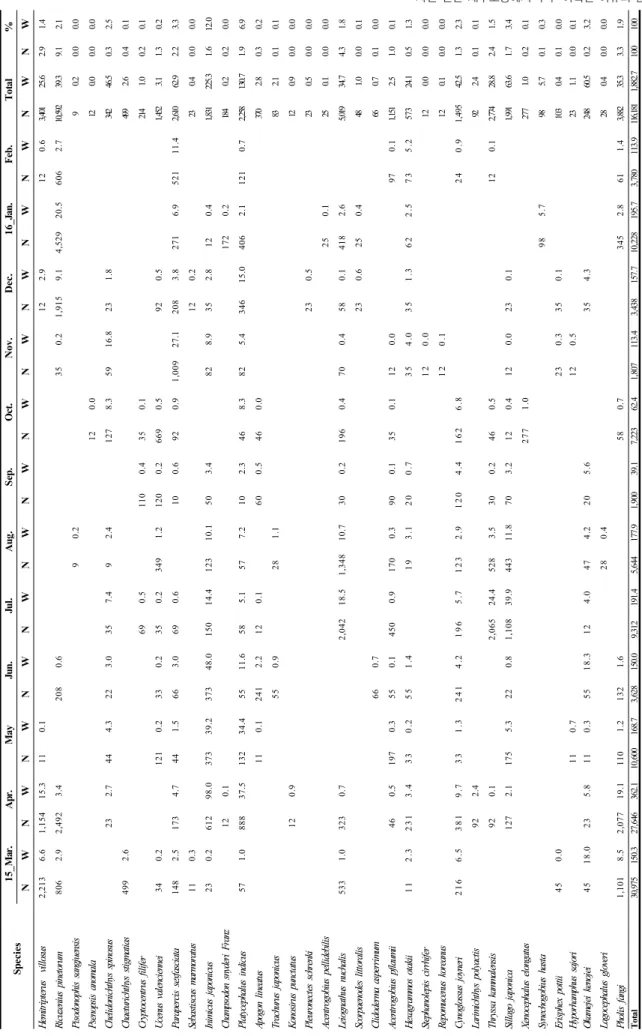
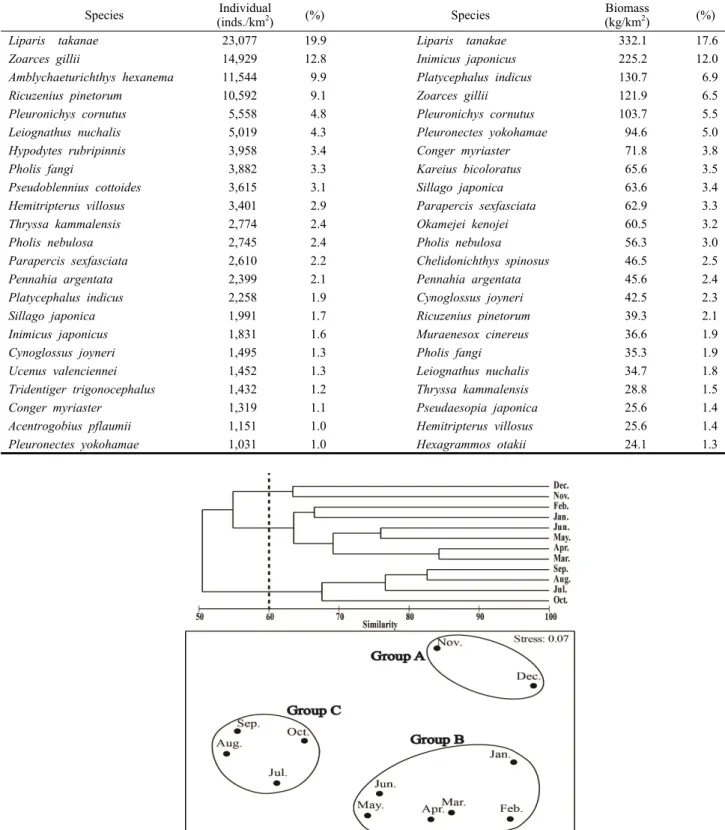
사천 해역에서 어획된 총 어획물 중 어류는 총 73종이었 고, 총개체수와 총중량은 각각 116,181 inds./km2, 1,882 kg/km2이었다(Table 1). 개체수의 경우, 꼼치(Liparis tanakae)가 23,077 inds./km2로 전체의 19.9%를 차지하여 가장 우점하였고, 그 다음으로 등가시치(Zoarces gillii)가 14,929 inds./km2로 전체의 12.8%를 차지하여 차우점하 였다. 그리고 도화망둑(Amblychaeturichthys hexanema), 상어횟대(Ricuzenius pinetorum), 도다리(Pleuronichys cornutus) 순으로 우점하였으며, 상위 5종이 전체 개체 수의 56.5%를 차지하였다. 생체량의 경우에도 꼼치가 332.1 kg/km2으로 전체의 17.6%를 차지하여 가장 높았
Fig. 3. Monthly variation of catch ratio from Mar. 2015 to Feb. 2016.
Fig. 1. Location of sampling sites in the fishing area in coastal Sacheon from Mar. 2015 to Feb. 2016.
Fig. 2. Monthly variation in water temperature (A) and salinity (B) in the coastal Sacheon from Mar. 2015 to Feb. 2016.
층 수온과 염분을 측정한 결과(Fig. 2), 표층수온은 8월 에 가장 높았고 2월에 가장 낮았다(표층: 24.1℃; 저층:
6.8℃). 저층 수온도 표층과 유사하게 8월에 가장 높았으 며, 2월에 가장 낮게 나타났다(표층: 23.7℃; 저층: 6.
8℃). 표층 염분은 12월에 가장 높았고 7월에 가장 낮았 다(표층: 35.1 psu; 저층: 30.9 psu). 저층 염분도 12월에 35.1 psu로 가장 높았으며, 7월에 가장 낮았다(표층:
35.1 psu; 저층: 31.3psu). 표층과 저층의 염분 차이는 5월에 0.6 psu로 가장 크게 나타났고, 10월까지 근소한 차이가 있었으나, 11~2월에는 차이가 거의 나타나지 않 았다.
전체 어획량을 새우류, 어류, 기타 갑각류와 두족류로 구분하여 월별 어획비율을 나타냈다(Fig. 3). 새우류는 2015년 3월에 50.9%로 어획비율이 가장 높게 나타났으 나, 4월에 32.4%로 낮아지기 시작하였고, 8월에 12.6%
의 비율을 제외하고 2016년 2월까지 10% 내의 어획비율 을 나타냈다. 어류의 어획비율은 9월에 19.5%로 가장 낮 은 비율을 나타냈으나, 매월 20% 이상의 어획비율을 나 타냈고, 5월에는 72.2%로 가장 높은 어획비율을 나타냈 다. 기타갑각류와 두족류의 어획비율은 매월 20% 이상의 어획비율을 나타냈으며, 3월에 20.6%로 가장 낮았고 9월
에 77.6%로 가장 높은 어획비율을 나타냈다.
사천 해역에서 어획된 총 어획물 중 어류는 총 73종이었 고, 총개체수와 총중량은 각각 116,181 inds./km2, 1,882 kg/km2이었다(Table 1). 개체수의 경우, 꼼치(Liparis tanakae)가 23,077 inds./km2로 전체의 19.9%를 차지하여 가장 우점하였고, 그 다음으로 등가시치(Zoarces gillii)가 14,929 inds./km2로 전체의 12.8%를 차지하여 차우점하 였다. 그리고 도화망둑(Amblychaeturichthys hexanema), 상어횟대(Ricuzenius pinetorum), 도다리(Pleuronichys cornutus) 순으로 우점하였으며, 상위 5종이 전체 개체 수의 56.5%를 차지하였다. 생체량의 경우에도 꼼치가 332.1 kg/km2으로 전체의 17.6%를 차지하여 가장 높았
Fig. 3. Monthly variation of catch ratio from Mar. 2015 to Feb. 2016.
Fig. 1. Location of sampling sites in the fishing area in coastal Sacheon from Mar. 2015 to Feb. 2016.
Fig. 2. Monthly variation in water temperature (A) and salinity (B) in the coastal Sacheon from Mar. 2015 to Feb. 2016.
으며, 그 다음으로 쑤기미(Inimicus japonicus), 양태 (Platycephalus indicus), 등가시치, 도다리, 문치가자미 (Pleuronectes yokohamae) 등 상위 6개 어종이 전체의 53.6%를 차지하였다. 출현빈도를 보면 양태가 전 조사 기간 동안 출현하여 12회, 문치가자미와 쌍동가리 (Parapercis sexfasciata)가 11회, 도화망둑, 등가시치, 붕 장어(Conger myriaster), 쑤기미, 쥐노래미(Hexagrammos otakii)가 10회 출현하였고 나머지 종들은 10회 미만의 출현빈도를 보였다.
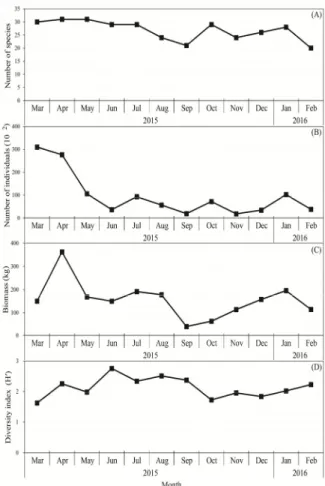
월별 출현종수는 20~31종의 범위를 보였으며, 2월에 20종으로 가장 적은 출현종수를 나타냈으며, 4월과 5월 에 31종으로 가장 많은 출현종수를 나타냈다(Fig. 4). 월 별 출현 개체수는 3월에 30,975 inds./km2으로 가장 높았 으며, 9월에 1,900 inds./km2으로 가장 낮았다. 월별 생체 량은 4월에 362.1 kg/km2를 차지하여 가장 높은 생체량을
나타내었고 9월에 39.1 kg/km2로 가장 낮은 생체량을 나 타냈다. 다양도지수는 3월에 6월까지 증가 추세에 있다가 이후 10월까지 하락하였고, 다시 2월까지 증가했다.
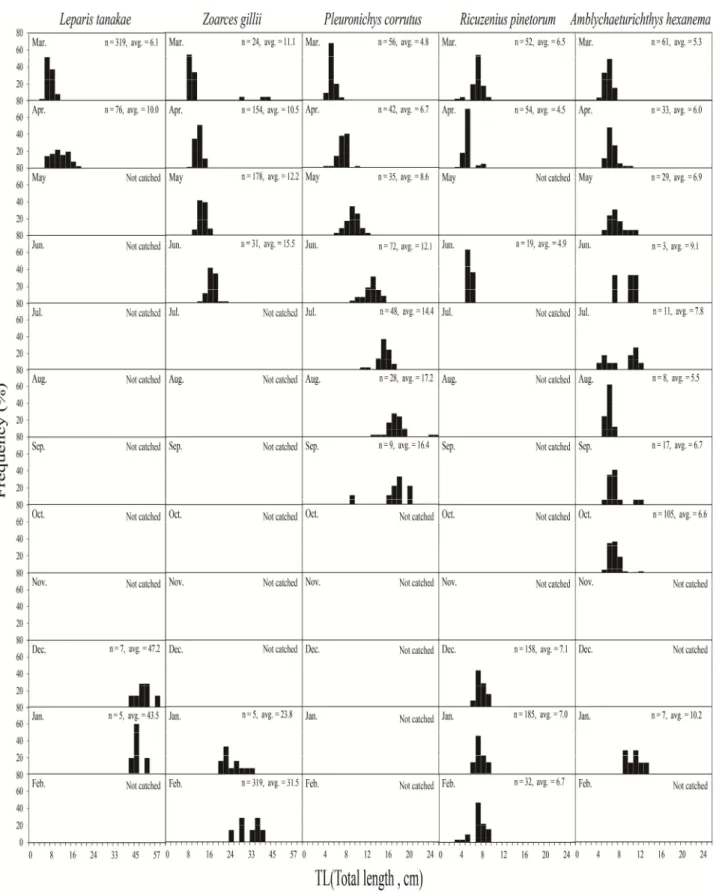
가장 많은 개체수를 나타낸 5개 어종을 대상으로 월 별 체장분포를 나타내보았다(Fig. 5). 꼼치(Liparis tanakae)는 3월, 4월과 12월, 1월에 출현하였으며, 평균 전장은 6.1~47.2 cm의 범위를 보였다. 3월에 평균 6.1 cm, 4월에 10.0 cm로 성장하다가 12월에 47.2 cm, 1월 에 43.5cm로 봄철에 비해 겨울철에 큰 개체가 출현하 였다. 등가시치(Zoarces gillii)는 3~6월과 1월, 2월에 출현하였고 평균전장은 10.5~31.5 cm 범위를 보였으 며, 3월에 11.1 cm에서 6월까지 15.5 cm으로 전장이 증가하는 양상을 보였다. 이후 5월부터 12월까지 출현 하지 않았고 1월에 23.8 cm, 2월에 31.5 cm의 큰 개체 가 출현했다. 도다리(Pleuronichys cornutus)는 3~9월까 지 출현하였고, 평균 체장범위는 4.8~17.2 cm를 보였다.
꼼치, 등가시치와 유사하게 3월에 4.8 cm의 유어들이 출 현하기 시작하였고 9월에 16.4 cm까지 성장한 개체들이 출현하였다.
상어횟대(Ricuzenius pinetorum)는 3월, 4월, 6월, 12월 과 2월에 출현하였으며, 평균 체장은 4.5~7.1 cm의 범위 를 보였다. 도화망둑(Amblychaeturichthys hexanema)은 10월, 11월, 2월을 제외한 모든 달에 출현하였으며, 평균 체장은 5.3~10.2 cm의 범위를 보였다. 상어횟대, 도화망 둑은 꼼치, 등가시치, 도다리처럼 체장이 지속적으로 성 장하고 있는 경향을 보이지 않고 매월 비슷한 체장분포 를 나타내고 있었다.
어류 군집에 영향을 줄 수 있는 출현 개체수 비율이 1.0% 이상인 22종을 이용하여 월별 어류의 유사성을 확인하였다(Table 2).
월별 군집은 60% 유사도수준에서 3개의 그룹으로 구 분할 수 있었다(Fig. 6). 그룹 A는 11월, 12월, 그룹 B는 1월, 2월, 3월, 4월, 5월, 6월, 그룹 C는 7월, 8월, 9월, 10월로 구분되었다. 집괴분석에 대한 다차원척도분석을 적용한 결과도 앞에서 제시한 집괴분석의 결과와 같이 3개의 그룹으로 구분되고 있었다.
one-way ANOSIM분석을 통해 집괴분석으로부터 나 누어진 그룹간의 군집의 유의한 차이를 확인한 결과, 그룹 A, 그룹 B, 그룹 C간 차이(global R=0.901, p=0.001)는 99% 신뢰수준에서 유의하였다.
Fig. 4. Monthly variation in number of species (A), number of individuals (B), biomass (C) and diversity index (D) of fishes in the coastal Sacheon from Mar. 2015 to Feb. 2016.
Species15_Mar.Apr.MayJun.Jul.Aug.Sep.Oct.Nov.Dec.16_Jan.Feb.Total % NWNWNWNWNWNWNWNWNWNWNWNWNWNW Pseudoblennius cottoides2,379 3.1 1,200 2.1 120.0 250.2 3,615 5.4 3.1 0.3 Pleuronectidae spp.11 0.5 11 0.5 0.0 0.0 Pseudaesopia japonica91 3.5 1507.7 22 1.9 1106.4 12 0.2 94 2.9 12 0.4 48 2.6 53825.6 0.5 1.4 Acanthopagrus schlegelii11 0.7 11 0.7 0.0 0.0 Oglossus robustus22 0.7 23 0.5 9 0.1 10 0.1 12 0.0 49 0.9 125 2.2 0.1 0.1 Taenioides rubicundus11 0.2 11 0.2 0.0 0.0 Muraenesox cinereus46 9.5 16020.5 30 3.4 23 3.3 25936.6 0.2 1.9 Rudarius ercodes12 0.1 49 0.1 61 0.2 0.1 0.0 Cociella crocodila44 0.6 11 0.5 23 1.2 94 2.7 23 3.0 23 2.2 12 0.1 37 0.9 26711.3 0.2 0.6 Liparis tanakae18,54049.2 4,29263.4 440.7112.123 25.2 81 98.9 62 73.0 24 19.5 23,077332.1 19.917.6 Favonigobius gymnauchen12 0.0 12 0.0 0.0 0.0 Zebrias fasciatus25 0.2 25 0.2 0.0 0.0 Upeneus japonicus50 0.8 23 0.5 73 1.3 0.1 0.1 Pleuronichys cornutus1,1011.62,1357.63843.2789 22.3 565 30.8 452 29.2 1206.9122.15,558103.7 4.85.5 Amblychaeturichthys hexanema3,5514.12,4465.2 318 0.8 330.2 127 0.4 188 0.1 680 1.3 4,0042.1172 1.1 240.111,54415.6 9.90.8 Kareius bicoloratus23 6.9 23 4.6 12 15.0 126.1 126.6 37 11.3 24 15.0 14265.6 0.1 3.5 Oplegnathus fasciatus12 2.1 12 2.1 0.0 0.1 Tridentiger trigonocephalus374 1.0 460.1 110.1 307 1.1 415 0.7 120.0 267 0.9 1,4323.9 1.2 0.2 Zoarces gillii6699.39,15044.8 4,40733.9 3406.9 23 0.2 12 0.4 12 0.2 23 1.3 17211.3 12113.6 14,929121.9 12.86.5 Engraulis japonicus57 0.3 57 0.3 0.0 0.0 Acanthogobius flavimanus45 1.0 23 1.0 25 0.1 93 2.1 0.1 0.1 Pleuronectes yokohamae9112.8 9213.7 23013.6 1533.7 81 1.0 75 3.6 30 2.7 12 0.6 35 2.3 7413.5 15827.3 1,03194.6 1.0 5.0 Eopsetta grigorjewi44 0.8 44 0.8 0.0 0.0 Hypodytes rubripinnis454 1.2 138 0.4 440.1 1380.9 2,129 11.9 1,0543.3 3,958 17.8 3.4 0.9 Johnius grypotus2082.0 88 1.0 11 0.4 23 1.0 38 0.6 367 5.1 0.3 0.3 Sagamia geneionema12 0.1 12 0.1 0.0 0.0 Cynoglossus semilaevis11 0.8 11 0.8 0.0 0.0 Setipinna tenuifilis136 1.2 12 0.0 148 1.3 0.1 0.1 Sardinella zunasi12 0.1 12 0.1 0.0 0.0 Pholis nebulosa79 2.9 58 2.6 1,17316.7 11 0.4 69 2.0 23 0.5 2195.2 60317.8 5098.2 2,74556.3 2.4 3.0 Pseudorhombus cinnamoneus69 0.2 69 0.2 0.1 0.0 Pennahia argentata11 0.4 11 0.3 92 3.9 79231.2 2100.8 1,0624.6 2224.4 2,39945.6 2.1 2.4 Takifugu niphobles12 0.3 23 0.2 86 2.2 121 2.7 0.1 0.1 Sebastes inermis12 0.6 47 1.9 49 1.1 12 0.4 120 3.9 0.1 0.2 Conger myriaster34 2.1 46 2.2 88 2.2 1107.6 34617.5 49930.5 30 1.5 58 2.6 59 4.1 49 1.6 1,31971.8 1.1 3.8 Istigobius hoshinonis22 0.0 22 0.0 0.0 0.0 Ctenotrypauchen microcephalus23 0.3 92 0.8 12 0.1 127 1.2 0.1 0.1
Table 1. Monthly species composition of fishes in the coastal Sacheon from Mar. 2015 to Feb. 2016 (N: inds./km2 , W: kg/km2 )
Species15_Mar.Apr.MayJun.Jul.Aug.Sep.Oct.Nov.Dec.16_Jan.Feb.Total % NWNWNWNWNWNWNWNWNWNWNWNWNWNW Hemitripterus villosus2,213 6.6 1,15415.3 110.1 12 2.9 12 0.6 3,401 25.6 2.9 1.4 Ricuzenius pinetorum8062.9 2,492 3.4 2080.6 350.2 1,915 9.1 4,52920.5 6062.7 10,592 39.39.12.1 Pisodonophis sangjuensis9 0.2 9 0.2 0.0 0.0 Psenopsis anomala12 0.0 12 0.0 0.0 0.0 Chelidonichthys spinosus23 2.7 44 4.3 22 3.0 35 7.4 9 2.4 127 8.3 59 16.8 23 1.8 342 46.5 0.3 2.5 Chaeturichthys stigmatias499 2.6 499 2.6 0.4 0.1 Cryptocentrus filifer69 0.5 110 0.4 35 0.1 214 1.0 0.2 0.1 Ucenus valenciennei340.2 121 0.2 330.2 350.2 349 1.2 120 0.2 669 0.5 920.5 1,4523.11.30.2 Parapercis sexfasciata1482.5 1734.7 44 1.5 66 3.0 69 0.6 10 0.6 92 0.9 1,00927.1 2083.8 2716.9 52111.4 2,61062.92.23.3 Sebastiscus marmoratus11 0.3 12 0.2 23 0.4 0.0 0.0 Inimicus japonicus230.2 612 98.0 373 39.2 373 48.0 150 14.4 123 10.1 503.4 828.9 352.8 120.4 1,831225.31.612.0 Champsodon snyderi Franz12 0.1 172 0.2 184 0.2 0.2 0.0 Platycephalus indicus57 1.0 88837.5 13234.4 5511.6 58 5.1 57 7.2 10 2.3 46 8.3 82 5.4 34615.0 4062.1 1210.7 2,258130.71.96.9 Apogon lineatus11 0.1 241 2.2 12 0.1 60 0.5 46 0.0 370 2.8 0.3 0.2 Trachurus japonicus55 0.9 28 1.1 83 2.1 0.1 0.1 Konosirus punctatus12 0.9 12 0.9 0.0 0.0 Pleuronectes schrenki23 0.5 23 0.5 0.0 0.0 Acentrogobius pellidebilis25 0.1 25 0.1 0.0 0.0 Leiognathus nuchalis533 1.0 323 0.7 2,04218.5 1,34810.7 300.2 196 0.4 700.4 580.1 418 2.6 5,01934.74.31.8 Scorpaenodes littoralis23 0.6 25 0.4 48 1.0 0.0 0.1 Clidoderma asperrimum66 0.7 66 0.7 0.1 0.0 Acentrogobius pflaumii46 0.5 197 0.3 55 0.1 450 0.9 170 0.3 90 0.1 35 0.1 12 0.0 97 0.1 1,151 2.5 1.0 0.1 Hexagrammos otakii11 2.3 231 3.4 33 0.2 55 1.4 19 3.1 20 0.7 35 4.0 35 1.3 62 2.5 73 5.2 573 24.1 0.5 1.3 Stephanolepis cirrhifer12 0.0 12 0.0 0.0 0.0 Repomucenus koreanus12 0.1 12 0.1 0.0 0.0 Cynoglossus joyneri216 6.5 381 9.7 33 1.3 241 4.2 196 5.7 123 2.9 120 4.4 162 6.8 24 0.9 1,495 42.5 1.3 2.3 Larimichthys polyactis92 2.4 92 2.4 0.1 0.1 Thryssa kammalensis92 0.1 2,06524.4 5283.5 30 0.2 46 0.5 12 0.1 2,77428.82.41.5 Sillago japonica1272.1 1755.3 22 0.8 1,10839.9 44311.8 70 3.2 12 0.4 12 0.0 23 0.1 1,99163.61.73.4 Xenocephalus elongatus277 1.0 277 1.0 0.2 0.1 Synechogobius hasta98 5.7 98 5.7 0.1 0.3 Erisphex pottii45 0.0 23 0.3 35 0.1 103 0.4 0.1 0.0 Hyporhamphus sajori11 0.7 12 0.5 23 1.1 0.0 0.1 Okamejei kenojei45 18.0 23 5.8 11 0.3 55 18.3 12 4.0 47 4.2 20 5.6 35 4.3 248 60.5 0.2 3.2 Lagocephalus gloveri28 0.4 28 0.4 0.0 0.0 Pholis fangi1,1018.5 2,07719.1 110 1.2 132 1.6 580.7 345 2.8 611.4 3,88235.33.31.9 Total30,975150.3 27,646362.1 10,600168.7 3,628 150.0 9,312 191.4 5,644 177.9 1,90039.1 7,22362.4 1,807 113.4 3,438 157.7 10,228195.7 3,780 113.9 116,181 1,882.7100 100
Table 1. continue
Fig. 5. Length frequency distribution of the 5 major species collected in the coastal Sacheon from Mar. 2015 to Feb. 2016.
Fig. 5. Length frequency distribution of the 5 major species collected in the coastal Sacheon from Mar. 2015 to Feb. 2016.
Species Individual
(inds./km2) (%) Species Biomass
(kg/km2) (%)
Liparis takanae 23,077 19.9 Liparis tanakae 332.1 17.6
Zoarces gillii 14,929 12.8 Inimicus japonicus 225.2 12.0
Amblychaeturichthys hexanema 11,544 9.9 Platycephalus indicus 130.7 6.9
Ricuzenius pinetorum 10,592 9.1 Zoarces gillii 121.9 6.5
Pleuronichys cornutus 5,558 4.8 Pleuronichys cornutus 103.7 5.5
Leiognathus nuchalis 5,019 4.3 Pleuronectes yokohamae 94.6 5.0
Hypodytes rubripinnis 3,958 3.4 Conger myriaster 71.8 3.8
Pholis fangi 3,882 3.3 Kareius bicoloratus 65.6 3.5
Pseudoblennius cottoides 3,615 3.1 Sillago japonica 63.6 3.4
Hemitripterus villosus 3,401 2.9 Parapercis sexfasciata 62.9 3.3
Thryssa kammalensis 2,774 2.4 Okamejei kenojei 60.5 3.2
Pholis nebulosa 2,745 2.4 Pholis nebulosa 56.3 3.0
Parapercis sexfasciata 2,610 2.2 Chelidonichthys spinosus 46.5 2.5
Pennahia argentata 2,399 2.1 Pennahia argentata 45.6 2.4
Platycephalus indicus 2,258 1.9 Cynoglossus joyneri 42.5 2.3
Sillago japonica 1,991 1.7 Ricuzenius pinetorum 39.3 2.1
Inimicus japonicus 1,831 1.6 Muraenesox cinereus 36.6 1.9
Cynoglossus joyneri 1,495 1.3 Pholis fangi 35.3 1.9
Ucenus valenciennei 1,452 1.3 Leiognathus nuchalis 34.7 1.8
Tridentiger trigonocephalus 1,432 1.2 Thryssa kammalensis 28.8 1.5
Conger myriaster 1,319 1.1 Pseudaesopia japonica 25.6 1.4
Acentrogobius pflaumii 1,151 1.0 Hemitripterus villosus 25.6 1.4
Pleuronectes yokohamae 1,031 1.0 Hexagrammos otakii 24.1 1.3
Table 2. Dominant species based on the individual and biomass of fishes in the coastal Sacheon from Mar. 2015 to Feb. 2016 (inds./km2, kg/km2)
Fig. 6. A dendrogram (up) and nMDS plot (down) based on Bray-curtis simility matrix of log(x+1) transformed data of each month illustrating the classification.
Group Month Species Average abundance (inds./km2)
Contribution
(%) Cumulative (%)
A November December
Parapercis sexfasciata 6.13 16.44 16.44
Platycephalus indicus 5.13 13.60 30.04
Leiognathus nuchalis 4.17 12.55 42.59
Ricuzenius pinetorum 5.57 11.03 53.62
Inimicus japonicus 4.00 11.03 64.65
Liparis tanakae 3.79 9.78 74.43
B
January February
March April
MayJune
Zoarces gillii 6.63 8.97 8.97
Pholis fangi 5.70 7.85 16.82
Pleuronectes yokohamae 4.82 7.47 24.29
Parapercis sexfasciata 5.01 7.29 31.58
Platycephalus indicus 5.10 7.24 38.82
Amblychaeturichthys hexanema 5.61 6.89 45.71
Ricuzenius pinetorum 5.78 6.79 52.50
Pholis nebulosa 5.11 6.65 59.15
Liparis tanakae 5.31 5.66 64.81
Hypodytes rubripinnis 4.91 5.29 70.10
C
AugustJuly September
October
Amblychaeturichthys hexanema 6.23 9.89 9.89
Pennahia argentata 5.88 9.69 19.58
Cynoglossus joyneri 5.00 9.04 28.62
Leiognathus nuchalis 5.89 8.53 37.14
Ucenus valenciennei 5.19 8.24 45.38
Acentrogobius pflaumii 4.84 7.72 53.10
Conger myriaster 4.89 7.44 60.54
Thryssa kammalensis 5.30 7.43 67.97
Sillago japonica 4.98 6.86 74.83
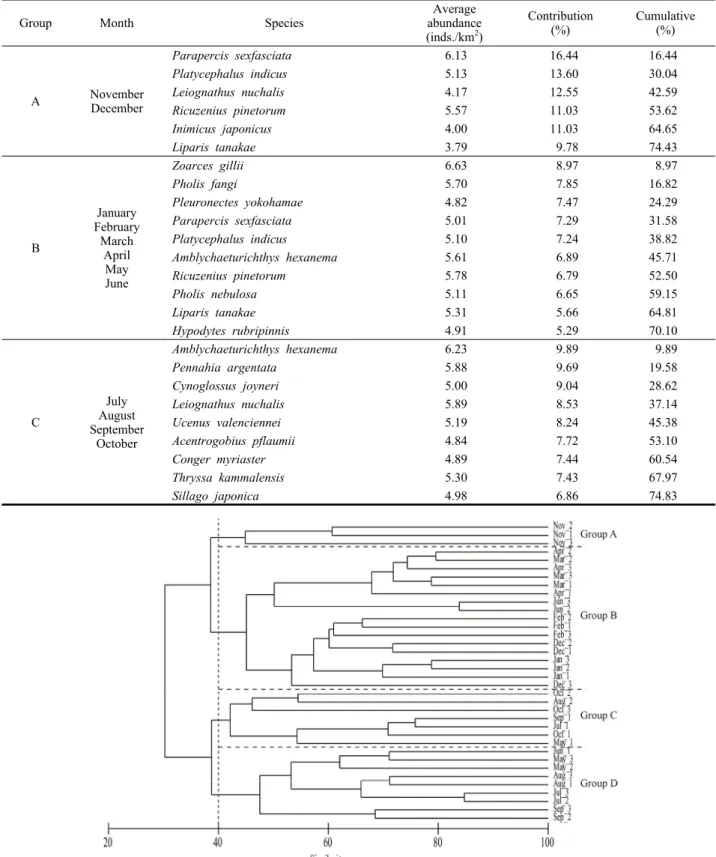
Table 3. Species contribution (%) to similarity resulting from SIMPER among group A, group B and group C divided cluster analysis
Fig. 7. A dendrogram based on Bray-curtis similarity matrix of log(x+1) transformed data of each month and station illustrating the classification.