* 1 Received on September 10, 2012; accepted on March 22, 2013
* 2 Division of Environmental Forest Science, Gyeongsang National University, Institute of Agriculture & Life Sciences, Jinju 660-701, South Korea
†
Corresponding author : Jae-Kyung Yang (e mail: [email protected])
Optimization of Concentrated Acid Hydrolysis of Waste Paper Using Response Surface Methodology* 1
Ji Young Jung *
2, Myung Suk Choi *
2, and Jae Kyung Yang *
2†ABSTRACT
Waste paper stands for the major biodegradable organic fraction of most of municipal solid waste. The potential of waste paper for glucose production was investigated in this current work. The pretreatment was accomplished by first subjecting waste paper to disintegration time (30 s), followed by ink removal of disintegrated waste paper using an deinking agent. Concentrated acid hydrolysis of waste paper with sulfuric acid was optimized to maximize glucose conversion. The concentrated acid hydrolysis conditions for waste paper (disintegrated time: 30 s, deinking agent loading : 15 ㎖) were optimized by using central composite design and response surface methodology. The optimization process employed a central composite design, where the investigated variables were acid concentration (60∼80%), loading sulfuric acid (1∼5 ㎖) and reaction time (1∼5 h). All the tested variables were identified to have significant effects (p < 0.05) on glucose conversion. The optimum concentrated acid hydrolysis conditions were acid concentration of 70.8%, loading sulfuric acid of 3.2 ㎖ and a reaction time of 3.6 h. This research of concentrated acid hydrolysis was a promising method to improve glucose conversion for waste paper.
Keywords : waste paper, pretreatment, acid hydrolysis, central composite design,response surface methodology
1. INTRODUCTION
In recent years, efforts have increased to- wards a more efficient utilization of renewable municipal solid waste including waste paper (Holtzapple et al., 1992; Lay et al., 1999, Li et al., 2007; Li et al., 2012). Waste paper was usually recycled into low-grade paper products, such as newsprint, paper towels, toilet paper, and cardboard (Park et al., 2004). The shorten-
ing of cellulose fibers with repeated reutilization
tends to decrease the quality of the paper pro-
ducts (Deng et al., 2010). Because of this phe-
nomenon, the upper limit of waste paper-
to-paper recycling is said to be 65%. This means
that the rest of the paper must be disposed of
by incineration or landfill. However, because of
environmental restrictions, lack of suitable new
sites, and concerns about the greenhouse effect, incineration or disposal by landfill may become practically impossible in the near future. Find- ing new uses for recycled paper is a pressing demand. Among paper, perhaps the most limit- ed in its use is computer printout, which is so superabundant in the business districts of civil- ized countries (Xiao & Clarkson, 1997). Generally, waste computer printout is shredded before dis- posal, in order to keep office matters confident- ial; this practice has the unintended consequence of shortening the constituent cellulose fibers beyond utilization (Clarkson & Xiao, 2000; Teg- hammar et al., 2010). As a consequence, in- cineration is the usual fate of such materials.
However, recent studies have explored other in- dustrial routes. A better way to utilize waste paper would be to converted into bioethanol.
Providing that the carbohydrate content of the waste paper is high, it could be converted into bioethanol.
Cellulose, a major building block of waste paper, can be converted enzymatically to reduc- ing sugars including glucose; one use of glucose is fermentation into ethanol. Also, paper sludge after deinking has been traditionally disposed of by burning or landfilling, but could be used as an organic amendment in agricultural soils and filler of erosion control (Chantigny et al., 1999).
Basically, the recycling of waste paper can be done by reusing waste paper after pulping them by a machine called pulper and followed by re- moval of printing ink, a treatment specifically called ‘deinking’ (Holtzapple et al., 1992).
In order to break down holocellulose for con- version of waste paper to glucose, the cellulose and hemicellulose must be broken down to cor- responding monomers (sugars). The hydrolysis step may be carried out either enzymatically or by acid treatment (Romero et al., 2010). Enzy- matic hydrolysis is conducted at mild conditions but requires a pretreatment of the raw material
to improve the enzymatic digestibility (Sun and Cheng, 2005) and longer retention time (Ingram et al., 1999). Moreover, the production and re- covery of enzymes may affect this option from an economic point of view (Iranmahboob et al., 2002). Acid hydrolysis may be carried out either at diluted or concentrated acid conditions. Di- luted acid hydrolysis attacks polysaccharides, especially those from the hemicellulose fraction which is easier to hydrolyze than cellulose. In addition, no acid recovery steps are required and acid losses are not important. On the nega- tive side, the yield of glucose from cellulose is low. Concentrated acid hydrolysis enables high ethanol yield because of almost quantitative con- version of cellulose into glucose, although acid recovery is required as well as more resistant reactors.
Acid hydrolysis needs the optimization of process parameters, including concentration of sulfuric acid, reaction time, and reaction tem- perature, loading substrate for efficient hydroly- sis. Ritter et al. (Ritter et al., 1945) showed that the yield of lignin from wood treated with 72%
sulfuric acid for 1 hr. showed a nearly constant low value when the temperature was varied from 15 to 30°C. These same workers reported that with a 2 hr. treatment with 72% sulfuric acid, results showed a maximum yield of reducing sugars at 35°C. For these reasons it was con- sidered well to begin experiment on sacchari- fication of cellulose using a temperature of 30°C.
Sulphuric acid is the most commonly used in
lignocellulosic residues hydrolysis (Baudel et al.,
2005; Larsson et al., 1999) although other mi-
neral acids like hydrochloric acid (Lavarack et
al., 2002), nitric acid (Rodríguez-Chong et al.,
2004) or phosphoric acid (Romero et al., 2007)
have also been assayed. Acid hydrolysis residue
included inorganic compound such as ash and
lignin. These residue is used primarily as an
organic amendment rather than as fertilizers,
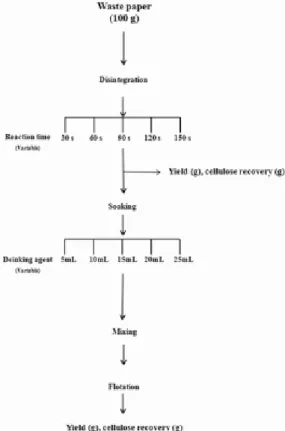
Fig. 1. Schematic of pretreatment procedure for waste paper.
because of mineral nutrient contents. The inor- ganic compound is affect on the soil improve- ment (Bolan & Duraisamy, 2003).
Optimization of hydrolysis conditions involves varying one factor at a time and keeping other variables constant (Mathew & Nair, 2006). On the other hand, response surface method can effecti- vely use variables simultaneously and determine optimum conditions required (Giovanni, 1983).
Response surface methodology is a statistical technique used to model and optimize multiple variables, and it can be used to determine the optimum conditions by combining experimental design with interpolation of first or second order polynomial equations in a sequential testing procedure. Central composite design (CCD) and response surface methodology (RSM) were used to design a systematic experimental method. CCD is well suited for fitting a quadratic surface which usually works well for process optimization.
RSM is able to map a response surface over a particular region of interest (Chun et al., 2011).
To our knowledge, there are no reports on combined concentrated acid hydrolysis and RSM of waste paper (Um et al., 2011; Rahman et al., 2007; Laopaiboon et al., 2010; Karimi et al., 2006; Sun et al., 2005).
In this research, RSM was applied to deter- mine the optimum concentrated acid hydrolysis conditions. Furthermore, the extent of glucose production was evaluated at the operating con- ditions determined by RSM analysis.
2. MATERIALS and METHODS 2.1. Raw Material
Three different types of waste paper were tested : newspaper, old corrugated containers, and computer printout. The waste papers were cut using a standard office shredder to rectangles 0.6 cm wide and 1.5 cm long, and were used for
pretreatment and concentrated acid hydrolysis (Park et al., 2002). The moisture content of waste paper (newspaper, old corrugated containers, and computer printout) were 3.8%, 6.3% and 5.4%, respectively.
2.2. Pretreatment of Waste Paper
Pretreatment was conducted in order to under- stand the effects of disintegration time and load- ing deinking agent on computer printout pre- treatment efficiency. The pretreatment procedure employed in this study is shown schematically in Fig. 1. To produce pretreated computer prin- tout, 100 g of shredded computer printout, 10%
NaOH (10 ㎖) and tap water (1450 ㎖) were
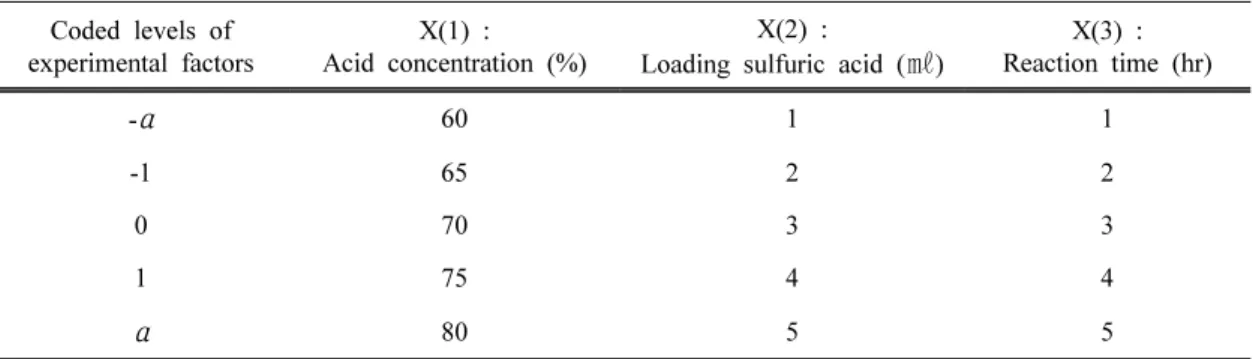
Table 1. Experimental design factors and corresponding values Coded levels of
experimental factors
X(1) : Acid concentration (%)
X(2) :
Loading sulfuric acid ( ㎖ )
X(3) : Reaction time (hr)
- α 60 1 1
-1 65 2 2
0 70 3 3
1 75 4 4
α 80 5 5
mixed in a pulp disintegrator (GF7-P61, Han- young Co. Ltd., KOREA). The disintegration time was then carried out for 30 s, 60 s, 90 s, 120 s and 150 s. After this, the disintegrated computer printout was incubated for 1 hr in a 60°C water bath. The amount of deinking agent required to achieve frothing, and hence deinking agent (nonionic surfactant) was 5 to 25 ㎖, which is normally added to commercial dein- king agent (provide by Ssangyong paper, Osan- si, Korea).
The disintegrated computer printout was di- luted in a 5,050 ㎖ flotation cell to a consis- tency of 1.5% and conditioned in the presence of the collector. The flotation was then carried out for 20 min. at a stirring speed of 1400 rpm.
Subsequently, the float (toner particles) and nonfloat (cellulose fibres) products were care- fully filtered, dried and stored for analysis of yield and cellulose recovery.
2.3. Concentrated Acid Hydrolysis of Waste Paper
2.3.1. Concentrated Acid Hydrolysis
Concentrated acid hydrolysis (Table 1) was performed according to the method originally described by Saeman et al. (1945). A first step (concentrated acid hydrolysis) with 60∼80%
(w/w) H
2SO
4at 30°C for 1∼5 hr. was used.
The media consisted of 300 mg pretreated com- puter printout/1∼5 ㎖ H
2SO
4liquor on dry basis. In a second step, the reaction mixture was diluted to 4% (w/w) H
2SO
4and autoclaved at 121°C for 1 hr. After reaction was completed, solids were separated from aqueous solution by filtration. The filtrate was analyzed for glucose.
2.3.2. Design of Experimental
The effect of three independent variables (acid
concentration, loading sulfuric acid and reaction
time) on the response (glucose conversion) was
studied using a factorial central composite design
(CCD) of response surface methodology (RSM),
which is a collection of mathematical and sta-
tistical techniques for designing experiments,
analysing the effects of variables, developing
models and optimising the process variables for
the optimum response (Ferreira et al., 2009). The
experimental data were fit using a low-order
polynomial equation to evaluate the effect of
each independent variable to the response, which
were later analysed to determine the optimum
process conditions. For fitting second-order
models, CCD was one of the most commonly
used RSM (Ferreira et al., 2009). CCD consists
of 2
kfactorial points, 2
kaxial points (± α), and
6 centre points, where k is the number of in-
dependent variables. Each of the variables were
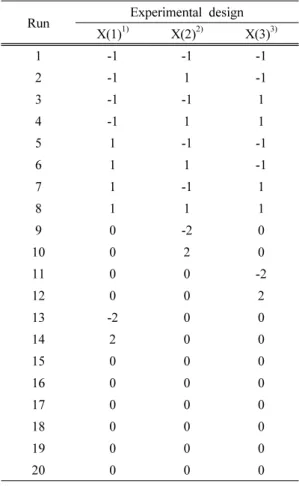
Table 2. Central composite experimental design of three variables at five levels for con- centrated acid hydrolysis of computer printout
Run Experimental design X(1)
1)X(2)
2)X(3)
3)1 -1 -1 -1
2 -1 1 -1
3 -1 -1 1
4 -1 1 1
5 1 -1 -1
6 1 1 -1
7 1 -1 1
8 1 1 1
9 0 -2 0
10 0 2 0
11 0 0 -2
12 0 0 2
13 -2 0 0
14 2 0 0
15 0 0 0
16 0 0 0
17 0 0 0
18 0 0 0
19 0 0 0
20 0 0 0
1)
Coded value of acid concentration (%).
2)
Coded value of loading sulfuric acid ( ㎖ ).
3)
Coded value of reaction time (hr).
investigated at five coded levels (- α, -1, 0, 1, α), as listed in Table 1, and the complete ex- perimental design matrix for this study was shown in Table 2. A total of twenty experi- ments, including eight for factorial design, six for axial points and six repetitions at the central point, were performed.
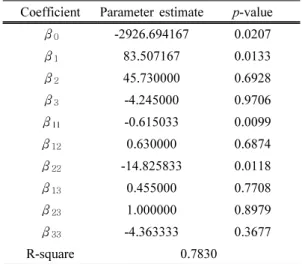
2.3.3. Statistical Analysis
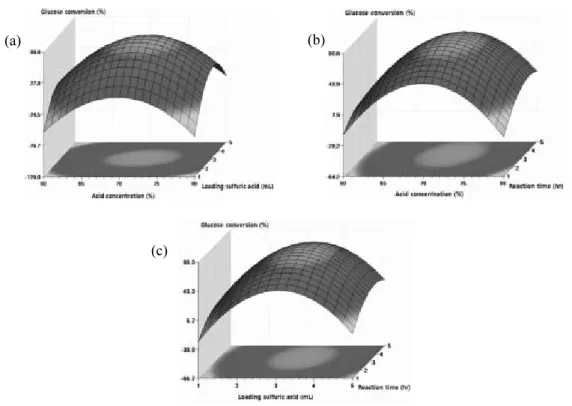
The CCD experimental results were analyzed using Design-Expert software version 6.0.6, from STAT-EASE, Inc., Minneapolis, USA. Each co- efficient in regression equation was calculated and the possible interaction effects of the process variables on the response were obtained. Their significance was checked by variance analysis (ANOVA). Three-dimensional plots were drawn using the RSREG (SAS: statistical analysis sys- tem, SAS institute, U.S.A) to illustrate the effects of independent variables on the response. Last- ly, two additional replicates were conducted to verify the validity of the predicted optimum values by the program.
Optimization (maximizing glucose convert- sion) of the fitted polynomial was determined using numerical optimization contained in the RSREG (SAS: statistical analysis system, SAS institute U.S.A). After optimizing the conditions using RSM, it was validated by extruding the waste paper at the identified optimum acid con- centration, loading sulfuric acid and reaction time.
2.4. Analytical Methods
The chemical composition of waste paper was determined by the National Renewable Energy Laboratory (NREL) using standard biomass ana- lytical procedures. The glucose content was deter- mined by American Society for Testing and Materials (ASTM) using standard test method for determination of carbohydrates in biomass
by gas chromatography. The gas chromatography (Model YL 6100, Younglin, KOREA) system was equipped with a DB-225 capillary column (5 m, 0.25 mm ID, 0.25 mm film thickness) (J&
W Scientific, Folsom, CA). Nitrogen was used
as the carrier gas. An initial column temperature
of 190°C was held for 1.0 min. before ramping
at 10°C per min. up to 220°C where it was kept
steady for 14 min. The injection port temper-
ature was set at 200°C, and the FID temperature
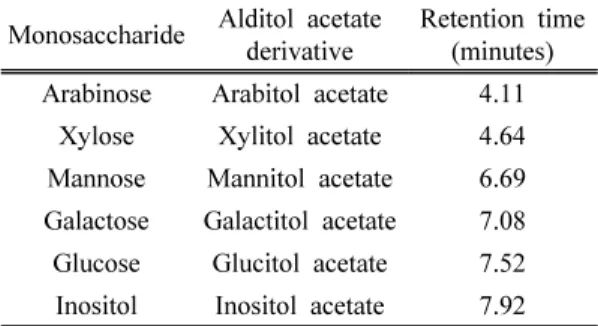
Table 3. Retention times for monosaccharide alditol acetates on DB-225 capillary column
Monosaccharide Alditol acetate derivative
Retention time (minutes) Arabinose Arabitol acetate 4.11
Xylose Xylitol acetate 4.64 Mannose Mannitol acetate 6.69 Galactose Galactitol acetate 7.08 Glucose Glucitol acetate 7.52 Inositol Inositol acetate 7.92
was set at 250°C. Total column flow was 50 ㎖ /min., sample linear velocity through the column was 78 cm/s, column flow was 3.0 ㎖/min., and 2 ㎕ samples were injected with a split ratio of 15:1. The retention times for each monomer can be found in Table 3.
The glucose conversion after concentrated acid hydrolysis was calculated by Eq. (1):
% Glucose conversion (1)
= Weight of glucosein acid hydrolysate (g) Weight of glucose in pretreatedcomputer printout (g) ×100
3. RESULTS and DISCUSSION
3.1. Chemical Composition of Waste Paper
The waste paper was divided into: corrugated paper and paper bags, newspaper, coated paper, cardboard and uncoated, wood-free paper (Jan- nick et al., 2007). The chemical composition of waste paper was shown in Table 4.
Newspaper was found to contain, cellulose (57.1%), hemicellulose (8.4%), lignin (17.2%) and ash (6.2%). The results obtained here were similar to earlier studies, where lignin and holo- cellulose content in newspaper were found to be 16 ∼22% and 60∼75%, respectively (Lee et al.,
2000; Torget et al., 2000). Also, Table 4 shows the chemical composition of the old corrugated containers. Experimental results show that about 47.5% of the oven-dry cardboard weight cor- responds to cellulose, a proportion lower than the one reported for Yáñez et al. (59.7%) (Yá- ñez et al., 2004). Computer printout main con- tained 68.2% holocellulose (59.2% cellulose and 9.0% hemicellulose) and 17.5% ash content.
Among three sources of waste paper including computer printout, newspaper and old corrugat- ed containers, computer printout gave the highest values of cellulose. Carbohydrate (cellulose and hemicellulolose) was higher than that reported for other lignocellulosic material like wood, agri- culture residue (Chen et al., 2007; Mamma et al., 1995; Gnansounou et al., 2005; Li et al., 2010, Wiselogel et al., 1996). The high cellu- lose content in the computer printout made it a substrate of choice for glucose production.
3.2. Pretreatment of Computer Printout
Computer printout was defined as that paper used in plain paper copiers; waste computer printout denotes plain paper copiers after print- ing in a printer or copy machine. computer print- out contain toner or ink-related compounds on the surface of paper (Park et al., 2004). The ink fixed on the repeating units of cellulose back- bone block the sequential hydrolysis of paper and inhibited the hydrolysis kinetics signifi- cantly (Kuhad et al., 2010). To determine their effects on yield and cellulose recovery, computer printout were used for pretreatment. The pur- pose of this pretreatment was to remove the toner and ink-related compounds in computer printout.
At first attempt at pretreatment, the disinteg- ration condition was tested at room temperature during five different disintegration time 30∼
150 s. Fig. 2 shows the yield and cellulose re-
covery resulting from pretreatment at different
Table 4. Chemical composition of waste paper
1)Composition % Dry weight
Newspaper Old corrugated containers Computer printout
Extractives 9.7 ± 0.3
2)8.8 ± 0.4
2)9.2 ± 0.8
2)Cellulose as glucose 57.1 ± 0.1 47.5 ± 0.1 59.2 ± 0.2
Hemicellulose
3)as 8.4 10.6 9.0
Xylose 5.5 6.8 7.6
Galactose 0.8 0.4 0.0
Arabinose 0.8 0.7 0.4
Mannose 1.3 2.8 1.0
Acid insoluble lignin 14.3 ± 0.2 14.5 ± 0.1 3.0 ± 0.1
Acid soluble lignin 2.9 ± 0.0 3.6 ± 0.0 3.4 ± 0.0
Ash 6.2 ± 0.2 12.7 ± 0.2 17.5 ± 0.3
Protein 0.5 ± 0.1 0.9 ± 0.1 0.4 ± 0.1
1)
Data in the table was based on oven dry samples.
2)
Mean values of triplicate samples with standard deviations.
3)
Hemicellulose : xylose + galactose + arabinose + mannose.
Fig. 2. Effect of disintegration time on the pre- treatment.
disintegration time. The recovered computer print- out samples have significantly reduced yield (p
< 0.05) and cellulose recovery compared to the untreated computer printout. During disintegra- tion, yield was decreased by 7.6%, and 12.1%
of cellulose recovery. The yield ranged between 93.0 and 92.4%, cellulose recovery ranged be- tween 49.6 and 41.9%. The maximum cellulose recovery in disintegrated computer printout was obtained at disintegration time 30 s. In flotation deinking lines, ink removal exceeds 80∼90%
but a modest ink separation selectivity (Zhu et al., 2005) results in high losses (15∼30%) of mineral fillers and cellulosic material (Beneventi et al., 2007).
In flotation deinking process, mechanisms go- verning inter fibre and bubble/fibre interaction in aerated pulp slurries and their contribution to the fibre yield during the flotation deinking process, are not fully understood.
Experimental data showing the effects of vari- ous loading deinking agent on yield and cellu- lose recovery are summarized in Fig. 3. As this
Fig. 3 suggests, yield of disintegrated computer printout decreased with increased loading deink- ing agent. The cellulose recovery attained their maximum at approximately 15 ㎖ of deinking agent per 100 g of computer printout.
The practice of caustic pulping originates from
the success in the deinking of computer print-
out. However, the computer printout was print-
ed with oil-based inks. Such inks were removed
from the paper by a saponification reaction (Mc-
kinney, 2005)
Fig. 3. Effect of loading deinking agent on the pre- treatment.
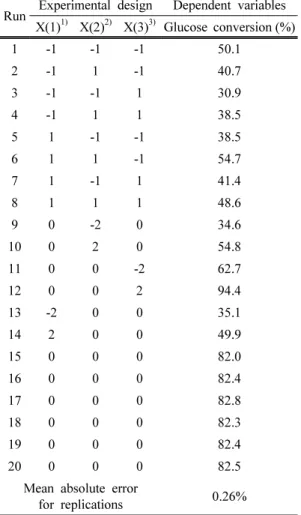
Table 5. Experimental data for concentrated acid hydrolysis of computer printout Run Experimental design Dependent variables X(1)
1)X(2)
2)X(3)
3)Glucose conversion (%)
1 -1 -1 -1 50.1
2 -1 1 -1 40.7
3 -1 -1 1 30.9
4 -1 1 1 38.5
5 1 -1 -1 38.5
6 1 1 -1 54.7
7 1 -1 1 41.4
8 1 1 1 48.6
9 0 -2 0 34.6
10 0 2 0 54.8
11 0 0 -2 62.7
12 0 0 2 94.4
13 -2 0 0 35.1
14 2 0 0 49.9
15 0 0 0 82.0
16 0 0 0 82.4
17 0 0 0 82.8
18 0 0 0 82.3
19 0 0 0 82.4
20 0 0 0 82.5
Mean absolute error
for replications 0.26%
1)
Coded value of acid concentration (%).
2)
Coded value of loading sulfuric acid ( ㎖ ).
3)