Development of the SWAT DWDM for Accurate Estimation of Soil Erosion from an Agricultural field
농경지에서 발생되는 토양유실의 정확한 산정을 위한 SWAT DWDM 개발
Jang, Won Seok*․Park, Younshik*․Kim, Jonggun*․Kim, Namwon**
Choi, Joongdae*․Ok, Yong Sik***․Yang, Jae E***․Lim, Kyoung Jae*,†
장원석*․박윤식*․김종건*․김남원**․최중대*․옥용식***․양재의***․임경재*,†
ABSTRACT
준분포형 모형인 SWAT 모형은 소유역내 수문학적 반응단위 별로 유출, 유사 등의 발생을 평가하는데 이때 Hydrological Response Unit (HRU)의 지형정보가 활용된다. 현재 SWAT 모형의 인터페이스 구조는, 각 소유역의 평균 지형인자 값이 각 소유 역내의 모든 HRU의 지형정보로 사용된다. 그러므로 각 소유역내의 HRU에 있는 지형인자를 정확하게 추출하기 위해서는 수계 를 자세하게 나누어야 하며, 이를 위해서 더욱 자세한 소유역 수계 인터페이스가 필요하다. 현재 SWAT 모형 인터페이스에서는 수계를 나눌 때 임계값의 최소값은 최대 flow accumulation 값의 0.1 %가 사용된다. 따라서 HRU의 지형인자를 추출하기 위해 아주 자세한 정도로 소유역의 수계를 나눈다는 것은 불가능하다. 본 연구에서는 사용자가 원하는 임계값과 농경지 경계를 근거 하여 소유역 경계를 추가로 수계를 나눌 수 있는 Dual Watershed Delineation Module (DWDM) 을 개발하였다. 기존 SWAT의 수 계추출 모듈로 유량을 모의한 결과 27,219 m3/month 가 산정되었고, DWDM 을 적용한 결과 26,172 m3/month 로 약 3.8 %의 미 미한 차이가 생겼다. 하지만 유사의 경우 DWDM을 적용하기 전에는 0.779 ton/month, 적용 후에는 2.688 ton/month 로 약 245 % 의 차이를 보였다. 즉 농경지를 추가적으로 수계를 나눌 때 유사의 가장 민감한 요소인 경사장을 실제지형에 맞게 고려함에 따 라 좀 더 정확한 유사 산정을 할 수 있었다. 농경지에서의 정확한 수문 및 유사 평가 시 본 연구에서 개발한 모듈이 적용 되어 야 한다고 사료된다.
Keywords: 농경지 유역; Dual Watershed Delineation Module; Hydrological Response Unit; Soil and Water Assessment Tool;
Watershed delineation
I. INTRODUCTION*
In recent years, there have been considerable debates due to muddy water inflow into water bodies in Korea as well as other countries, which is important factor in efficient water resources planning. Excessive muddy water inflow is causing deterioration in water quality and malfunctioning of ecosystem. Sediment yield originating from an agricultural field, especially near streams, has
* Dept. of Regional Infrastructures Engineering in Kangwon National University
** Korea Institute of Construction Technology
*** Dept. of Biological Environment in Kangwon National University
† Corresponding author. Tel.: +81-33-250-6468 Fax: +81-33-251-1518
E-mail address: [email protected] 2010년 1월 5일 투고
2010년 1월 23일 심사완료 2010년 1월 25일 게재확정
been blamed for primary cause of muddy water problems in many watersheds such as Doam, Imha, and Soyang dam watersheds in Korea (Yoo et al., 2007, Park et al., 2007, Jung et al., 2007).
To develop proper soil erosion best management practices, magnitude and extent of soil erosion and transport behaviors of it have to be fully understood for maximum soil erosion reduction efficiency. For these ends, many hydrologic and soil erosion models, such as the AnnAGNPS (Binger and Theurer, 2003), HSPF (Bicknell et al., 2001), Pesera (Gobin and Govers, 2003), WEPP (Pandey et al., 2008), EUROSEM (Cai et al., 2005), SATEEC (Park et al., 2008), SWMM (Hwang et al., 2009), and SWAT (Arnold et al., 1998), have been developed and tested for numerous watersheds in many countries over the years. Among these models, the SWAT model has been widely used worldwide (Arnold
and Fohrer, 2005, Jha et al., 2006, Kim et al., 2008, Luo et al., 2008, Srinivasan et al., 1998) because of its flexibility in spatial and temporal studies of rainfall-runoff, generation and transport of nonpoint source pollutants.
The SWAT model (Arnold et al., 1998) is a continuous- time semi-distributed simulation watershed model. It was developed to predict the effects of alternative management decisions on water, sediment, and chemical yields with reasonable accuracy. One of its attractive features is that there is a long period modeling experience behind this model. It is chosen for modeling of catchment-scale sediment fluxes to the river. It is a well-documented model with an open source code that is able to manage hydrology, sediments, nutrients, and pesticides (Neitsch et al., 2002). However, the SWAT model has its structural problems in contrast to the benefits.
As the SWAT model is not a fully distributed model, the spatial location and topographic features of all HRU within each subwatershed, which is the basic computation element in the SWAT model, are ignored in simulating hydrology and water quality at a watershed scale. It is important to note that topographic features of each HRU, such as field slope and field slope length, affect soil erosion and transport processes. Therefore, HRU-specific topographic feature should be used in simulating hydrology and water quality for each HRU within subwatershed for higher accuracy in simulated results. However, the current SWAT model/interface does not consider HRU-specific topographic data in hydrology and water quality simulation because it is not fully distributed model, as described before. For this reason, the SWAT model cannot calculate sediment value for each HRU correctly, resulting in errors in simulated sediment value at the watershed outlet. If an agriculture field is included in the watershed, impacts of using non HRU-specific topographic feature on estimated sediment will be greater than those with other parameter adjustments in calibration and validation processes. Thus, each land parcel of agricultural fields has to be simulated separately for higher accuracy in simulated hydrology and water quality from it.
Various studies about HRU have been conducted to solve the problem that the SWAT model has not been
able to estimate accurately topographic features of each HRU (Kim et al., 2007, Heo et al., 2008, Jha et al., 2002, Jang et al., 2009). However, there still have remained various uncertainty problems when hydrology and water quality were simulated using the SWAT model because previous studies, such as studies of Kim et al. (2007), Heo et al. (2008), Jha et al. (2002), and Jang et al.
(2009), could not still reflect topographic features of each HRU perfectly. Watershed delineation is the process of identifying the drainage area of a point or set of points. Despite the importance of detailed watershed delineation, there is no function of delineation in detail (i.e., each parcel of the agricultural field) in the current SWAT interface (Neitsch et al., 2004).
In the current SWAT interface, approximately 40 % and 0.1 % values of maximum flow accumulation are used as maximum and minimum threshold values, respectively, in watershed delineation processes (Neitsch et al., 2004).
With this limitation in the SWAT interface, the SWAT users cannot delineate very detailed subwatershed networks, at agricultural field boundary level. With the ArcView Avenue programming, SWAT users can override this limitation by reset the minimum threshold value for corresponding variable and then delineate very detailed subwatershed networks, at agricultural field boundary level. However, this will result in thousands of sub- watersheds and streams networks, causing extremely long simulation time or crashes while performing SWAT computation. Thus, it would be reasonable in terms of accuracy and simulation performance by delineating sub- watershed networks in detail for areas with agricultural fields, and subwatershed networks roughly for non- agricultural areas, such as forest and pasture because it has been reported that major sediment yield comes from the agricultural fields within the watershed (Hartcher and Post, 2005) if no significant amounts of sediment coming from gully and landslides within watershed.
The objectives of this study were to: 1) develop the Dual Watershed Delineation Module (DWDM) to delineate subwatersheds and stream networks in detail for areas with agricultural fields and roughly for non-agricultural
areas, and 2) apply the DWDM module for the study watershed to demonstrate why the DWDM should be used in streamflow, soil erosion, and sediment yield studies at a watershed scale.
II. METHODOLOGIES
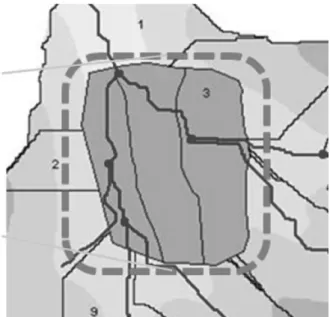
In this study, the DWDM was developed to complement limitations in the SWAT interface when delineating subwatersheds and streams networks. With the current automatic watershed delineation module in the SWAT model, it is not possible to reflect agricultural field boundaries in delineating water flow paths because watershed delineation was managed based on DEM, which is not that detail for agricultural field boundaries.
That is why subwatershed boundaries delineated with the DEM sometimes cross the agricultural field boundaries (Fig. 1). The DWDM was applied to one subwatershed located in Jawoon-ri watershed, experiencing significant amount of soil erosion and sediment yield due to intensive agricultural farming, in Korea. More detailed description regarding development of the DWDM and its application for analysis of stream flow and sediment yield were depicted as follows.
Fig. 1 Watershed delineation for agricultural field in detail using the current watershed delineation module in the SWAT model
1. Development of the SWAT DWDM
The DWDM was developed in this study in order to predict hydrological and water quality at agricultural field level more accurately than before with the SWAT model.
The processes for the development of the DWDM were as follows (Fig. 2).
First of all, automatic watershed delineation interface in the current SWAT interface was analyzed. Also analysis of watershed delineation extraction module was performed.
Second, the DWDM interface was designed based on the current watershed delineation dialog box. Third, the module for burning agricultural field boundary with the DEM was developed. Finally, after developing the module to create streamlink considering both streamlink made by automatic watershed delineation module in the current SWAT and that made by agricultural field boundary using various ArcView Avenue programmings, the DWDM for watershed delineation extraction was developed for accurate estimation in each parcel of agricultural fields.
Thus, to simulate agricultural field accurately as real situation, agricultural boundary made by the SWAT user according to on-site agricultural field through field survey was delineated to conduct watershed delineation of each part of an agricultural field independently using the DWDM developed in this study.
In the current SWAT model, Stream network theme can be superimposed onto the DEM to define the location of the stream network. This feature is most useful in situations where the DEM does not provide enough detail to allow the interface to accurately predict the location of the stream network. Burning in a stream network theme improves hydrographic segmentation and subwatershed boundary delineation (Neitsch et al., 2002).
Therefore, as the module which is able to burn agricultural boundary using agricultural boundary shape file and DEM was developed to simulate an agricultural field effectively, such as burning in stream network theme in the current SWAT model, it could simulate an agricultural field more accurately through extra burning in an agricultural boundary. Fig. 3 shows the SWAT model process with application of the DWDM.
Fig. 2 Flowchart for the development process of the DWDM
Fig. 3 Flowchart describing the SWAT model process in- cluding the DWDM
2. Study area
Small rural, hilly watershed (Fig. 4), situated in the southern part of Hongcheon-gun, Gangwon-do in South Korea, was selected to demonstrate necessity of de- velopment of the SWAT DWDM module.
The latitude and longitude of study area are north 39 degrees 42 minutes 17 seconds and 128 degrees 24 minutes 8 seconds respectively. Elevation above MSL for the study watershed ranges from 725 to 899 m, with average elevation of 806.4 m. The Jawoon catchment drains an area of 0.2697 km2 (26.93 ha) and its major
Fig. 4 Location map of study watershed in Jaun-ri, Hongcheon-gun in South Korea
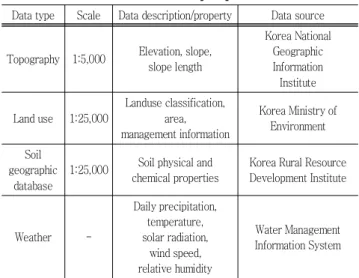
Table 1 The SWAT input parameters Data type Scale Data description/property Data source
Topography 1:5,000 Elevation, slope, slope length
Korea National Geographic Information
Institute Land use 1:25,000
Landuse classification, area, management information
Korea Ministry of Environment
Soil geographic
database
1:25,000 Soil physical and chemical properties
Korea Rural Resource Development Institute
Weather -
Daily precipitation, temperature, solar radiation,
wind speed, relative humidity
Water Management Information System
stream is 0.764 km long. The average annual temperature is 11.1 ℃ and average yearly precipitation is 1,141 mm.
Primary land cover types within the watershed consist of a cultivated area (1.06 ha, 3.83 %) and a forest (23.83 ha, 96.17 %).
3. The SWAT input parameters
The SWAT input data, such as land uses, soil, DEM, and long-term weather data (Table 1) were prepared for the study watershed to evaluate the effects on streamflow and sediment of using the DWDM in SWAT runs. Digital soil map (1:25,000) from the Korea Rural Resource
(a) Soil map (b) Land use map (c) DEM map
Fig. 5 Soil, land use, and DEM map in Jaun-ri, Hongcheon-gun in South Korea
Development Institute was used (Fig. 5(a)). Digital land use data (Fig. 5(b)) obtained from the Korea Ministry of Environment was used to represent HRU with the soil data as shown in Fig. 5(a). Digital Elevation Models (DEMs) (Fig. 5(c)) with cell sizes of 1 m were prepared using the 1:5,000 digital map obtained from the Korea National Geographic Information Institute. Long-term daily historic weather data (from 1993 through 2007) collected from the weather station in Hongcheon-gun, the nearest one, Gangwon province were used in the evaluation of the DWDM.
4. Application of the DWDM to evaluate effects on streamflow and sediment
Watershed delineation and stream routing are carried out with DEM in the current SWAT model. That is, stream is routed through DEM. In general, from high elevation to low elevation, stream runs, and at the lower elevation than that of neighboring points, stream is gathered and formed. In this manner, the current SWAT model also makes stream at lower elevation than that of neighboring points.
With the stream formed by DEM, the current SWAT model routes the stream and simulates water quality and sediment. As the elevation is calculated based on DEM in the SWAT model, the elevation difference among neighboring points might be changed depending on DEM grid cell size. In many areas where stream is formed,
there is little difference of the elevation among neigh- boring areas.
In this study, to overcome the aforementioned limitations of the SWAT model which form the stream nothing but using DEM, after making a shape file for real agricultural boundary through field survey or high resolution satellite image, it is inputted into “burn_in using agricultural field boundary” dialog box to analyze agricultural canals for additionally burning stream to estimate sediment and nutrient pollution from each parcel of an agricultural field accurately. Therefore, the additional watershed delineation of agricultural fields was conducted using the DWDM developed in this study to simulate streamflow and sediment, and the result values of them were compared with or without the DWDM.
III. Results
1. Development and application of the SWAT DWDM
The watershed delineation dialog box in the current SWAT is shown as Fig. 6, and Fig. 6 also represents the DWDM dialog box applying the DWDM developed in this study. To apply the DWDM into study area, additional burning for an agricultural field should be conducted and additional data of an agricultural boundary which is obtained through field survey is needed to reflect real situation. After cultivating the ESRI shape file from agricultural boundary data, which is acquired through field
survey, to be applied into the SWAT model, agricultural field could be burned individually if it is inputted into additional agricultural burning module.
In the DWDM, threshold area for an agricultural field can be defined such as threshold area for whole watershed is determined in the current SWAT. When comparing these two modules in the SWAT model, we have to check each part of the modules. Contrary to the current watershed delineation module which cannot consider agricultural field boundary in the SWAT model, the DWDM allows users to use a shape file for the agricultural field boundary in order to both be able to consider agricultural field boundary and delineate the agricultural field in a more detailed manner (Fig. 6).
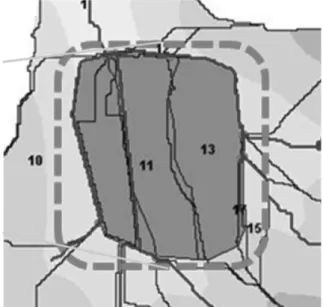
Agricultural boundary was not considered at all when burning it because of the problem as stated above that automatic watershed delineation module based on the DEM in the current SWAT was not able to delineate agricultural field reasonably well. Watershed delineation for each agricultural field is available considering an agricultural boundary using the DWDM because of additional burning of an agricultural field. Moreover simulations of hydrology, water quality, and sediment could be implemented considering the real agricultural field. As taking agricultural boundary into account shown as Fig. 7, when delineating an agricultural field, watershed delineation of it can be managed according to an agricultural field in contrast of Fig. 1.
In particular, after adding the agricultural field boundary
Fig. 6 The current watershed delineation module and DWDM
theme on the SWAT view, users can select a shape file for the agricultural field boundary. At the step of DEM set up, “Burn_in using Agricultural Field Boundary” was added to consider spatially distributed parameters, which functions to delineate an agricultural field in detail. Also, at the step of the stream definition, “Threshold Ag. Field Area” was an additional feature of defining the threshold area users want. Thus, users could simulate a real situation of an agricultural field using the DWDM with ease. Additionally, runoff characteristic regarding real topographic feature can be considered as well. In the current SWAT model, the slope length is calculated as the horizontal distance from the origin of overland flow to the point where either the slope gradient decreases enough that deposition begins or runoff becomes con- centrated in a defined channel (Wischmeier and Smith, 1978). Surface runoff will usually concentrated in less than 122 m (400 ft), which is a practical slope length limit in many situations (Wischmeier and Smith, 1978), although longer slope lengths of up to 305 m (1,000 ft) are occasionally found.
Therefore, Kim et al. (2009) developed the SWAT ArcView GIS Patch II, which calculates an average slope length of an HRU regarding topography, flow accumulation, and upper bound of slope length provided by users. The
Fig. 7 Watershed delineation for agricultural field in detail using the DWDM in the SWAT model
SWAT ArcView GIS Patch II (Kim et al., 2009) was incorporated in the DWDM, and applied because the average slope of the Jawoon-ri watershed is about 47.1
% (>25 %).
2. Effects on hydrology of using the DWDM in SWAT runs
The result is shown in Fig. 8. The simulation period is from Feb 1, 2000 to Dec 31, 2005. The monthly average streamflow with the current watershed delineation module is 27,219 m3/month and the streamflow with the DWDM is 26,172 m3/month. The difference between the current watershed delineation module and DWDM is 1,006 m3/ month, which constitute a 3.8 % negligible difference. The DWDM was calculated in each parcel of the agricultural field, so the slope length of each parcel of the agricultural field that the DWDM calculated became shorter than that of the current watershed delineation module calculated.
Fig. 8 Comparison of streamflow between the current watershed delineation module and DWDM
Fig. 9 Comparison of sediment between the current watershed delineation module and DWDM
3. Effects on hydrology of using the DWDM in SWAT runs
The simulated sediment was compared with the current watershed delineation module and the DWDM, which is either according to the additional burning of the agri- cultural field or not during Feb 1, 2000 to Dec 31, 2005.
As shown Fig. 9, the monthly average sediment with the current watershed delineation module is 0.779 ton/month, and the sediment with the DWDM is 2.688 ton/month.
Thesediment with the DWDM is calculated larger than that with the current watershed delineation module. The difference between the current watershed delineation module and the DWDM is 1.909 ton/month, which is a 245 % increasing.
(a) Slope length of HRU DBF in the current SWAT model
(b) Slope length of HRU DBF with the DWDM Fig. 10 Slope length in the current SWAT model and with
the DWDM
Since both the SWAT ArcView GIS Patch II (Kim et al., 2009) and additional burning of the agricultural field were applied, real topographic features of study area were reflected to the SWAT model, and slope length with the DWDM was increased (Fig. 10). Also the SWAT ArcView GIS Patch II calculates slope length of each HRU and subbasin considering flow accumulation, that’s why slope length was increased in contrast to that of current SWAT model based on nothing but DEM without the SWAT ArcView GIS Patch II. As slope length with the DWDM was increased, sediment with the DWDM was increased in SWAT results.
When evaluating sediment yield in the SWAT model based on modified universal soli loss equation (MUSLE), soil erosion and runoff was calculated in the SWAT model as slope length is increased even though there have been same precipitation conditions. The formulas about slope length and sediment yield say that more increasing the slope length is, the more increasing the sediment is (Williams, J. R., 1995) ((1), (2)).
∙
∙ ∙
(1)
where Lhill is the slope length (m), m is the exponential term, and αhill is the angle of the slope.
∙ ∙ ∙ ∙
∙∙∙∙
(2)
where sed is the sediment yield on a given day (metric), Qsurf is the surface runoff volume (mm H2O/ha), qpeak is the runoff rate (m3/s), areahru is the area of the HRU (ha), KUSLE is the USLE soil erodibility factor (0.013 metric ton m2 hr/ (m3-metric ton cm)), CUSLE is the USLE cover and management factor, PUSLE is the USLE support practice factor, LSUSLE is the USLE topographic factor and CFRG is the coarse fragment factor.
IV. CONCLUSION
As the SWAT model was developed within the USA, it
considered the characteristics of American topographic features. Unlike American topographic features, the Asian area, such as Korea, has different topographic features, such as the most steep slope areas, many small agricultural fields, etc. US topographic features, on the other hand, have lots of gentle slope areas and huge agricultural fields. That is why the SWAT model cannot estimate the sediment in each parcel of an agricultural field.
Topographic features in the watershed, especially on an agricultural field, strongly influence the slope and slope length, which is one of the most significant factors in sediment simulation. In particular, agricultural field in steep slope area has resulted in dominant sediment. When simulating this area, the analyst should be more careful.
There are a lot of small agricultural fields in both steep slope areas and small areas in Korea. At this point, to simulate them (i.e., streamflow, sediment, nutrient, etc.) accurately, the SWAT model needs to be modified for each topographic characteristic. The SWAT model has ignored spatial topographic characteristics due to the watershed-scale model, which constitutes a structural problem of the semi-distributed model.
Rather than simulating each of the subbasins in detail, the subbasins are lumped together. In this study, the DWDM was developed as both the solution to the errors of the SWAT model and for an increase in accuracy in a simulation. The factors of the simulated streamflow and the sediment were compared with the current watershed delineation module and DWDM according to the additional burning–and non-burning–of an agricultural field.
(1) The Monthly average streamflow with the current watershed delineation module is 27,219 m3/month, and the streamflow with the DWDM is 26,172 m3/month, which have about a 3.8 % difference.
(2) The Monthly average sediment with the current watershed delineation module is 0.779 ton/month and sediment with the DWDM is 2.688 ton/month, which have about a 245 % difference.
As the results show, when the DWDM was used, there was a significant difference (245 %) in the simulation.
This study shows that when simulating sediment in area
including an agricultural field within steep slope, the DWDM might result in more practical and accurate data in the SWAT model, although the simulated result was not compared with the measured data, calibrated, and validated due to the measured dataless. This study could serve as a guide to simulate hydrology and water quality analysis in area including an agricultural field in a steep slope reasonably well.
Future studies are needed. First, procedures of the DWDM should be modified for the full automation module.
Secondly, the DWDM should be calibrated and validated with the measured data and conduct further tests for other catchments to minimize SWAT errors in performing realistic assessments. Thirdly, as burning stream with the DWDM, there existed new streams around agricultural field boundary. It shouldn’t be actually called streams but agricultural canal. More accurate simulation for each parcel of agricultural field could be available if parameters for agricultural canals (i.e., roughness coefficient, depth, width, etc) through field survey are applied to the SWAT model.
Moreover, the DWDM will help the SWAT model to accurately simulate hydrology and water quality analysis in watershed including an agricultural field in a steep slope.
This research was supported by a grant (code:
2-2-3) from Sustainable Water Resources Research Center of 21st Century Frontier Research Program.
REFERENCES
1. Arnold, J. G., N. Fohrer, 2005. SWAT2000: current capabilities and research opportunities in applied watershed modeling. Hydrological Processes 19(3):
563-572.
2. Arnold, J. G., R. Srinivasan, R. S. Muttiah, and J. R.
Williams, 1998. Large area hydrologic modeling and assessment: part I: model development. Journal of American Water Resources Association 34(1): 73-89.
3. Bicknell, B. R., J. C. Imhoff, J. L. Kittle, and A. S.
Donigian, 2001. Hydrological Simulation Program - .Fortran, Version 12, User's Manual. AQUATERRA
Consultants, Mountain View, California, USA.
4. Binger, R. L., and F. D. Theurer, 2003. AnnAGNPS technical processes: documentation version 3. Available at http://www.ars.usda.gov/Research/. Accessed Mar.
10. 2009.
5. Cai, Q. G., H. Wang, D. Curtin, and Y. Zhu, 2005.
Evaluation of the EUROSEM model with single event data on steeplands in the Three Gorges Reservoir Areas, China. CATENA 59(1): 19-33.
6. Gobin, A., and G. Govers, 2003. Pan - .European erosion risk assessment. 3rd Annual Report -. 5th Framework Programme. Ispra, Italy.
7. Hartcher, M. G, and D. A Post, 2005. Reducing uncertainty in sediment improved representation of land cover: Application to two sub-catchments of the Mae Chaem, Thailand. In: Zerger A, Argent R. (eds).
International Congress on Modelling and Simulation.
Modeling Society of Australia and New Zealand 1147-1153.
8. Heo, S., N. Kim, Y. Park, J. Kim, S. Kim, J. Ahn, K.
Kim, and K. J. Lim, 2008. Evaluation of effects on SWAT simulated hydrology and sediment behaviors of SWAT watershed delineation using SWAT ArcView GIS extension patch. Journal of Korean Society on Water quality 24(2): 147-155 (in Korean).
9. Hwang, J. Y., K. Yeon, I. Kim, K. Kim, J. Choi, J.
Jeon, and K. J. Lim, 2009. Analysis of effect on runoff and water quality of LID using infiltration facilities. Journal of the Korean Society of Agricultural Engineers 51(6): 105-114 (in Korean).
10. Jang, W., D. Yoo, I. Chung, N. Kim, M. Jun, Y. Park, J. Kim, and K. J. Lim, 2009. Development of SWAT SD-HRU pre-processor module for accurate estimation of slope length of each HRU considering spatial topographic characteristics in SWAT. Journal of Korean Society on Water quality 25(3): 351-362 (in Korean).
11. Jha, M., J. G. Arnold, P. W. Gassman, F. Giorgi, and R. R. Gu, 2006. Climate change sensitivity assessment on Upper Mississippi River Basin streamflows using SWAT. Journal of the American Water Resources Association 42(4): 997-1016.
12. Jha, M., P. W. Gassman, S. Secchi, G. Roy, and J. G.
Arnold, 2002. Impact of watershed subdivision level
on flows, sediment loads, and nutrient lossless predicted by SWAT. Working Paper 02-WP 315:
22-23.
13. Jung, Y., N. Kim, and H. Kim, 2007. NOM characteristics by the turbidity in-flow in lake Soyang.
Proceedings of the 2007 KSWW Annual Conference 455-461.
14. Kim, J., Y. Park, D. Yoo, N. Kim, B. A. Engel, S.
Kim, K. Kim, and K. J. Lim, 2009. Development of a SWAT patch for better estimation of sediment yield in steep sloping watersheds. Journal of the American Water Resources Association 45(4): 963-972.
15. Kim, J., Y. Park, N. Kim, S. Heo, K. Kim, J. Choi, and K. J. Lim, 2007. Development of field slope length computation module for accurate soil erosion and sediment modeling using the SWAT. Proceedings of the 2007 KSWW Annual Conference 91-97 (in Korean).
16. Kim, J., Y. Park, N. Kim, I. Chung, W. Jang, J. Park, J. Moon, and K. J. Lim, 2008. Development and evaluation of SWAT Topographic Feature Extraction Error(STOPFEE) fix module from low resolution DEM.
Journal of Korean Society on Water Quality 24(4):
488-498 (in Korean).
17. Luo, Y., X. Zhang, X. Liu, D. Ficklin, and M. Zhang, 2008. Dynamic modeling of organophosphate pesticide load in surface water in the northern San Joaquin Valley watershed of California. Environmental Polluton 156(3): 1171-1181.
18. Neitsch, S. L., J. G. Arnold, J. R. Kiniry, R.
Srinivasan, and J. R. Williams, 2002. Soil and Water Assessment Tool: User Manual, Version 2000.
Grassland, Soil and Water Research Laboratory, Temple, TX.
19. Neitsch, S. L., J. G. Arnold, J. R. Kiniry, R.
Srinivasan, and J. R. Williams, 2004. Soil and Water Assessment Tool: Input / Output file documentation, Version 2005. Grassland, Soil and Water Research Laboratory, Temple, TX.
20. Pandey, A., V. M. Chowdary, B. C. Mal, and M.
Billib, 2008. Runoff and sediment yield modeling from a small agricultural watershed in India using the WEPP model. Journal of Hydrology 348(3-4):
305-319.
21. Park, Y., J. Kim, J. Park, J. Jeon, J. Choi, T. Kim, J.
Ahn, K. Kim, and K. J. Lim, 2007. Evaluation of SWAT applicability to simulation of sediment behaviors at the Imha-dam watershed. Journal of Korean Society on Water Quality 23(4): 467-473 (in Korean).
22. Park, Y., J. Kim, S. Heo, N. Kim, J. Ahn, J. Park, K.
Kim, and K. J. Lim, 2008. Comparison of soil loss estimation using SWAT and SATEEC. Journal of the Korean Society of Agricultural Engineers 50(1): 3-12 (in Korean).
23. Srinivasan, R., T. S. Ramanarayanan, J. G. Arnold, and S. T. Bednarz, 1998. Large area hydrologic modeling and assessment: part II. Model Application.
J. American Water Resour. Assoc. 34(1): 73-89.
24. Williams, J. R., 1995. Chapter 25: The EPIC model.
909-1000. In V. P. Singh(ed.) Computer models of watershed hydrology. Water Resources Publications.
25. Wischmeier, W. H., and D. D. Smith, 1978. Predicting rainfall erosion losses a guide to conservation planning.
The USDA Agricultural Handbook No. 537.
26. Yoo, D., J. Ahn, J. Yoon, S. Heo, Y. Park, J. Kim, K.
J. Lim, and K. Kim, 2008. Analysis of soil erosion and sediment yields at the Doam-dam watershed considering soil properties from the soil reconditioned agricultural fields using SATEEC system. Journal of Korean Society on Water Quality 23(4): 518-526 (in Korean).