http://e-nrp.org
Changes in body weight and food security of adult North Korean refugees living in South Korea
HaYoung Jeong
1, Soo-Kyung Lee
1§and Sin-Gon Kim
21Department of Food and Nutrition, Inha University, 100 Inharo, Namgu, Incheon 22212, Korea
2Department of Internal Medicine, Korea University, Seoul 02841, Korea
BACKGROUND/OBJECTIVES: Relocation to new environments can have a negative impact on health by altering body weight and dietary patterns. This study attempted to elucidate changes in body weight, food security, and their current food and nutrient consumption in adult North Korean refugees (NKR) living in South Korea (SK).
SUBJECTS/METHODS: This study analyzed data on 149 adult NKR from a North Korean refugee health in SK cohort at four time points (leaving North Korea, entering SK, first examination, and second examination). Body weight was self-reported at the two earlier time points and directly measured at the two later time points. Food security, diet-related behaviors (dietary habits and food consumption), and sociodemographic information were obtained using a self-administered questionnaire. Nutrient intake information was obtained by one-day 24-hour recall. Statistical analyses were performed with SPSS ver 23.0.
RESULTS: Body weight increased during relocation by an average of 4 kg, although diversified patterns were observed during the settlement period in SK. Approximately 39.6% of subjects maintained their body weight between the first and second examinations, whereas 38.6% gained and 22.1% lost at least 3% of their body weight at the first examination by the second examination. Food security status improved from 12.1% food secure proportion to 61.7%. NKR showed generally good food and nutrient consumption (index of nutrient quality: 0.77-1.93). The body weight loss group showed the most irregular meal consumption pattern (P < 0.05), and eating-out was infrequent in all three groups. Consumption frequencies of food groups did not differ by group, except in the fish group (P = 0.036).
CONCLUSION: This study observed considerable body weight adjustment during the settlement period in SK after initial weight gain, whereas food security consistently improved. More detailed understanding of this process is needed to assist healthy settlement for NKR in SK.
Nutrition Research and Practice 2017;11(4):307-318; https://doi.org/10.4162/nrp.2017.11.4.307; pISSN 1976-1457 eISSN 2005-6168
Keywords: Refugees, democratic people's republic of Korea, adult, diet, body weight changes
INTRODUCTION
6)The number of North Korean refugees living in South Korea has recently grown to 27,000. There was an increase in North Korean refugees or immigrants entering South Korea after the disastrous food shortage in North Korea in the 1990s [1].
Although the number of North Korean refugees entering South Korea peaked at 2,914 in 2009, the flow remains consistent based on 1,397 North Korean refugees in 2014 [2].
Originally one nation, South and North Korea became two nations after the Korean War from 1950-1953. The people of South and North Korea share the same genetic background but have been exposed to different socio-cultural environments since their division [3]. South Koreans have access to diversified food sources and adequate nutrient intake powered by the economic development of South Korea. Accordingly, the major health problems of South Koreans are diet-related non-communicable diseases such as obesity, diabetes, and hypertension, having
shifted away from the diseases related to undernutrition [4].
In contrast, North Koreans appear to suffer from undernutrition due to economic difficulties caused by the fall of the Soviet economic system and food shortages from continuous natural disasters [5]. Approximately 41.6% of North Koreans were reported as not having consumed sufficient amounts of food in 2015 [6]. Therefore, North Koreans in South Korea may have different nutritional and health status from South Koreans.
Refugees and immigrants face various difficulties and health- related problems such as weight gain in their new environments.
Analysis of the U.S. National Health Interview Survey found that the length of residence of immigrants in their new environments was positively and significantly correlated with body mass index (BMI), indicating that early interventions related to diet and physical activity are important in preventing diet-related non-communicable diseases such as obesity among immigrant populations [7]. Analysis of women who immigrated to South Korea through marriage also showed that the proportion of
This work was supported by INHA UNIVERSITY Research Grant (No. 50400).
§Corresponding Author: Soo-Kyung Lee, Tel. 82-32-860-8121, Fax. 82-32-862-8120, Email. [email protected] Received: December 21, 2016, Revised: June 12, 2017, Accepted: June 13, 2017
This is an Open Access article distributed under the terms of the Creative Commons Attribution Non-Commercial License (http://creativecommons.org/licenses/by-nc/3.0/) which permits unrestricted non-commercial use, distribution, and reproduction in any medium, provided the original work is properly cited.
underweight women decreased with residence time in South Korea, whereas the proportion of obese women increased [8].
Early analysis of the cohort data in this study found that even a small increase in body weight increased the risk of metabolic syndrome [9]. The Handbook for Workers Supporting North Korean Refugees published by the International Organization for Migration emphasized that North Koreans should be advised to consume a high quality rather than high quantity diet since North Koreans who consume high amounts of foods may be at risk of developing chronic diseases [10].
Currently, only a few studies have examined body weight, health, and nutritional aspects among North Korean refugees in South Korea during the adaptation process. Previously conducted studies have investigated food and nutrient consumption in North Korean refugees while in North Korea [11] as well as food preferences and consumption status [12,13].
One study examined the nutrient consumption status of 12-24 year old North Korean refugees [14], whereas another study compared nutrient consumption status between North Korean child refugees and South Korean children [15]. Few studies have examined food and nutrient intake in adult North Korean refugees. Choe et al. [16] reported that North Korean adult refugees who have lived in South Korea for less than 3 years appear to have healthy dietary habits with regular breakfast consumption, sufficient amount vegetable intake, and high-fat food avoidance. This study, however, was limited by the limited number of dietary assessment questions and relatively short length of residence. Therefore, studies are needed that investigate how North Korean refugees experience changes in body weight, food security, and diet during their adjustment in South Korea.
This study attempted to understand 1) changes in body weight and food security among adult North Korean refugees living in South Korea over the course of relocation and 2) current food and nutrient consumption among adult North Korean refugees living in South Korea.
SUBJECTS AND METHODS
Study design and subjectsThis study analyzed data from a North Korean refugee health in South Korea (NORN) cohort [17]. This cohort began in October of 2008 by recruiting subjects using the snowball method with assistance from the North Seoul branch of the Hana Center. The Hana Center provides settlement-related support to North Korean refugees. Adult North Korean refugees (age > 19 years) voluntarily participated, responding to the announcement for a health check-up. Subjects completed a health questionnaire and underwent a complete medical check-up. Follow-up of the cohort started in August of 2012 and is currently on-going. Data on 163 subjects who underwent their first examination between October 2008 and November 2013 and second examination between August 2012 and October 2015 were used in this study. Among the 163 subjects, 14 were excluded because of incomplete questionnaires or double participation, resulting a final sample of 149 subjects.
The study protocol was approved by the Korea University Institutional Review Board (No. ED08023).
Measurements
Subjects were asked to complete a 34-item diet and health questionnaire and 63-item food frequency questionnaire. The questionnaires were self-administered and took approximately 20 minutes. Individual diet and nutrition counseling was administered for approximately 15 minutes. Height and weight were measured as a part of the medical check-up that took approximately 1.5 hours. The medical check-up was conducted after fasting for 8 hours or longer.
Body weight changes
Body weight was obtained for four time points: leaving North Korea, entering South Korea, first examination, and second examination. Body weights when leaving North Korea and entering South Korea were self-reported through the diet and health questionnaire.
Additionally, questions on subjective determination of body shape (very thin, thin, normal, fat, and very fat) and body weight changes (no change, weight gain, and weight loss) were also included in the questionnaire. A question on intentional weight changes was included to determine whether or not subjects attempted weight management for weight loss, gain, main- tenance, or not at all.
Body weights at the first and second examinations were measured during the medical check-up. BMI calculated based on the measured weight and height was used to group subjects by body weight status into four categories according to World Health Organization & the International Obesity Task Force: Asia [18]: underweight (BMI < 18.5 kg/m
2), normal (18.5 ≤ BMI < 23 kg/m
2), overweight (23 ≤ BMI < 25 kg/m
2), and obese (BMI ≥ 25 kg/m
2).
Based on body weight changes from the first to second examinations, subjects were grouped into three categories (body weight gain, body weight maintenance, and body weight loss) to elucidate body weight change patterns during the settlement period in South Korea.
Subjects who gained 3% or more of their body weight at the first examination by the second examination were identified as the “body weight gain” group while subjects who lost 3%
or more of their body weight at the first examination by the second examination were identified as the “body weight loss”
group. All other subjects with a body weight within the 3%
of their body weight at the first examination were identified as the “body weight maintenance” group. This cut-off value of 3% was chosen for this study because the value was determined not only for clinical but also for public health applications, comparability across body sizes, measurement error, normal weight fluctuations, and biologic relevance, whereas other recommendations tended to focus on clinical applications for intentional body weight loss [19].
Food security
Food security was examined using two sets of questions. First,
a translated version of household food insecurity access scale
(HFIAS), developed by the United States agency for international
development and food and nutrition technical assistance was
used to determine the household food insecurity status of the
subjects in North Korea. HFIAS was developed to assess the
Body weight loss group (n = 33, 22.1%)
Body weight maintenance group
(n = 59, 39.6%)
Body weight gain group (n = 57, 38.3%)
Total (n = 149)
P-value Sex
Male 8 (24.2)1) 9 (15.3) 9 (15.8) 26 (17.4) 0.5062)
Female 25 (75.8) 50 (84.7) 48 (84.2) 123 (82.6)
Age (yrs) (n = 33) (n = 59) (n = 57) (n = 149)
51.5 ± 12.93)a 50.2 ± 12.6ab 45.1 ± 10.3b 48.5 ± 12.1 0.0204)5)
19-29 1 (3.0) 1 (1.7) 0 (0.0) 2 (1.3) 0.0776)
30-49 15 (45.5) 31 (52.5) 41 (71.9) 87 (58.4)
50-64 11 (33.3) 17 (28.8) 13 (22.8) 41 (27.5)
≥65 6 (18.2) 10 (16.9) 3 (5.3) 19 (12.8)
Age upon leaving North Korea (yrs) (n = 33) (n = 57) (n = 55) (n = 145)
40.9 ± 12.7a 39.9 ± 14.4ab 33.8 ± 10.8b 37.8 ± 13.0 0.0124)5)
12-18 0 (0.0) 0 (0.0) 3 (5.5) 3 (2.1) 0.1406)
Table 1. Sociodemographic information by body weight change status of adult North Korean refugees in South Korea
food security status of various international populations [20].
This study used the average score of the scale and four categorizations (food secure, mildly food insecure, moderately food insecure, and severely food insecure). Second, a summary question among food security questions from the Korea National Health and Nutrition Examination Survey (KNHANES) was used to assess and compare food security status during the process of relocation from North Korea to the transient nation (if applicable) and eventually to South Korea. The transient nation indicates any nations that subjects went through on their route to South Korea. The summary question consisted of four response items: “All of my family members were able to eat various foods that we wanted to eat in sufficient amounts,” “All of my family members were able to eat food that we wanted in sufficient amounts, but not various kinds,” “We were from time to time short of food due to economic difficulty,” “We were very often short of food due to economic difficulty [21].”
Diet
Diet was examined only at the second examination. Various aspects of diet were examined: 1) dietary habits, 2) food consumption, and 3) energy and nutrient intake.
Dietary habits included skipping rates of breakfast, lunch, and dinner, proportions of breakfast, lunch, and dinner with family, eating-out frequencies, functional food consumption rates, vitamin & mineral consumption rates, proportions of receiving nutrition education or counseling, and proportions of using food labels. These variables were examined using questions for variables in the KNHANES [21].
Food consumption was examined using a non-quantitative food frequency questionnaire from the 2011 KNHANES. Consu- mption frequency of 63 foods was asked with nine response categories (3 times per day, once per day, 4-6 times per week, 2-3 times per week, once per week, 2-3 times per month, once per month, 6-11 times per year, and rarely). This study converted responses to average daily consumption frequencies.
Energy and nutrient intake was examined by the one-day 24-hour recall method. Fully trained research assistants conducted face-to-face 24 hour recall interviews after 1 day using various supplementary food models and pictures. CAN-Pro 5.0 (Computer aided nutritional analysis program 5.0 for professionals, Korean Society of Nutrition, Seoul, Korea) [22] was used to convert the food consumption information to nutrient consumption
information. The 2015 Dietary Reference Intakes for Koreans [23]
was used to determine energy and nutrient intake status. This study also calculated index of nutrients quality (INQ) to determine dietary quality in terms of nutrient intake independent of amount of food consumed. Finally, odd ratios were obtained for likelihood of under- or over-consumption of energy and nutrients by the body weight change group, adjusting for sex, age, age upon leaving North Korea, length of residing in the transient nation, length of residence in South Korea, income, current occupation, education, and marital status. The length of residence in the transient nation was included since many subjects went through a transient nation, mostly China, before arriving in South Korea, and this may have affected their diet [24].
Covariates
Age, age upon leaving North Korea, time period after leaving North Korea, length of residence in the transient nation, length of residence in South Korea, follow-up time between first and second examinations, residence in North Korea (urban or rural), current monthly income, occupation in North Korea and currently, education, number of co-residents, and marital status.
These variables were included since they have been reported to influence body weight, food security, and dietary behavior of refugees and immigrants [7-16]. The variables were self-reported using the diet and health questionnaire.
Statistical analysis
All analyses were conducted with SPSS 23.0 (SPSS Inc., IBM corp., NY, USA). Analysis of continuous variables across the body weight change groups was done with analysis of variance and Tukey’s honestly significant difference test. Kruskal-wallis test was used if the equal variance assumption was not met.
Categorical variables are presented as frequency and percentage and analyzed with chi-square test, and Fisher’s exact test.
Multiple logistic regressions were performed to obtain odd ratios adjusting for covariates.
RESULTS
Sociodemographic information
Sociodemographic information of the subjects is presented
in Table 1. More women (82.6%) than men participated. The
subjects left North Korea at an average age of 37.8 years.
Body weight loss group (n = 33, 22.1%)
Body weight maintenance group
(n = 59, 39.6%)
Body weight gain group (n = 57, 38.3%)
Total
(n = 149) P-value
19-29 8 (24.2) 14 (24.6) 18 (32.7) 40 (27.6)
30-49 16 (48.5) 31 (54.4) 29 (52.7) 76 (52.4)
50-64 8 (24.2) 8 (14.0) 5 (9.1) 21 (14.5)
≥65 1 (3.0) 4 (7.0) 0 (0.0) 5 (3.4)
Time period after leaving North Korea (months)7) (n = 33) (n = 57) (n = 55) (n = 145)
128.1 ± 49.9 131.3 ± 48.9 132.9 ± 52.1 131.2 ± 50.0 0.9095)
Length of residence in the 3rd nation (months)8) (n = 33) (n = 57) (n = 54) (n = 144)
45.6 ± 43.1 46.2 ± 37.8 54.2 ± 46.9 49.1 ± 42.5 0.5355)
Length of residence in South Korea (months)9) (n = 33) (n = 58) (n = 55) (n = 146)
82.5 ± 34.5 84.3 ± 30.8 86.2 ± 72.7 84.6 ± 51.0 0.9485)
Follow-up time between firstand second examinations (months)10) (n = 33) (n = 59) (n = 57) (n = 149)
40.4 ± 7.9 43.1 ± 11.3 40.7 ± 10.9 41.6 ± 10.5 0.3695)
Residence in North Korea (n = 28) (n = 49) (n = 39) (n = 116)
Urban 13 (46.4) 36 (73.5) 22 (56.4) 71 (61.2) 0.0482)
Rural 15 (53.6) 13 (26.5) 17 (43.6) 45 (38.8)
Occupation in North Korea (n = 32) (n = 55) (n = 53) (n = 140)
Manual worker/farmer 19 (59.4) 22 (40.0) 29 (54.7) 70 (50.0) 0.0842)
Office worker/soldier/teacher/professional 13 (40.6) 23 (41.8) 18 (34.0) 54 (38.6)
Student/unemployed 0 (0.0) 10 (18.5) 6 (11.3) 16 (11.4)
Current occupation (n = 31) (n = 58) (n = 55) (n = 144)
Full-time worker 3 (9.7) 10 (17.2) 10 (18.2) 23 (16.0) 0.7546)
Temporary worker 4 (12.9) 10 (17.2) 8 (14.5) 22 (15.3)
The worker for day 4 (12.9) 4 (6.9) 2 (3.6) 10 (6.9)
Businessperson 1 (3.2) 1 (1.7) 4 (7.3) 6 (4.2)
Professional 0 (0.0) 1 (1.7) 2 (3.6) 3 (2.1)
Student/housewife/unemployed 19 (61.3) 32 (55.2) 29 (52.7) 80 (55.6)
Education (n = 32) (n = 58) (n = 55) (n = 145)
Primary school 1 (3.1) 0 (0.0) 0 (0.0) 1 (0.7) 0.1526)
Secondary school 20 (62.5) 27 (46.6) 26 (47.3) 73 (50.3)
Technical college 1 (3.1) 5 (8.6) 4 (7.3) 10 (6.9)
College 2 (6.3) 6 (10.3) 14 (25.5) 22 (15.2)
University 7 (21.9) 18 (31.0) 9 (16.4) 34 (23.4)
Graduate school 1 (3.1) 2 (3.4) 2 (3.6) 5 (3.4)
The number of co-residents (n) (n = 33) (n = 58) (n = 55) (n = 145)
2.4 ± 1.28 2.0 ± 1.16 2.0 ± 0.95 2.1 ± 1.12 0.1315)
Monthly household income (10,000 KRW) (n = 31) (n = 47) (n = 49) (n = 127)
112.5 ± 93.67 140.9 ± 105.51 160.5 ± 134.02 141.5 ± 115.51 0.1955)
< 100 17 (54.8) 18 (38.3) 15 (30.6) 50 (39.4) 0.0956)
100-199 10 (32.3) 20 (42.6) 17 (34.7) 47 (37.0)
200-299 2 (6.5) 4 (8.5) 9 (18.4) 15 (11.8)
300-399 0 (0.0) 2 (4.3) 7 (14.3) 9 (7.1)
≥400 2 (6.5) 3 (6.4) 1 (2.0) 6 (4.7)
Marital status (n = 33) (n = 58) (n = 56) (n = 147)
Never married 3 (9.1) 5 (8.6) 11 (19.6) 19 (12.9) 0.4836)
Married 14 (42.4) 29 (50.0) 29 (51.8) 72 (49.0)
Divorced 5 (15.2) 10 (17.2) 7 (12.5) 22 (15.0)
Separated 3 (9.1) 4 (6.9) 1 (1.8) 8 (5.4)
Widowed 8 (24.2) 10 (17.2) 8 (14.3) 26 (17.7)
KRW: Korea won
1)Frequency (%)
2)Chi-square test
3)Mean ± SD
4)Tukey's honestly significant difference test
5)One-way analysis of variance
6)Fisher's exact test
7)Date of second examination - date of leaving North Korea
8)Date of entry in South Korea - date of leaving North Korea
9)Date of second examination - date of entry in South Korea
10)Second examination - first examination Table 1. continued
Body weight loss group (n = 33, 22.1%)
Body weight maintenance group
(n = 59, 39.6%)
Body weight gain group (n = 57, 38.3%)
Total (n = 149)
P-value
Weight (kg)
Upon leaving North Korea (n = 32) (n = 50) (n = 54) (n = 136)
53.7 ± 8.81) 51.8 ± 7.3 51.4 ± 8.1 52.1 ± 8.0 0.4072)
Upon entering South Korea (n = 31) (n = 52) (n = 53) (n = 136)
57.5 ± 10.8 54.1 ± 7.9 52.6 ± 8.4 54.3 ± 9.0 0.1483)
First examination (n = 33) (n = 59) (n = 57) (n = 149)
60.2 ± 10.7 54.9 ± 6.2 53.9 ± 9.5 55.7 ± 9.0 0.0123)
Second examination (n = 33) (n = 59) (n = 57) (n = 149)
56.0 ± 10.3 54.9 ± 6.2 58.1 ± 10.2 56.4 ± 8.9 0.2313)
Body weight change (kg)2) -4.2 ± 2.2 0.0 ± 1.0 4.3 ± 2.1 0.7 ± 3.71 <0.0013)
Body weight change (%)3) -7.0 ± 3.3 0.0 ± 1.7 8.1 ± 4.03 1.52 ± 6.6 <0.0013)
Body mass index (n = 33) (n = 59) (n = 57) (n = 149)
First examination (kg/m2) 24.0 ± 3.1a 22.6 ± 2.3b 22.0 ± 2.9b 22.7 ± 2.9 0.0062)4)
Underweight 1 (3.0)5) 0 (0.0) 7 (12.3) 8 (5.4) 0.0166)
Normal 15 (45.5) 33 (55.9) 29 (50.9) 77 (51.7)
Overweight 5 (15.2) 17 (28.8) 12 (21.1) 34 (22.8)
Obese 12 (36.4) 9 (15.3) 9 (15.8) 30 (20.1)
Second examination (kg/m2) 22.3 ± 2.8a 22.7 ± 2.30ab 23.8 ± 3.2b 23.0 ± 2.9 0.0252)4)
Underweight 1 (3.0) 0 (0.0) 1 (1.8) 2 (1.3) 0.2246)
Normal 20 (60.6) 32 (54.2) 23 (40.4) 75 (50.3)
Overweight 5 (15.2) 15 (25.4) 13 (22.8) 33 (22.1)
Obese 7 (21.2) 12 (20.3) 20 (35.1) 39 (26.2)
Waist circumference (cm)
First examination (n = 32) (n = 56) (n = 54) (n = 142)
83.3 ± 9.5 78.7 ± 7.7 75.9 ± 8.1 78.7 ± 8.7 <0.0012)
Second examination (n = 33) (n = 53) (n = 52) (n = 138)
79.0 ± 9.0 79.7 ± 7.2 81.8 ± 8.2 80.3 ± 8.1 0.2442)
Subjective determination of body shape (n = 33) (n = 59) (n = 57) (n = 149)
Very thin 1 (3.0) 5 (8.5) 3 (5.3) 9 (6.0) 0.1756)
Thin 7 (21.2) 7 (11.9) 7 (12.3) 21 (14.1)
Normal 16 (48.5) 32 (54.2) 21 (36.8) 69 (46.3)
Fat 9 (27.3) 14 (23.7) 20 (35.1) 43 (28.9)
Very fat 0 (0.0) 1 (1.7) 6 (10.5) 7 (4.7)
Subjective determination of body weight changes (n = 33) (n = 59) (n = 57) (n = 149)
No change 7 (21.2) 17 (28.8) 5 (8.8) 29 (19.5) <0.0017)
Weight loss 13 (39.4) 13 (22.0) 5 (8.8) 31 (20.8)
Weight gain 13 (39.4) 29 (49.2) 47 (82.5) 89 (59.7)
Whether subjects tried weight management (n = 33) (n = 59) (n = 57) (n = 149)
Weight loss 16 (48.5) 17 (28.8) 31 (54.4) 64 (43.0) 0.0107)
Weight maintain 9 (27.3) 12 (20.3) 3 (5.3) 24 (16.1)
Weight gain 3 (9.1) 6 (10.2) 4 (7.0) 13 (8.7)
No try at all 5 (15.2) 24 (40.7) 19 (33.3) 48 (32.2)
1)Mean ± SD
2)One-way analysis of variance
3)Kruskal-wallis test
4)Tukey's honestly significant difference test
5)Frequency (%)
6)Fisher's exact test
7)Chi-square test
Table 2. Anthropometric measurements and weight status perception according to the weight change status over the course of relocation in adult North Korean refugees
Subjects lived in the transient nation for an average of 49.1 months before entering South Korea. The average length of residence in South Korea was 84.6 months. Just over one half of subjects used to live in urban areas in North Korea, and half of subjects worked as labor or in agriculture. In South Korea, subjects lived with two family members, 49% of subjects were
married, and more than 70% of subjects earned less than 1,990,000 Korean won a month.
A total of 39.6% of the subjects maintained their body weight
within a 3% range (body weight maintenance group), whereas
38.3% gained weight (body weight gain group) and 22.1% lost
weight (body weight loss group). The body weight gain group
Body weight loss group (n = 33, 22.1%)
Body weight maintenance group
(n = 59, 39.6%)
Body weight gain group (n = 57, 38.3%)
Total (n = 149)
P-value
Household food insecurity in North Korea (n = 33) (n = 57) (n = 57) (n = 147)
HFIAS 11.6 ± 9.21) 10.8 ± 9.2 8.9 ± 8.0 10.2 ± 8.7 0.3242)
Food secure 8 (24.2)3) 15 (26.3) 11 (19.3) 34 (23.1) 0.3354)
Food insecure
Mildly 1 (3.0) 1 (1.8) 7 (12.3) 9 (6.1)
Moderately 4 (12.1) 5 (8.8) 8 (14.0) 17 (11.6)
Severely 20 (60.6) 36 (63.2) 31 (54.4) 87 (59.2)
Food security in North Korea (n = 33) (n = 59) (n = 57) (n = 149)
Sufficient amount and various kinds of foods 3 (9.1) 8 (13.6) 7 (12.3) 18 (12.1) 0.7815)
Sufficient amount and not various kinds of foods 7 (21.2) 18 (30.5) 18 (31.6) 43 (28.9)
Sometimes not enough food 12 (36.4) 15 (25.4) 19 (33.3) 46 (60.9)
Often not enough food 11 (33.3) 18 (30.5) 13 (22.8) 42 (28.2)
Food security in the transient nation (n = 33) (n = 59) (n = 57) (n = 149)
Sufficient amount and various kinds of foods 10 (30.3) 27 (46.6) 33 (57.9) 70 (47.3) 0.1314)
Sufficient amount and not various kinds of foods 12 (36.4) 22 (37.9) 16 (28.1) 50 (33.8)
Sometimes not enough food 8 (24.2) 5 (8.6) 6 (10.5) 19 (12.8)
Often not enough food 3 (9.1) 4 (6.9) 2 (3.5) 9 (6.1)
Food security in South Korea (n = 33) (n = 59) (n = 57) (n = 149)
Sufficient amount and various kinds of foods 15 (45.5) 37 (62.7) 40 (70.2) 92 (61.7) 0.0204)
Sufficient amount and not various kinds of foods 11 (33.3) 17 (28.8) 14 (24.6) 42 (28.2)
Sometimes not enough food 6 (18.2) 2 (3.4) 0 (0.0) 8 (5.4)
Often not enough food 1 (3.0) 3 (5.1) 3 (5.3) 7 (4.7)
HFIAS: household food insecurity access scale
1)Mean ± SD
2)One-way analysis of variance
3)Frequency (%)
4)Fisher's exact test
5)Chi-square test
Table 3. Food security information by the weight change status over the course of relocation in adult North Korean refugees
(45.1 ± 10.28) was significantly younger than the body weight loss group (51.5 ± 12.9) (P < 0.05) and left North Korea at a younger age (P < 0.05).
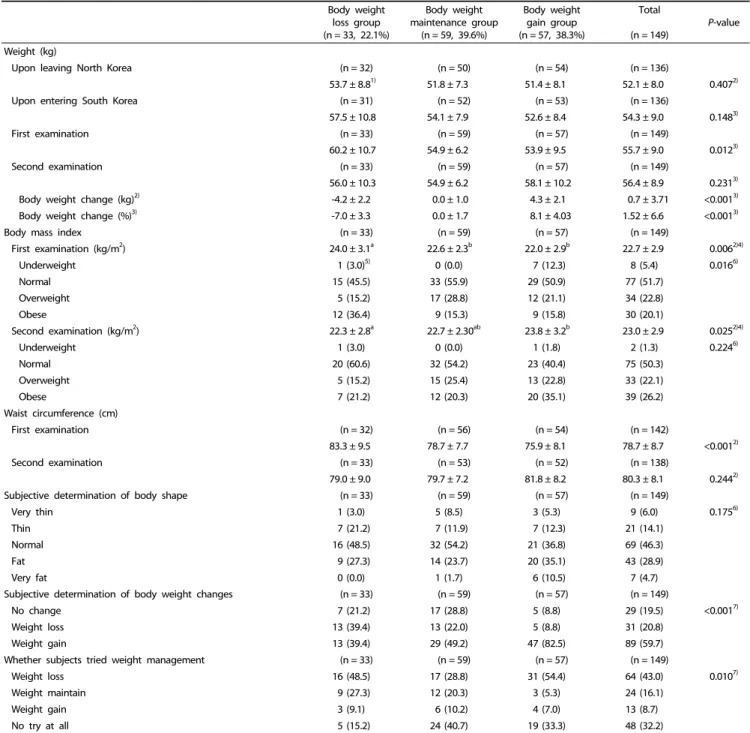
Body weight changes
Body weight changes of adult North Korean refugees in South Korea over the course of relocation are shown in Table 2.
Subjects’ body weights consistently increased after leaving North Korea (52.1 kg ± 8.0) until entering South Korea (54.3 kg
± 9.0). By the first examination, average body weight increased up to 55.7 kg ± 9.0 and further increased to 56.4 kg ± 8.9 by the second examination. Approximately half (50.3%) of subjects were determined to have normal body weight status. The proportion of subjects that identified as obese increased slightly from the first examination (20.1%) to the second examination (26.2%). Subjective determination of body shape found that 46.4% of subjects reported being normal, whereas 33.6% of subjects thought they were either fat or very fat. Over half (59.7%) of subjects reported that they gained weight since relocating to South Korea, whereas 20.8% reported weight loss.
A total of 43% of subjects reported having tried to lose weight.
The body weight maintenance group showed minimal body weight changes (0.0 ± 1.0%), whereas the body weight gain group and body weight loss group showed 8.1% and -7.0%
changes, respectively. At the first examination, the three groups
had significantly different proportions of subjects classified as underweight, normal, overweight, and obese (P = 0.016), whereas no significant associations were detected between the three groups and body weight status at the second examination.
Most (82.5%) of the body weight gain group and 49.2% of the body weight maintenance group reported subjective weight gain, whereas the body weight loss group showed an even split between subjective weight loss (39.4%) and gain (39.4%) (P < 0.001). While most of the body weight loss (48.5%) and body weight gain (54.4%) groups reportedly tried to lose weight, most of the body weight maintenance (40.7%) group reported no attempts (P = 0.01).
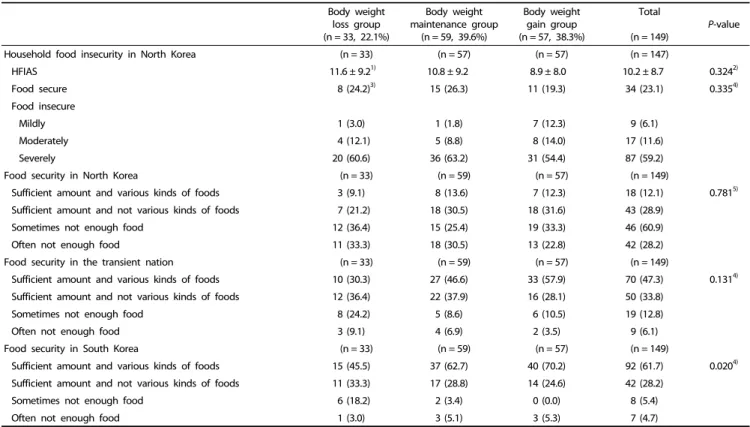
Food security
Food security status while subjects were in North Korea was low (Table 3). Only 23.1% of subjects were identified as “food secure.” Among those who were food insecure, most (59.2%) were severely food insecure. No significant group differences were found.
The food security situation assessed by the summary food
security question from the KNHANES showed improvement
from North Korea through the transient nation to South Korea
(Table 3). A total of 12.1% of subjects reported food consumption
in sufficient amount and various kinds in North Korea, but this
proportion increased to 47.3% in the transient nation as well
Body weight loss group (n = 33, 22.1%)
Body weight maintenance group
(n = 59, 39.6%)
Body weight gain group (n = 57, 38.3%)
Total (n = 149)
P-value
Skipping meal rate1)
Breakfast 34.82) 25.9 46.4 35.8 0.0063)
Lunch 21.0 6.5 7.0 9.9 0.0043)
Dinner 12.1 7.0 5.3 7.5 0.2353)
Proportion of meals with family4) (n = 31) (n = 53) (n = 52) (n = 136)
Breakfast 10 (32.3)5) 22 (41.5) 22 (42.3) 54 (39.7) 0.6263)
Lunch 10 (32.3) 16 (30.2) 16 (30.8) 42 (30.9) 0.9803)
Dinner 18 (58.1) 31 (58.5) 36 (69.2) 85 (62.5) 0.4433)
Eating-out frequency6) (n = 33) (n = 59) (n = 57) (n = 149)
1-3 times per day 1 (3.0) 4 (6.8) 5 (8.8) 10 (6.7) 0.2267)
1-6 times per week 7 (21.2) 11 (18.6) 7 (12.3) 25 (16.8)
1-3 times per month 2 (6.1) 11 (18.6) 15 (26.3) 28 (18.8)
Rarely 23 (69.7) 33 (55.9) 30 (52.6) 86 (57.7)
Functional food consumption rate8) (n = 33) (n = 58) (n = 57) (n = 148)
11 (33.3) 26 (44.8) 25 (43.9) 62 (41.9) 0.5253)
Vitamin & mineral consumption rate9) (n = 32) (n = 58) (n = 57) (n = 147)
11 (34.4) 24 (41.4) 23 (40.4) 58 (39.5) 0.7973)
Proportion of having nutrition education or counseling10) (n = 33) (n = 59) (n = 57) (n = 149)
7 (21.2) 6 (10.2) 6 (10.5) 19 (12.8) 0.2253)
Proportion of using food label (n = 32) (n = 59) (n = 56) (n = 147)
Yes 7 (21.9) 17 (28.8) 9 (16.1) 33 (22.4) 0.4303)
No 4 (12.5) 6 (10.2) 4 (7.1) 14 (9.5)
Unknowing 21 (65.6) 36 (61.0) 43 (76.8) 100 (68.0)
1)Proportion of [the number of people who answer 'no' whether to eat meal (breakfast, lunch, dinner) or not the day before] + [the number of subjects who answer 'no' whether to eat meal (breakfast, lunch, dinner) or not the day before].
2)%: skipping meal rates were calculated from 2-day data, therefore, only average percentages are presented in the table.
3)Chi-square test
4)Rate of people generally (more than 4 days per week) eating a meal with their family
5)Frequency (%)
6)The frequency of people who answer 'How often do you eat out on average within a year?'
7)Fisher's exact test
8)The rate of people who eat functional food continuously for more than 2 weeks, within 1 year
9)The rate of people who eat vitamins & minerals continuously for more than 2 weeks, within 1 year
10)Proportion of having nutrition education or counseling within 1 year
Table 4. Dietary behaviors by the weight change status of adult North Korean refugees in South Korea
as to 61.7% in South Korea. No significant group differences in food security between North Korea and the transient nation were found based on the food security question from the KNHANES. However, the body weight loss group appeared to be less food secure in South Korea than the other two groups (P = 0.02).
Diet
Dietary habits are presented in Table 4. Breakfast was the most often skipped meal (35.8%). Breakfast and lunch skipping rates were significantly different by group with P values of 0.006 and 0.004, respectively. Dinner was the meal most often eaten with family (62.5%), followed by breakfast (39.7%) and lunch (30.9%). Eating-out was not prevalent with only 57.7% reporting eating-out. Less than half of subjects reported having consumed functional foods (41.9%) and vitamin and mineral supplements (39.5%). A few (12.8%) received nutrition education or counseling, and 68% did not know about food labels.
Table 5 shows food consumption frequencies. Cereals and vegetables were the only food groups consumed more than
three times daily, whereas consumption frequency of hamburgers, pizza, and fried foods was the lowest. The consumption frequency of milk and dairy products was 2.3 times per day. Only fish showed a significantly different consumption frequency between the groups (P = 0.036).
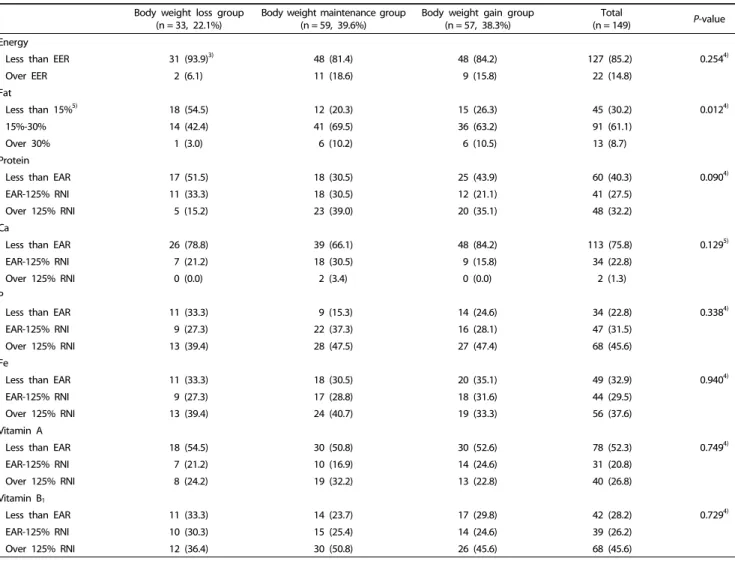
Energy and nutrient intake levels are shown in Table 6. A total of 85.2% of subjects reported less energy intake than estimated energy requirements, whereas 40.3% reported less protein intake than estimated average requirement (EAR). More than half (61.1%) of subjects obtained energy from fat within the recommended range of 15-30%. Approximately three quarters (75.8%) of subjects consumed less calcium than EAR. More than half of subjects consumed less vitamin B
2(54.4%), niacin (54.4%), and vitamin C (59.7%) than EAR. Many subjects (71.8%) consumed more sodium than the recommended level. A total of 16.8% of subjects reported insufficient consumption of energy, calcium, iron, vitamin A, vitamin C, and riboflavin, whereas 12.8% reported excess consumption of energy and fat.
Only vitamin B
2showed statistically significant differences
between the three groups (P = 0.016).
Body weight loss group
(n = 33, 22.1%) Body weight maintenance group
(n = 59, 39.6%) Body weight gain group
(n = 57, 38.3%) Total
(n = 149) P-value
Energy
Less than EER 31 (93.9)3) 48 (81.4) 48 (84.2) 127 (85.2) 0.2544)
Over EER 2 (6.1) 11 (18.6) 9 (15.8) 22 (14.8)
Fat
Less than 15%5) 18 (54.5) 12 (20.3) 15 (26.3) 45 (30.2) 0.0124)
15%-30% 14 (42.4) 41 (69.5) 36 (63.2) 91 (61.1)
Over 30% 1 (3.0) 6 (10.2) 6 (10.5) 13 (8.7)
Protein
Less than EAR 17 (51.5) 18 (30.5) 25 (43.9) 60 (40.3) 0.0904)
EAR-125% RNI 11 (33.3) 18 (30.5) 12 (21.1) 41 (27.5)
Over 125% RNI 5 (15.2) 23 (39.0) 20 (35.1) 48 (32.2)
Ca
Less than EAR 26 (78.8) 39 (66.1) 48 (84.2) 113 (75.8) 0.1295)
EAR-125% RNI 7 (21.2) 18 (30.5) 9 (15.8) 34 (22.8)
Over 125% RNI 0 (0.0) 2 (3.4) 0 (0.0) 2 (1.3)
P
Less than EAR 11 (33.3) 9 (15.3) 14 (24.6) 34 (22.8) 0.3384)
EAR-125% RNI 9 (27.3) 22 (37.3) 16 (28.1) 47 (31.5)
Over 125% RNI 13 (39.4) 28 (47.5) 27 (47.4) 68 (45.6)
Fe
Less than EAR 11 (33.3) 18 (30.5) 20 (35.1) 49 (32.9) 0.9404)
EAR-125% RNI 9 (27.3) 17 (28.8) 18 (31.6) 44 (29.5)
Over 125% RNI 13 (39.4) 24 (40.7) 19 (33.3) 56 (37.6)
Vitamin A
Less than EAR 18 (54.5) 30 (50.8) 30 (52.6) 78 (52.3) 0.7494)
EAR-125% RNI 7 (21.2) 10 (16.9) 14 (24.6) 31 (20.8)
Over 125% RNI 8 (24.2) 19 (32.2) 13 (22.8) 40 (26.8)
Vitamin B1
Less than EAR 11 (33.3) 14 (23.7) 17 (29.8) 42 (28.2) 0.7294)
EAR-125% RNI 10 (30.3) 15 (25.4) 14 (24.6) 39 (26.2)
Over 125% RNI 12 (36.4) 30 (50.8) 26 (45.6) 68 (45.6)
Table 6. Energy and nutrients intake levels by the weight change status of adult North Korean refugees in South Korea1,2)
Food group Body weight
loss group (n = 33, 22.1%)
Body weight maintenance group
(n = 59, 39.6%)
Body weight gain group (n = 57, 38.3%)
Total (n = 149)
P-value
Cereals 3.9 ± 1.72) 4.1 ± 1.8 3.7 ± 1.7 3.9 ± 1.7 0.4753)
Pulses, potatoes 3.2 ± 2.7 2.6 ± 2.7 2.8 ± 2.9 2.8 ± 2.7 0.5933)
Meat, eggs 1.5 ± 1.5 1.4 ± 1.7 1.4 ± 1.7 1.5 ± 1.7 0.9593)
Fishes 1.0 ± 1.2 0.7 ± 1.0 1.5 ± 2.2 1.1 ± 1.0 0.0364)
Vegetables 3.5 ± 2.7 2.7 ± 2.0 3.5 ± 3.3 3.2 ± 2.7 0.4544)
Seaweeds 2.1 ± 3.5 1.9 ± 2.5 2.4 ± 3.3 2.1 ± 3.0 0.7283)
Fruits 1.2 ± 1.8 1.3 ± 1.4 1.7 ± 2.0 1.4 ± 1.8 0.2364)
Milk and dairy products 2.5 ± 3.1 2.2 ± 3.0 2.2 ± 3.0 2.3 ± 3.0 0.8823)
Beverages 2.3 ± 2.6 2.3 ± 2.9 3.1 ± 2.8 2.6 ± 2.8 0.3063)
Alcoholic liquors 0.3 ± 0.9 0.3 ± 0.6 0.2 ± 0.5 0.3 ± 0.7 0.7893)
Other (hamburger, pizza, fried food) 0.1 ± 0.2 0.2 ± 0.4 0.2 ± 0.6 0.2 ± 0.5 0.4863)
1)Average daily food consumption frequency: calculated by weekly food consumption frequency per response rate/7
Weekly food consumption frequency: 3 times per day (21 times per week), 2 times per day (14 times per week), once per day (7 times per week), 4-6 times per week (5 times per week), 2-3 times per week (2.5 times per week), once per week (once per week), 2-3 times per month (0.58 times per week), once a month (0.23 times per week), 6-11 times per year (0.16 times per week), and rarely (0 times per week)
2)Mean ± SD
3)One-way analysis of variance
4)Kruskal-wallis test
Table 5. Food consumption frequency1) by the weight change status of North Korean refugees in South Korea
Body weight loss group
(n = 33, 22.1%) Body weight maintenance group
(n = 59, 39.6%) Body weight gain group
(n = 57, 38.3%) Total
(n = 149) P-value2)
Protein 1.38 ± 0.42 1.48 ± 0.44 1.51 ± 0.46 1.47 ± 0.44 0.371
Vitamin A 1.26 ± 1.07 1.57 ± 2.53 1.38 ± 1.27 1.43 ± 1.84 0.711
Vitamin B1 2.01 ± 1.41 1.90 ± 0.75 1.91 ± 0.71 1.93 ± 0.92 0.843
Vitamin B2 1.08 ± 0.42 1.26 ± 0.52 1.26 ± 0.58 1.22 ± 0.53 0.227
Niacin 1.11 ± 0.46 1.07 ± 0.42 1.11 ± 0.55 1.09 ± 0.48 0.894
Vitamin C 1.28 ± 1.02 1.21 ± 1.09 1.44 ± 1.88 1.31 ± 1.43 0.682
Ca 0.81 ± 0.40 0.74 ± 0.40 0.78 ± 0.36 0.77 ± 0.38 0.707
P 1.78 ± 0.49 1.70 ± 0.50 1.80 ± 0.54 1.76 ± 0.51 0.551
Fe 1.80 ± 0.66 1.68 ± 0.89 1.60 ± 0.74 1.67 ± 0.78 0.509
1)Nutrient intake amount per 1,000 kcal/recommended nutrient intake per 1,000 kcal
2)One-way analysis of variance
3)Mean ± SD
Table 7. Index of nutrient quality1) by the weight change status of adult North Korean refugees in South Korea Body weight loss group
(n = 33, 22.1%)
Body weight maintenance group (n = 59, 39.6%)
Body weight gain group (n = 57, 38.3%)
Total
(n = 149) P-value
Vitamin B2
Less than EAR 25 (75.8) 25 (42.4) 31 (54.4) 31 (54.4) 0.0164)
EAR-125% RNI 7 (21.2) 16 (27.1) 13 (22.8) 13 (22.8)
Over 125% RNI 1 (3.0) 18 (30.5) 13 (22.8) 13 (22.8)
Niacin
Less than EAR 22 (66.7) 27 (45.8) 32 (56.1) 81 (54.4) 0.3304)
EAR-125% RNI 8 (24.2) 20 (33.9) 18 (31.6) 46 (30.9)
Over 125% RNI 3 (9.1) 12 (20.3) 7 (12.3) 22 (14.8)
Vitamin C
Less than EAR 23 (69.7) 31 (52.5) 35 (61.4) 89 (59.7) 0.4904)
EAR-125% RNI 5 (15.2) 11 (18.6) 11 (19.3) 27 (18.1)
Over 125% RNI 5 (15.2) 17 (28.8) 11 (19.3) 33 (22.1)
Na6) 21 (63.6) 44 (74.6) 42 (73.9) 107 (71.8) 0.4944)
OINC7) 9 (27.3) 8 (13.6) 8 (14.0) 25 (16.8) 0.1884)
OCEF8) 1 (3.0) 9 (15.3) 9 (15.8) 19 (12.8) 0.1654)
EER, estimated energy requirement; EAR, estimated average requirement; RNI, recommended nutrient intake; OINC, overall insufficient nutrient consumption; OCEF, over consumption of energy and energy fat.
1)Energy, less than EER; fat, less than acceptable fat distribution ranges; other nutrients, less than estimates average requirements
2)Energy, over EER; fat, more than acceptable fat distribution ranges; other nutrients, over 125% recommended nutrient Intake
3)Frequency (%)
4)Chi-square test
5)Fisher's exact test
6)Intake of sodium is over goal intake (2.0 g/day)
7)Energy intake is under 75% EER, and intakes of calcium, iron, vitamin A, vitamin C, and riboflavin are under EAR
8)Intake of energy and fat is over 125% EER and adequate range Table 6. continued
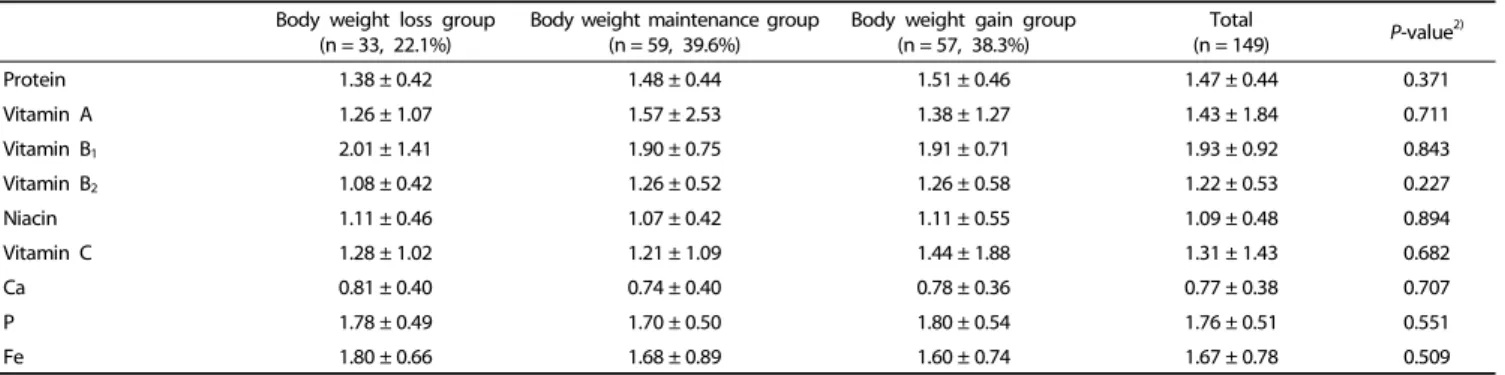
Table 7 shows the index of nutrient quality. All nutrients showed good quality with values over 1 with the exception of calcium (0.77 ± 0.38). No statistically significant differences in the index of nutrient quality were found between the three groups.
Table 8 presents the likelihood of under- or over-consumption by group adjusted for sex, age, age upon leaving North Korea, length of residence in the transient nation, length of residence in South Korea, current monthly income, current occupation, education, and marital status. Statistically significant differences in vitamin B
2and calcium were detected. The body weight loss group was five times (OR: 5.00, 95% CI: 1.51-16.52) more likely to consume an insufficient amount of vitamin B
2than the body weight maintenance group. Both the body weight loss and
body weight gain groups were four (OR: 4.04, 95% CI: 1.02- 16.00) and six times (OR: 6.03, 95% CI: 1.71-21.27), respectively, more likely to consume an insufficient amount of calcium than the body weight maintenance group. No statistical differences in energy and other nutrient consumption were observed.
DISCUSSION
This study examined changes in body weight and food
security status over the course of relocation as well as current
dietary behaviors among 149 adult North Korean refugees living
in South Korea based on NORN data. This study observed the
general trend of increasing body weight from North to South
Korea, and various body weight change patterns were found
OR 95% CI Energy
(insufficient consumption)
Body weight loss group 2.98 (0.53-16.88) Body weight maintenance group
Body weight gain group 1.39 (0.36-5.41) Protein
(insufficient consumption)
Body weight loss group 2.22 (0.73-6.80) Body weight maintenance group
Body weight gain group 2.58 (0.88-7.54) Vitamin A
(insufficient consumption)
Body weight loss group 0.72 (0.23-2.26) Body weight maintenance group
Body weight gain group 1.36 (0.49-3.82) Vitamin B1
(insufficient consumption)
Body weight loss group 1.51 (0.44-5.22) Body weight maintenance group
Body weight gain group 2.47 (0.81-7.56) Vitamin B2
(insufficient consumption)
Body weight loss group 5.00 (1.51-16.52) Body weight maintenance group
Body weight gain group 2.69 (0.97-7.48) Niacin
(insufficient consumption)
Body weight loss group 2.29 (0.77-6.83) Body weight maintenance group
Body weight gain group 1.63 (0.61-4.34) Vitamin C
(insufficient consumption)
Body weight loss group 2.00 (0.66-6.10) Body weight maintenance group
Body weight gain group 1.48 (0.57-3.96) Ca
(insufficient consumption)
Body weight loss group 4.04 (1.02-16.00) Body weight maintenance group
Body weight gain group 6.03 (1.71-21.27) P
(insufficient consumption)
Body weight loss group 3.04 (0.86-10.79) Body weight maintenance group
Body weight gain group 2.43 (0.71-8.30) Fe
(insufficient consumption)
Body weight loss group 1.77 (0.54-5.79) Body weight maintenance group
Body weight gain group 0.92 (0.32-2.61) Na4)
(over consumption)
Body weight loss group 0.61 (0.19-2.02) Body weight maintenance group
Body weight gain group 1.07 (0.33-3.47) OINC5)
(insufficient consumption)
Body weight loss group 3.02 (0.81-11.29) Body weight maintenance group
Body weight gain group 0.72 (0.19-2.79) OCEF6)
(over consumption)
Body weight loss group 0.20 (0.02-2.01) Body weight maintenance group
Body weight gain group 0.85 (0.20-3.55) OR, odds ratio; CI, confidence interval; OINC, overall insufficient nutrient consumption;
OCEF, over consumption of energy and energy fat.
1)Multinomial logistic regression
2)Dependent variable: energy and nutrients intake [reference: individuals who consumed over estimated energy requirement (EER) or estimated average requirement (EAR)], independent variable: body weight changes (reference: body weight maintenance group)
3)Covariates: sex, age, age upon leaving North Korea, length of residence in the 3rd nation, length of residence in South Korea, current monthly income, current occupation, education, and marital status
4)Individuals who consumed over intake goal (2.0 g)
5)Intake of energy is under 75% EER, and intakes of calcium, iron, vitamin A, and riboflavin are under EAR. Reference: not OINC
6)Intake of energy and fat is over 125% EER and in adequate range. Reference:
not OCEF
Table 8. Odds ratio for likelihood of under- or over-consumption of energy and nutrients by body weight change1-3) of adult North Korean refugees in South Korea
during the settlement in South Korea. During the approximately 3.5 years between the first and second examinations, 39.6% of subjects maintained their body weight while 38.6% and 22.1%
gained and lost over 3% of their body weight at the first examination, respectively. The proportion of food secure subjects increased from 12.1% in North Korea to 61.7% in South Korea. Subjects reported skipping breakfast (35.8%) and rarely eating out (57.7%). Cereals and vegetables were the most frequently consumed food groups. Energy and calcium consump- tion was somewhat lower compared to Korean. Reference Dietary Intakes, although dietary quality based on INQ was generally appropriate with the exception of calcium.
Relocation to a society with an affluent food environment has been linked to increased body weight [7,25-27], and this study obtained similar results. Adult North Korean refugees, on average, reported a body weight increase from North Korea to South Korea. In addition, this study attempted to examine body weight change patterns while adult North Korean refugees settled in South Korea. While average body weight showed a general increase, various body weight change patterns were observed. This study determined body weight gain (38.3%), maintenance (39.6%), and body weight loss (22.1%).
Among the three body weight change groups, the body weight loss group seems worthy of attention. This smallest yet diverse group was the heaviest until the first examination. It seems that weight loss took place through active engagement in some kind of weight management. This group was also significantly less food secure than the other two groups, but only a few significant differences in food and nutrient intake were found. Weight gain in this cohort was associated with metabolic syndrome [9], but the health impact of weight loss is not clear at this time. Further investigation of this body weight loss group may reveal useful information for health intervention strategies.
A previous study [28] reported that North Korean refugees suffer from poor physical and mental health due to daily instability, indicating food security in the transient nation was also poor. This study, however, found consistent improvement of food security status among adult North Korean refugees from North Korea to the transient nation and finally South Korea.
A similar finding was reported in a study on North Korean refugee mothers with young children [29]. North Korean refugees may have to undergo a meaningful dietary adaptation process during their stay in the transient nation offering a better food environment than North Korea, which would have an impact on the dietary adaptation process in South Korea. While this study population showed relatively good food and nutrient intake, more information on the dietary adaptation process in the transient nation would be useful to understand the dietary adaptation process and to develop appropriate nutrition education and counseling programs.
This study has several limitations. Random sampling of subjects was not possible since the list of North Koreans living in South Korea is classified and unavailable for security reasons.
Therefore, this study had to resort to the convenience sampling
method. The sample size of 149 may not provide sufficient
statistical power for all statistical analyses performed in this
study, however the observed statistically significant findings
indicates the statistical power was sufficient for some analyses.
Even though significant effort was invested to recruit subjects, the unique characteristics of North Korean refugees made recruitment difficult. While body weights at the first and second examinations were measured by trained staff, body weights upon leaving North Korea and entering South Korea were self-reported. North Koreans are required to go through a complete physical examination before they are allowed to enter South Korean society.
Height and weight are measured during the physical exami- nation, which allows North Koreans to learn their body weight upon entering South Korea. Possible recall bias may not be completely removed but could be minimized by the complete physical examination.
Dietary information was only collected at the second exami- nation, which made it difficult to examine longitudinal associations between dietary changes and body weight changes. It was not possible to conduct dietary assessment at the first examination.
The 24-hour recall method was conducted for one day. Conducting multiple day 24-hour recall was not possible due to financial and logistic difficulties. However, every possible effort, such as staff training and multiple visual aids, was made to improve the quality of the 24-hour recalls. Although the 24-hour recall data could be used to examine food group consumption, a food frequency questionnaire was also used to obtain usual food group consumption data that would be difficult to get from one-day 24-hour recall data.
This study is one of the first to report changes in body weight and food security of adult North Korean refugees since they left North Korea. The strength of this study is its meaningfully long time period. This study examined subjects who left North Korea an average of longer than 10 years ago and had lived in South Korea for approximately 7 years. The follow-up time between the first and second examinations was 3.4 years. These time periods are longer than those of previous studies [14-16,29].
In addition, use of measured body weight, albeit only at the first and second examinations, is an important strength.
This study carefully examined changes in body weight and food security status among adult North Korean refugees. A large cohort study collecting dietary information at several time points along with body weight and other health information would be needed to further understand the relationships between adaptation, diet, body weight, and health.
ACKNOWLEDGEMENT
The authors express sincere appreciation to all participants and collaborators in the Seoul North Hana Center who helped recruitment. LSK also thank SY Nam, SH Kim, JY Kim and undergraduate students who participated in data collection.
REFERENCES
1. Chang NS, Hwang JY. Food shortage, nutritional deprivation, and reduced body size in North Korean defectors. Korean J Nutr 2000;33:540-7.
2. Ministry of Unification (KR). Policy for North Korean refugees [Internet].
Seoul: Ministry of Unification; 2016 [cited 2016 September 9].
Available from: http://www.unikorea.go.kr/content.do?cmsid=3099.
3. Haggard S, Noland M. Witness to Transformation: Refugee Insights into North Korea. Washington, D.C.: Peterson Institute for International Economics; 2011.
4. Seo SH, Lee EJ, Kim JW. Nutrition transition in Korea and other countries. J Korea Elem Educ 2008;19:31-55.
5. Kim HR. Overview of the nutritional status and policy directions of supporting children’s nutrition in North Korea. Health Welf Policy Forum 2007;132:24-34.
6. Food and Agriculture Organization of the United Nations;
International Fund for Agricultural Development; World Food Programme. The State of Food Insecurity in the World: Meeting the 2015 International Hunger Targets: Taking Stock of Uneven Progress. Rome: Food and Agriculture Organization of the United Nations; 2015.
7. Goel MS, McCarthy EP, Phillips RS, Wee CC. Obesity among US immigrant subgroups by duration of residence. JAMA 2004;292:
2860-7.
8. Kim HR. Multi-cultural families of health problems and counter policies in Korea. Health Welf Issue Focus 2013;185:1-8.
9. Cho M, Kim JH, Kim HY, Seo JA, Kim NH, Choi KM, Lee WJ, Yohan L, Baik SH, Choi DS, Kim SG. Weight gain and the risk of metabolic syndrome among North Korean refugees living in South Korea.
Diabetes Obes Metab 2010;12:56.
10. International Organization for Migration. Handbook on Direct Assistance for North Korean Migrants. Geneva: International Organization for Migration; 2014. p.50-1.
11. Hwang JY, Chang NS. Dietary patterns and nutrient intake in North Koreans by utilizing literature search and survey. Korean J Community Nutr 2001;6:371-9.
12. Lee EJ, Pei YQ, Kim EM. A survey of the adaptation and preference for South Korean food in North Korean refugees. Korean J Culinary Res 2013;19:93-110.
13. Kim MJ. Past and present food intake of North Korean defectors using food frequency questionnaire [master’s thesis]. Seoul:
Hanyang University; 2015.
14. Choi SK, Park SM, Joung H. Still life with less: North Korean young adult defectors in South Korea show continued poor nutrition and physique. Nutr Res Pract 2010;4:136-41.
15. Lee SK, Nam SY. Comparison of food and nutrient consumption status between displaced North Korean children in South Korea and South Korean children. Korean J Community Nutr 2012;17:
407-18.
16. Choe MA, Yi M, Choi JA, Shin G. Health knowledge, health promoting behavior and factors influencing health promoting behavior of North Korean defectors in South Korea. J Korean Acad Nurs 2012;42:622-31.
17. Lee YH, Lee WJ, Kim YJ, Cho MJ, Kim JH, Lee YJ, Kim HY, Choi DS, Kim SG, Robinson C. North Korean refugee health in South Korea (NORNS) study: study design and methods. BMC Public Health 2012;12:172.
18. World Health Organization Western Pacific Region; International Association for the Study of Obesity; International Obesity Task Force. The Asia-Pacific Perspective: Redefining Obesity and Its Treatment. Sydney: Health Communications Australia Pty Limited;
2000.
19. Stevens J, Truesdale KP, McClain JE, Cai J. The definition of weight maintenance. Int J Obes (Lond) 2006;30:391-9.
20. Coates J, Swindale A, Bilinsky P. Household Food Insecurity Access Scale (HFIAS) for Measurement of Food Access: Indicator Guide.
Washington, D.C.: Food and Nutrition Technical Assistance Project;
2007.
21. Ministry of Health and Welfare, Korea Centers for Disease Control and Prevention. Korea Health Statistics 2010: Korea National Health and Nutrition Examination Survey (KNHANES V-1). Cheongwon:
Korea Centers for Disease Control and Prevention; 2011.
22. The Korean Nutrition Society. CAN-Pro 5.0 (Web ver.) [Internet].
Seoul: The Korean Nutrition Society; 2015 [cited 2016 July 10].
Available from: http://canpro5.kns.or.kr.
23. Ministry of Health and Welfare (KR); The Korean Nutrition Society.
Dietary Reference Intakes for Koreans 2015. Sejong: Ministry of Health and Welfare; 2016. p.2-23.
24. Yoon IJ, Kim SK. Health and medical care of North Korean defectors
in South Korea. Health Soc Sci 2005;17:149-82.
25. Delavari M, Sønderlund AL, Swinburn B, Mellor D, Renzaho A.
Acculturation and obesity among migrant populations in high income countries--a systematic review. BMC Public Health 2013;13:
458-69.
26. Oza-Frank R, Cunningham SA. The weight of US residence among immigrants: a systematic review. Obes Rev 2010;11:271-80.
27. Singh GK, Siahpush M, Hiatt RA, Timsina LR. Dramatic increases in obesity and overweight prevalence and body mass index among ethnic-immigrant and social class groups in the United States, 1976-2008. J Community Health 2011;36:94-110.
28. Yoon IJ. Acculturation and social adaptation of North Korean migrants. Korean Stud J 2012;41:37-61.
29. Lee SK, Nam SY. Food security experiences of displaced North Korean households. Nutr Res Pract 2014;8:198-204.