INTRODUCTION
Diet is the greatest factor in lifestyle and has a direct and positive relation with health (Farhud & Dariush D 2015). Poor diet like using fast foods and its consequences like obesity and cardiovascular is the common healthy problem in socie- ties (Mozaffarian D et al 2011). In the case of pregnant women, most of them experience distinctive changes in appetite and food preference and encounter a great deal of difficulties in leading a desirable dietary life owing to the morning sickness that affects food intake (Han MH 2014). In addition, their nutritive conditions during pregnancy are closely connected with the development of fetuses and infants, and thus may have an effect on maternal health and prenatal development, as well as even on baby health after birth (Thompson JM et al 2010). Accordingly, having a proper dietary life is critical during (Lee JA et al 2004). However, it has been recently reported that a considerable number of females at childbearing age in Korea are underweight, overweight and short of certain nutrients (Bae HS 2006), and that there is a growing tendency of high-risk pregnancy that hampers pregnancy maintenance and prenatal development
(Choi JH et al 2006; Lee SH et al 2006). In this regard, it is required to explore a proper dietary life of pregnant women.
Consumers who purchase foods have a choice of them by relying on minimal amounts of information attached on the product indications, and perform individually purchasing behaviors because of belief that the foods will satisfy their preferences as much as possible in terms of taste and nutrition (Lee EB 2013). In accordance with studies for food choice attributes, Wadolowska L et al (2008) divided them into the following figures: they include advertisement, functionality, health, price, senses and socio-cultural factors. Also, Connors M et al (2001) revealed that the factors most closely associ- ated with food choice were time, taste, health, cost and social relationship. These attributes were also used in studies conducted aimed at Greece (Fotopoulos C et al 2009), Uruguay (Ares G & Gambaro A 2007), Austria (Lockie S et al 2001) and Finland (Lindeman M & Vaananen M 2000).
Maternal dietary habits can immediately affect the growing fetus, and awareness has grew during recent years that maternal diet may affect the result of pregnancy also the long term health of the child (Godfrey KM & Barker DJ 2001;
Kind KL et al 2006). The dietary guidelines are established according to scientific evidences for the relation between nutritive conditions and health, and provide the people with
Structural Equation Model of Dietary Style and Dietary Guidelines for Pregnant Women
Young Il Park, Eun-Kyung Jung and Nami Joo
†Dept. of Food & Nutrition, Sookmyung Women's University, Seoul 04310, Republic of Korea
ABSTRACT
This study was conducted to analyze the effects of the dietary style of pregnant women according to their food choice attributes based on their level of adherence to dietary guidelines by establishing a structural equation model (SEM) for the relationship between food choice attributes and dietary guidelines compliance. Surveys were assembled from July to August 2017 and a statistical analysis of the 215 responses was conducted. The outcomes of factor analysis of dietary style, food choice attributes and level of adherence to dietary guidelines of pregnant women resulted in their being categorized into five, one and four categories, respectively. The evaluation model of the confirmatory factor test was also confirmed to be valid since the results produced the values of χ
2=408.785, ICFI=0.915, GFI=0.905, FI=0.922, NFI=0.832, AGFI=0.831, RMSEA=0.058 and RMR=0.045, which was acceptable, and certified the appropriateness of the model. In an effort to study the food choice attributes in conformity with the dietary style and level of adherence to dietary guidelines of pregnant women, a SEM was composed and examined. All tests indicated that the model met the offered levels for the fit index’s goodness, and therefore, the all study model have proven to be suitable.
Key words: pregnant women, dietary style, dietary guideline, food choice, nutrition status
†
Corresponding author : Nami Joo, Tel: +82-2-710-9471, Fax: +82-
2-710-9479, E-mail: [email protected]
essential dietary principles based on foods to be easily understood and applied to their actual lives so that they can maintain health and prevent diseases (Yoon SY 2009). To help women accomplish a nutritionally sufficient diet during pregnancy, most countries have dietary guidelines that re- commend the number of daily servings that should be con- sumed from each of the core food groups (NHMRC 2010;
USDA 2010). The dietary guidelines for breast-feeding and pregnant women were designed to reflect their health-nutrition problems and dietary traits investigated by the national health and nutrition examination survey on the basis of the dietary goals and overall guidelines for Koreans (Jang YA et al 2008;
Ministry of Health & Welfare 2018).
Accordingly, the present study was conducted to analyze the dietary patterns during pregnancy, and provide basic materials for desirable dietary life and nutrition education by developing a model for food choice attributes of dietary life and the level of compliance to dietary guidelines for pregnant women.
SUBJECTS AND METHOD
1. Subjects
The sample populations are participants at three times of
“Symposium about baby nursing for pregnant women” in Seoul from July to August 2017. The questionnaires were distributed to 270 people, and 215 usable responses were obtained, giving a response rate of 79.6%. Expected com- pletion time for the survey was 30 ∼45 min in compliance with responses offered, and did not limit time for survey completion. Survey instruments, protocols, and the procedure for acquiring informed consent for this research were con- sented by the institutional review committees (SMWU- 1707-HR-064). Information about the study was offered and consent was got from all participants before completing the survey questionnaire. The 109 (50.7%) pregnant women were over 30 weeks pregnant period and 84 (39.1%) pregnant women were 20 ∼29 weeks pregnant period. Most of them (74.0%) had morning sickness and 26% of them had not morning sickness.
2. Questionnaire
The questionnaire for dietary style was composed of 20 items with reference to related previous studies (Kim KH
2005; Grunert K et al 2011; Yoon HR et al 2016) and consisted of 5 items on food choice attributes (Lockie S et al 2001; Wadolowska L et al 2008; Fotopoulos C et al 2009).
The questionnaire pregnant women’s level of adherence to dietary guidelines was composed with ‘Dietary action guide for pregnant and lactating women’ (Jang YA et al 2008;
Ministry of Health & Welfare 2018) and consisted of 18 items evaluated with 5-point Likert scale.
3. Research Hypotheses
A SEM was used to investigate the effect of pregnant women's dietary styles on their food selection attributes and the level of compliance with the dietary guidelines.
Hypothesis 1. Dietary style will be substantially different depending on the food choice attributes.
Hypothesis 2. Food choice attributes will be substantially dissimilar depending on the level of adherence to dietary guidelines.
Hypothesis 3. Dietary style will be substantially different depending on the level of compliance to dietary guidelines.
4. Statistical Analysis
The assembled data were evaluated with SPSS 21.0 for Windows and AMOS (Analysis of Moment Structure) 22.0 Statistical programs. Exploratory factor and reliability tests were executed for estimation the unidimensionality of multiple items that contained of each factor. After assessing the validity of the measurement items by conducting confirmatory factor analysis, SEM (structural equation model) was used to find out the path coefficients of the study model.
RESULTS
1. Exploratory Factor Test on Measurement Models
1) Dietary Style of Pregnant Women
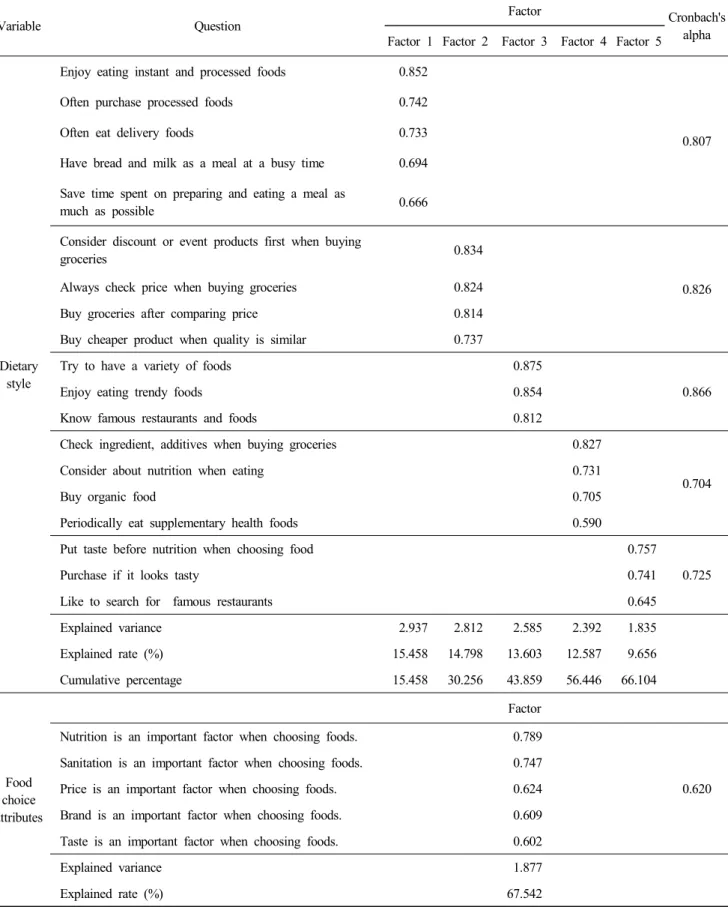
According to the results of exploratory factor analysis (EFA) on dietary style items, 5 factors were extracted (Table 1). The coefficients of Cronbach’s alpha indicated a reliability of 0.807, 0.826, 0.866, 0.704 and 0.725. and explanatory power was 66.104%. Factor 1 was called ‘Convenience orien- ted’, factor 2 ‘Economy oriented’, factor 3 ‘Trend oriented’
factor 4 ‘Healthy oriented’, and factor 5 ‘Gourmet oriented’.
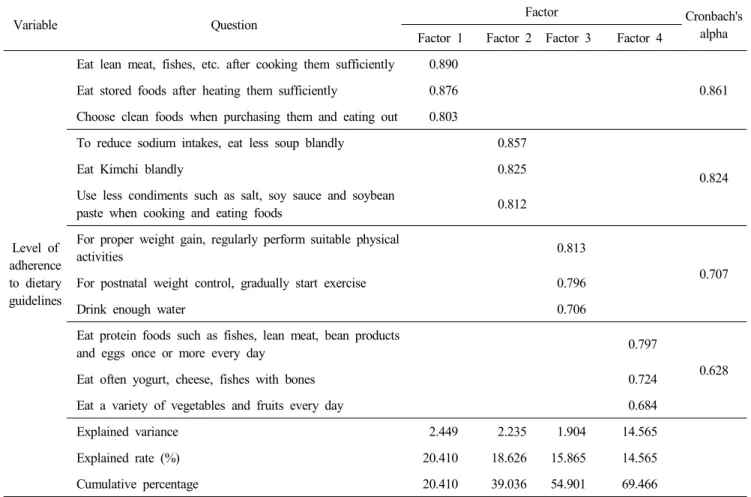
Table 1. Explorative factor analysis on dietary style, food choice attributes and level of adherence to dietary guidelines of pregnant women
Variable Question
Factor
Cronbach's alpha Factor 1 Factor 2 Factor 3 Factor 4 Factor 5
Dietary style
Enjoy eating instant and processed foods 0.852
0.807
Often purchase processed foods 0.742
Often eat delivery foods 0.733
Have bread and milk as a meal at a busy time 0.694 Save time spent on preparing and eating a meal as
much as possible 0.666
Consider discount or event products first when buying
groceries 0.834
0.826
Always check price when buying groceries 0.824
Buy groceries after comparing price 0.814
Buy cheaper product when quality is similar 0.737
Try to have a variety of foods 0.875
0.866
Enjoy eating trendy foods 0.854
Know famous restaurants and foods 0.812
Check ingredient, additives when buying groceries 0.827
0.704
Consider about nutrition when eating 0.731
Buy organic food 0.705
Periodically eat supplementary health foods 0.590
Put taste before nutrition when choosing food 0.757
0.725
Purchase if it looks tasty 0.741
Like to search for famous restaurants 0.645
Explained variance 2.937 2.812 2.585 2.392 1.835
Explained rate (%) 15.458 14.798 13.603 12.587 9.656
Cumulative percentage 15.458 30.256 43.859 56.446 66.104
Food choice attributes
Factor Nutrition is an important factor when choosing foods. 0.789
0.620 Sanitation is an important factor when choosing foods. 0.747
Price is an important factor when choosing foods. 0.624 Brand is an important factor when choosing foods. 0.609 Taste is an important factor when choosing foods. 0.602
Explained variance 1.877
Explained rate (%) 67.542
2) Food Choice Attributes of Pregnant Women The results of the food choice attributes items as deter- mined by the EFA are showed in Table 1. The items were named ‘Nutrition’, ‘Sanitation’, ‘Price’, ‘Brand’ and ‘Taste’.
Reliability and validity were established by 0.620 of Cron- bach’s alpha, and 67.542% of the explain power for the factors on the food choice attributes.
3) Level of Adherence to Dietary Guidelines of Preg- nant Women
Table 1 describes the results of the 12 items of level of adherence to dietary guidelines as implied by the EFA. Four factors were certified and explained 69.466% of the results. The Cronbach's alpha reliability coefficients for factors 1 (0.861), 2 (0.824), 3 (0.707) and 4 (0.628) named ‘Sanitary’, ‘Sodium intake', ‘Life habit’ and ‘Body composition food intake’.
2. Correlation Analysis
The results imply that multicollinearity was not a problem
with most variables since the highest correlation coefficient was 0.542 (Table 2). The highest expected correlation was between ‘Trend oriented’ and ‘Gourmet oriented’ (r=0.542, p<0.01), followed ‘Sodium intake’ and ‘Life habit’ (r=0.340, p<0.01), ‘Convenience oriented’ and ‘Gourmet oriented’ (r=
0.31, p<0.01) and ‘Trend oriented’ and ‘Food choice attri- butes’ (r=0.316, p<0.01).
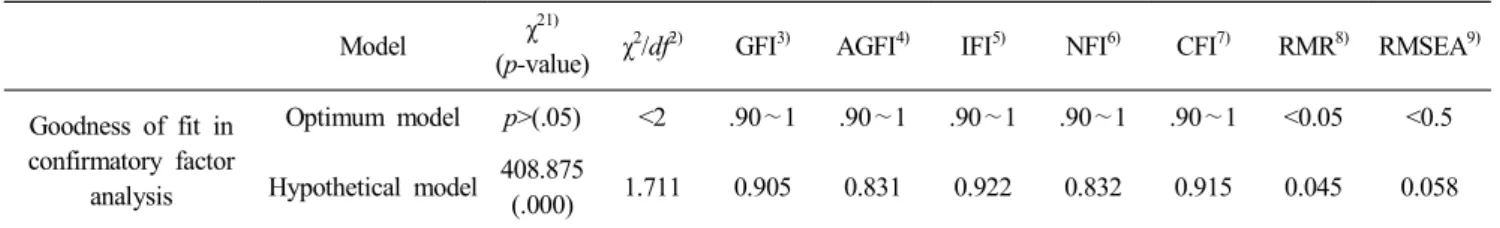
3. Confirmatory Factor Analysis on the Measurement Model
The confirmatory factor analysis for the measurement model are indicated in Table 3. Goodness-of-fit index results for the model are approved level for each index. And the model was verified as suitable due to the optimal results showed the values of χ
2=408.785, GFI=0.905, CFI=0.915, IFI=0.922, NFI=0.832, RMR=0.045, AGFI=0.831 and RMSEA=
0.058, which accepted the suggested standards, and also certified the appropriateness of the model as well.
As a result of evaluating the convergent validity based on Table 1. Continued
Variable Question
Factor Cronbach's
alpha Factor 1 Factor 2 Factor 3 Factor 4
Level of adherence to dietary guidelines
Eat lean meat, fishes, etc. after cooking them sufficiently 0.890
0.861 Eat stored foods after heating them sufficiently 0.876
Choose clean foods when purchasing them and eating out 0.803
To reduce sodium intakes, eat less soup blandly 0.857
0.824
Eat Kimchi blandly 0.825
Use less condiments such as salt, soy sauce and soybean
paste when cooking and eating foods 0.812
For proper weight gain, regularly perform suitable physical
activities 0.813
0.707 For postnatal weight control, gradually start exercise 0.796
Drink enough water 0.706
Eat protein foods such as fishes, lean meat, bean products
and eggs once or more every day 0.797
0.628
Eat often yogurt, cheese, fishes with bones 0.724
Eat a variety of vegetables and fruits every day 0.684
Explained variance 2.449 2.235 1.904 14.565
Explained rate (%) 20.410 18.626 15.865 14.565
Cumulative percentage 20.410 39.036 54.901 69.466
the standardized regression coefficient value after the mea- surement model‘s confirmatory factor analysis, the following variables among those of dietary patterns were eliminated:
‘Have bread and milk as a meal at a busy time’, ‘Save time spent on preparing or eating a meal as much as possible’,
‘Buy organic foods’, ’Periodically eat supplementary health foods’, and ‘Put taste before nutrition when choosing food’.
For the level of adherence to dietary guidelines, the following factors were eliminated because they failed to meet the standard value: ‘Drink enough water’, ‘Eat protein foods such as fish, lean meat, bean product and egg once or more every day’, ‘Often eat yogurt, cheese, fish with bones’, and ‘Eat a
diversity of fruits and vegetables every day’, and thus the
‘Body composition food intake factors’ were removed.
Consequently, the validity of the measurement model was secured. The t (C.R.) value for the standardized factor value of measured variables was found to be significant by exceeding generally 2.88 (<0.05), and the factor loading was also shown to be generally 0.5 or more. Accordingly, it is considered that the proposed models in this study meet generally the sample data. In addition, the concept reliability was generally 0.7 or more and the AVE was found to be generally 0.5 or more, thus the convergent validity was confirmed.
Table 2. Correlation analysis for variables of pregnant women
Variables
1)A B C D E F G H I J
A 1.0000
B 0.070 1.0000
C 0.297
**0.117 1.0000
D —0.084 —0.104
*—0.119 1.0000
E 0.317
**—0.006 0.542
**0.184
**1.0000
F 0.018 0.291
**0.316
**0.156
**0.279
**1.0000
G —0.285
**0.075 0.055 0.246
**0.117 0.215
**1.0000
H —0.218
**—0.038 0.056 0.259
**—0.006 0.114 0.136
**1.0000
I —0.214
**—0.029 0.135
*0.243
**0.034 0.115 0.150
**0.340
**1.0000
J —0.315
**—0.047 0.046 0.297
**—0.003 0.030 0.309
**0.266
**0.272
**1.0000
1)
A: Convenience oriented, B: Economy oriented, C: Trend oriented, D: Health oriented, E: Gourmet oriented, F: Food choice attributes, G: Sanitary, H: Sodium intake, I: Life habit, J: Body composition food intake.
*
p<0.05,
**p<0.01.
Table 3. Goodness of fit in confirmatory factor analysis and hypothetical model fit index of pregnant women
Model χ
21)(p-value) χ
2/df
2)GFI
3)AGFI
4)IFI
5)NFI
6)CFI
7)RMR
8)RMSEA
9)Goodness of fit in
confirmatory factor analysis
Optimum model p>(.05) <2 .90 ∼1 .90 ∼1 .90 ∼1 .90 ∼1 .90 ∼1 <0.05 <0.5 Hypothetical model 408.875
(.000) 1.711 0.905 0.831 0.922 0.832 0.915 0.045 0.058
1)
χ
2: Chi-square.
2)
χ
2/df: Chi-square divided by degree of freedom.
3)
GFI: Goodness of fit index.
4)
AGFI: Adjusted goodness of fit index.
5)
IFI: Incremental fit index.
6)
NFI: Normed fit index.
7)
CFI: Comparative fit index.
8)
RMR: Root mean residual.
9)
RMSEA: Root means squared error of approximation.
4. The Measurement Model’s Fit Test
The results of hypothetical model fit shows as χ
2=423.837, IFI=0.917, CFI=0.915, GFI=0.872, AGFI=0.828, NFI=0.826, RMSEA=0.059 and RMR=0.049 (Table 4). Although the χ
2value was unveiled to be inadequate, the current hypothetical model in Fig. 1 was identified to be adequate since the other indices like CMIN/DF, IFI, CFI and RMR were revealed to be appropriate, and GFI, GFI, AGFI and NFI satisfied the suggested standards.
DISCUSSION
This study analyzes the effects of the dietary style of pregnant women according to their food choice attributes on their level of compliance dietary guidelines through the construction of a model on the relationship between food choice attributes and level of adherence to dietary guidelines.
The results of testing Hypothesis 1: For the food choice attributes by dietary pattern, those were found to be not
Table 4. Hypothetical model fit index of pregnant women
Model χ
21)(p-value) χ
2/df
2)GFI
3)AGIF
4)IFI
5)NFI
6)CFI
7)RMR
8)RMSEA
9)Goodness of fit criteria p>(.05) <2 .90 ∼1 .90 ∼1 .90 ∼1 .90 ∼1 .90 ∼1 <0.05 <0.5
Hypothetical model 423.837
(0.000) 1.752 0.872 0.828 0.917 0.826 0.915 0.049 0.059
Result Unfit Fit Acceptable Acceptable Fit Acceptable Fit Fit Unfit
1)
χ
2: Chi-square.
2)
χ
2/df: Chi-square divided by degree of freedom.
3)
GFI: Goodness of fit index.
4)
AGFI: Adjusted goodness of fit index.
5)
IFI: Incremental fit index.
6)
NFI: Normed fit index.
7)
CFI: Comparative fit index.
8)
RMR: Root mean residual.
9)