Estimation of Gastrocnemius Muscle Volume Using Ultrasonography in Children with Spastic Cerebral Palsy
Eun Sook Park, Eungeol Sim, Dong-Wook Rha, and Soojin Jung
Department of Rehabilitation Medicine, Severance Hospital, Research Institute of Rehabilitation Medicine, Yonsei University College of Medicine, Seoul, Korea.
Received: May 28, 2013 Revised: October 15, 2013 Accepted: November 5, 2013 Corresponding author: Dr. Soojin Jung, Department of Rehabilitation Medicine, Severance Hospital,
Research Institute of Rehabilitation Medicine, Yonsei University College of Medicine, 50-1 Yonsei-ro, Seodaemun-gu, Seoul 120-752, Korea.
Tel: 82-2-2228-3723, Fax: 82-2-363-2795 E-mail: [email protected]
∙ The authors have no financial conflicts of interest.
© Copyright:
Yonsei University College of Medicine 2014 This is an Open Access article distributed under the terms of the Creative Commons Attribution Non- Commercial License (http://creativecommons.org/
licenses/by-nc/3.0) which permits unrestricted non- commercial use, distribution, and reproduction in any medium, provided the original work is properly cited.
Purpose: This study aimed to investigate useful parameters for estimating gastroc- nemius (GCM) muscle volume (MV) using ultrasonography (US) and anthropom- etry in children with spastic cerebral palsy (CP). Materials and Methods: Eigh- teen legs from nine children with spastic CP aged 2 to 6 years were investigated in this study. Tibial length (TL) of each leg was measured and muscle thickness (MT) and anatomical cross-sectional area (aCSA) of GCM muscles were assessed using US. The volume of the GCM was measured by magnetic resonance imaging (MRI) scans. The relationship of TL, MT, and aCSA with MV measured by MRI was investigated. Simple and multiple regression analyses were performed to es- tablish muscle volume prediction equations. Results: Resting MT, aCSA, and TL were highly related to MV of both medial and lateral head of GCM determined by MRI. The MV prediction equation based on simple regression analysis resulted in r2 values ranging from 0.591 to 0.832 (p<0.05). The r2 values were higher using aCSA as independent variable than using MT. The MV prediction equation based on multiple regression analysis resulted in r2 values ranging from 0.779 to 0.903 (p<0.05). However, the relatively high standard error of the estimate values ranged from 18.0--33.6% on simple regression and 15.5--25.6% on multiple regression.
The contribution of aCSA was higher than that of MT for predicting MV of GCM.
Conclusion: Our study demonstrated the suitability of US assessment of aCSA and MT combined with TL for estimating MV of GCM in children with spastic CP and showed that aCSA is more useful parameter than MT.
Key Words: Gastrocnemius muscle, volume, ultrasound imaging, magnetic reso- nance imaging, cerebral palsy
INTRODUCTION
Cerebral palsy (CP) describes a group of disorders affecting the development of movement and posture, and thus limiting activity, that are attributed to non-pro- gressive disturbances in the developing fetal or infant brain.1 According to pub- lished literature, there is consistent evidence for a reduction of muscle volume (MV) in paretic limbs of children with CP, compared with both non-paretic limbs of children with CP and limbs of typically developing peers.2 Deficits in MV in
Equinus foot is the most common deformity in children with spastic CP, and thus, the gastrocnemius (GCM) mus- cle is the most common target for botulinum toxin injec- tion. The optimal dose of the toxin may be related to MV.
Recently, muscle architectural changes after toxin injection have become an interesting issue with respect to the influ- ence of the toxin on growth in muscle volume.29-31 Never- theless, the suitability of 2D B-mode US for MV estimation of the GCM in children with spastic CP has not been inves- tigated. Therefore, the aim of this study was to investigate the application of US and identify useful parameters for the prediction of GCM MV in children with spastic CP.
MATERIALS AND METHODS
Participants
Children with spastic CP who were admitted or visited our out-patient clinic from January 2010 to May 2012 were re- cruited for this study upon fulfilling the following inclusion criteria: 1) children with spastic cerebral palsy, 2) Gross Motor Function Classification System (GMFCS) level I to IV, and 3) age of 2 to 6 years. The exclusion criteria were as follows: 1) previous history of GCM muscle trauma, 2) combined with muscular disease, 3) previous history of sur- gical intervention of lower extremity, 4) any metal implant in the body, or 5) chemodenervation therapy within 6 months.
Ethical approval was granted by the Institutional Review Board and ethics committee of Severance Hospital (# 4-2009- 0650). As all the children in this study were younger than 18 years, informed consent was obtained from their parents for participation in the study.
Ultrasound measurements
US images of the GCM were taken by a physiatrist using 2D B-mode and real-time ultrasonography (ACCUVIX V10 system, Samsung Medison Co, Seoul, Korea) with a linear- array probe (5 to 12 MHz).
The subjects were positioned prone on the examination table with their feet hanging over the edge of the table. US images over the muscle belly of both medial and lateral heads of GCM muscles were taken in a resting ankle posi- tion. For image acquisition, the ultrasound probe was trans- versely positioned on the skin with minimal compression.
US images were obtained following the recommendations of Bénard, et al.32 in order to minimise measurement error.
children with spastic CP may increase as they grow older.3 MV is a good predictor of maximal force generating ca- pacity,4-9 and accordingly, the lack of growth in muscle vol- ume may contribute to muscle weakness, which may in turn be related to functional limitations in these children.10,11 A previous report suggested that measurement of muscle size may be an alternative measure of quantitative muscle evaluation for people with severe CP in whom direct mea- surement of muscle strength is difficult.11 In this context, measurement of MV in a clinical setting would seem to be useful as a means of selection for intervention and for de- lineating the consequences of interventions, such as botuli- num toxin injection or strengthening exercises, on muscle volume.12,13
Previous attempts were made to estimate MV using an- thropometric data,14,15 as well as by magnetic resonance im- aging (MRI), computed tomography (CT), and ultrasonogra- phy (US); CT and MRI are considered the “gold standards”
of MV measurement.16,17 More recently, three-dimensional (3D) US was shown to be a valid and reliable measurement of muscle volume.18-20 However, two-dimensional bright- ness mode (2D B-mode) US can be used to produce high- quality images of muscle morphology, and has the same ad- vantages as MRI in distinguishing between muscle and fat tissues.17 Moreover, 2D B-mode US is simple and easy to perform and requires less time for analysis, compared with MRI, CT, and 3D US. Consequently, 2D B-mode US is commonly used to measure muscle size, such as anatomical cross-sectional area (aCSA) and muscle thickness (MT). In the published literature, measurement of aCSA and MT us- ing 2D US exhibited excellent reliability in evaluating chil- dren and adolescents with CP.21,22 Additionally, there have been some attempts to estimate MV based on parameters obtained from 2D US scan images.23-27 MV prediction equa- tions have been developed based on MT measurement us- ing US and measured tibial length against muscle weight of cadaveric human legs23,24 or MV measured by MRI in healthy adults.25-27 The results of such studies suggest that MT measurement using US is reliable and useful for esti- mating MV.25-28
Anatomical CSA of a muscle is one of several muscle ar- chitecture parameters that are closely related to maximum muscle strength. According to Blazevich, et al.,6 aCSA is the second-best predictor of maximal muscle torque. How- ever, MV estimation using aCSA measured from a single US scan image has not yet been investigated in children with cerebral palsy.
ing the measured muscle volume as the criterion. In multi- ple regression analysis, each independent variable was calculated as an index representing its relative contribution to estimating the measured muscle volume. Contribution was calculated by partial r2. The SEE was calculated using the equation SD diff /√2, where SD diff is the standard de- viation of the difference scores between the estimated and measured muscle volume. The SEEs were expressed as ab- solute values and values relative to the measured muscle volume.
RESULTS
Characteristics of participants
Nine children with bilateral involvement spastic CP (six boys and three girls; mean age±SD, 3.8±1.5 years, range, 2--6 years) were included in this study. The distribution of GM- FCS was as follows: Level I (n=5), Level II (n=1), Level III (n=1), and Level IV (n=2). Only one patient had received BoNT-A injection within 6 months before the study.
In total, 18 lower limbs were evaluated. For anthropomet- ric measurements, TL was measured from the lateral knee- joint line to the most prominent point of the lateral malleo- lus. Mean TL was 19.9±2.7 cm (range 17.1--25.0 cm).
Muscle volume, thickness and cross-sectional area The MV of GCM measured by MRI was 19.70±9.29 cm3 (range; 7.18--38.95 cm3) for the medial head and 11.92±
9.12 cm3 (range; 4.14--28.05 cm3) for the lateral head. The MT of GCM muscles measured using US was 0.99±0.27 cm (range; 0.48--1.31 cm) for medial head and 0.82±0.20 The ultrasound probe was centred on the mid-longitudinal
axis, at 25% of the tibial length from the popliteal fossa. Ul- trasound images were taken over a range of tilt and rotation angles of the ultrasound probe at 5° increments. Tilt and ro- tation are expressed as deviations from the longitudinal ori- entation perpendicular to the skin for all conditions. This was performed three times for each muscle by the same in- vestigator to obtain images of maximal MT.
MT was defined as the longest distance between the up- per muscular fascia and the lower muscular fascia visible on the image. Anatomical CSA represents the cross-section perpendicular to the longitudinal axis of a muscle, and is defined as the area surrounded by the upper muscular fas- cia, the lower muscular fascia, and the intramuscular sep- tum.33 We calculated anatomical CSA using the same image of maximal MT. Fig. 1 shows an example of imaging mea- surement of MT and aCSA.
GCM volume measurement by MRI
The entire GCM muscle was imaged using axial, gapless, T1-weighted sequences. MR images were viewed and pro- cessed using OsiriX® software (version 3.6.1, University Hospital of Geneva, Switzerland, 32-bit, http://www.osirix- viewer.com). The MRI images were obtained in the resting ankle position. Volumetry of the GCM muscle was per- formed manually. A physiatrist manually outlined the junc- tion of the GCM muscle fascia and intermuscular septum, first cranially and then caudally, in the axial image stack.
OsiriX® was used to calculate the GCM muscle volume by multiplying all outlined areas of the slices by the slice thick- ness.8
Statistical analysis
Univariate analysis was performed to determine the corre- lation between muscle volume of medial and lateral heads of the GCM and the TL, MT, or aCSA using Pearson corre- lation analysis. Simple and multiple regression analyses were performed using muscle volume measured by MRI as the dependent variable and [π×(MT/2)2×TL] or (CSA×TL) as the independent variables. Multiple regression analyses were also performed using TL, MT, and aCSA as indepen- dent variables. Using the established muscle-volume pre- diction equations, the muscle volume for medial and lateral heads of the GCM muscle was calculated for each leg. To assess the criterion validity of the equations in predicting the measured muscle volume, the standard error of the esti- mate (SEE) and validity correlation (r2) were calculated us-
Fig. 1. Ultrasonographic measurement of muscle thickness and anatomical cross-sectional area. Muscle thickness (MT): the longest distance between the upper muscular fascia and the lower muscular fascia. Anatomical cross- sectional area (aCSA): the area surrounded by the upper muscular fascia, the lower muscular fascia, and the intramuscular septum.
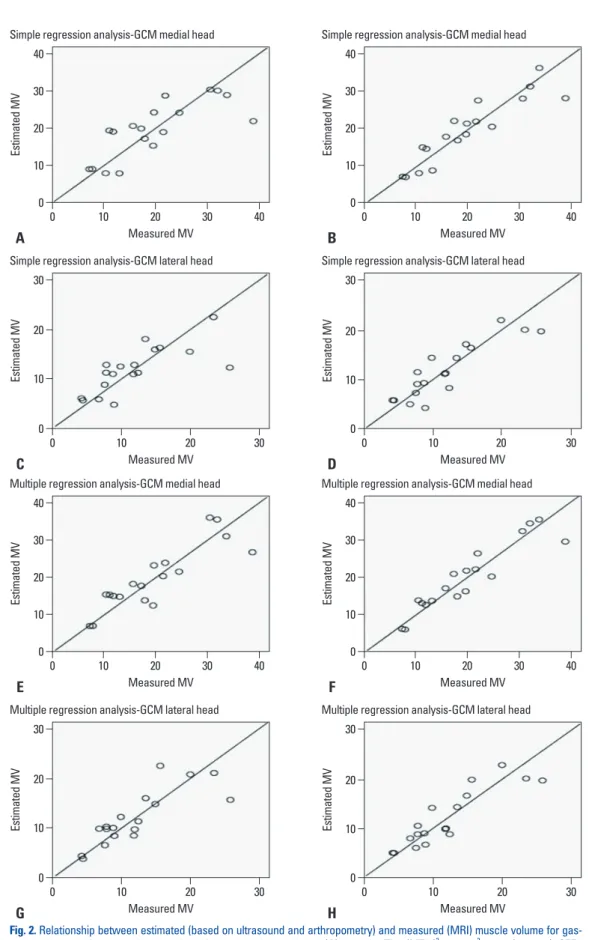
SEE values of the equations were 3.5 cm2 (18.0%) and 2.6 cm2 (21.6%) (Table 2). The relationship between estimated and measured MV using simple regression analysis of chil- dren with cerebral palsy is shown in Fig. 2.
Multiple regression analysis
Multiple regression analysis revealed that MT, aCSA, and TL were significant contributors to the prediction of MV measured by MRI. The muscle volume prediction equa- tions based on multiple regression analyses are given in Ta- ble 3. The final equation based on multiple regression analy- sis using two independent variables of TL and MT resulted in r2=0.831 (p<0.05) for medial heads and r2=0.779 (p<0.05) for lateral heads. Based on this equation, the relative contri- bution of MT to the variation in MV measured by MRI was 20.1% for the medial head and 18.8% for the lateral head.
The final equation based on multiple regression analysis using two independent variables of TL and aCSA resulted in r2=0.903 (p<0.05) for medial heads and r2=0.858 (p<0.05) for lateral heads. Based on this equation, the relative contri- bution of aCSA to the variation in MV measured by MRI was 65.6% for the medial head and 67.8% for the lateral head (Table 3).
DISCUSSION
In published literature, MV in children with CP was mea- sured using MRI34-36 and 3-D US.3,12,21,37 Using these tech- niques MV can be reliably and validly measured in children with CP. On the other hand, 2D US allows for excellent dif- ferentiation between the connective tissue, fat, and muscle tissue, and is also easier to perform and less time-consuming for analysis. Therefore, 2D US is commonly used as a means of assessing muscle size. Previous studies showed that MT measurements obtained using 2D US are useful for estimat- ing MV in different muscle groups.24,26,27 To our knowledge, two studies have tried to estimate MV of ankle plantar flex- or from a single 2D US image.24,27 One study investigated the suitability of MT measurement by US for estimation of cm (range; 0.46--1.17 cm) for lateral head. The aCSA of
GCM muscles was 3.05±1.03 cm2 (range; 1.35--4.72 cm2) for medial head and 1.92±0.73 cm2 (range; 0.76--2.98 cm2) for lateral head (Table 1).
Univariate analysis
Tibial length, MT and aCSA from US imaging, were highly related to MV determined by MRI for both the medial heads (r=0.793, 0.659, 0.810, respectively, p<0.05) and lat- eral heads (r=0.769, 0.621, 0.824, respectively, p<0.05) of GCM muscles.
Simple regression analysis
In simple regression analyses, [π×(MT/2)2×TL] and (CSA×
TL) were significantly correlated with the measured MV for both the medial and lateral heads. Simple regression equations using MT as an independent variable, based on the relationship between MT and measured MV, resulted in values of r2=0.653 (p<0.05) for medial heads and r2=0.591 (p<0.05) for lateral heads. The SEE values in the equations were 5.6 cm2 (28.6%) for medial heads and 4.0 cm2 (33.8%) for lateral heads. The MV prediction equation using aCSA as independent variable resulted in r2=0.862 (p<0.05) for medial heads and r2=0.832 (p<0.05) for lateral heads. The
Table 1. Characteristics of Patients
Mean±SD (range)
Sex (M:F) 6:3
Age (months) 49.7±17.1 (24--74)
Weight (kg) 15.7±4.9 (10.9--28.0)
Tibial length (cm) 19.9±2.7 (17.1--25.0) GCM muscle volume (cm3)
Medial 19.70±9.29 (7.18--38.95)
Lateral 11.92±9.12 (4.14--28.05)
Muscle thickness (cm)
Medial 0.99±0.27 (0.48--1.31)
Lateral 0.82±0.20 (0.46--1.17)
Anatomical cross-sectional area (cm2)
Medial 3.05±1.03 (1.35--4.72)
Lateral 1.92±0.73 (0.76--2.98)
GCM, gastrocnemius.
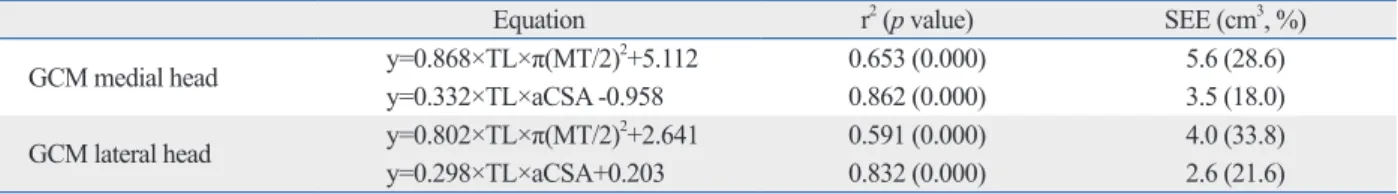
Table 2. Simple Regression Equations for Predicting Muscle Volume in Children with Cerebral Palsy
Equation r2 (p value) SEE (cm3, %)
GCM medial head y=0.868×TL×π(MT/2)2+5.112 0.653 (0.000) 5.6 (28.6)
y=0.332×TL×aCSA -0.958 0.862 (0.000) 3.5 (18.0)
GCM lateral head y=0.802×TL×π(MT/2)2+2.641 0.591 (0.000) 4.0 (33.8)
y=0.298×TL×aCSA+0.203 0.832 (0.000) 2.6 (21.6)
TL, tibial length; MT, muscle thickness; aCSA, anatomical cross-sectional area; SEE, standard error of the estimate; GCM, gastrocnemius.
Fig. 2. Relationship between estimated (based on ultrasound and arthropometry) and measured (MRI) muscle volume for gas- trocnemius muscle, using simple and multiple regression analyses. (A) y1=0.868×TL×π(MT/2)2+5.112, r2=0.653 (p=0.000), SEE=
5.645 cm3 (28.6%). (B) y1=0.332×TL×CSA-0.958, r2=0.862 (p=0.000), SEE=3.559 cm3 (18.0%). (C) y2=0.802×TL×π(MT/2)2+2.641, r2=0.591 (0.000), SEE=4.1 cm3 (33.8%). (D) y2=0.298×TL×CSA+0.203, r2=0.832 (p=0.000), SEE=2.6 (21.6%). (E) Y1= 2.271×TL+15.982×MT-41.493, r2=0.831 (0.001), SEE=4.1 (20.6%). (F) Y1=1.896×TL+5.192×CSA-34.050, r2=0.903 (0.000), SEE=3.1 (15.5%). (G) Y2= 1.479×TL+13.347×MT-28.676, r2=0.779 (0.003), SEE=3.1 (25.6%). (H) Y2=1.101×TL+4.903×CSA-19.516, r2=0.858 (0.001), SEE=2.4 (20.5%). TL, tibial length; MT, muscle thickness; CSA, cross-sectional area; SEE, standard error of the estimate.
Measured MV
Measured MV Measured MV
Measured MV
Measured MV
Measured MV Measured MV
Measured MV 0
0 0
0
0
0 0
0 10
10 10
10
10
10 10
10 20
20
20
20
20 20
20 40
40 30
30
40
40 30
30 30
30 20
30
30
Estimated MVEstimated MVEstimated MVEstimated MV Estimated MVEstimated MVEstimated MVEstimated MV
0
0 0
0
0
0 0
0 10
10 10
10
10
10 10
10 20
20 20
20
20
20 20
20 30
30
30
30 40
40 30
30
40
40 30
30 Simple regression analysis-GCM medial head Simple regression analysis-GCM medial head
Multiple regression analysis-GCM medial head Multiple regression analysis-GCM medial head Simple regression analysis-GCM lateral head Simple regression analysis-GCM lateral head
Multiple regression analysis-GCM lateral head Multiple regression analysis-GCM lateral head
A
E C
G
B
F D
H
panoramic scanning technique because the aCSA of each head of the GCM muscles can be shown in whole in young children. In multiple regression equations using measured aCSA and TL, the r2 values were 0.903 for medial heads and 0.858 for lateral heads. These high values of r2 suggest the usefulness of aCSA measurement for predicting MV.
According to a previous study, estimations of MV from the aCSA of the tibialis anterior measured by 11 axial US scans were highly reliable and valid when compared with MV measured by MRI.25 In addition, the study of Morse, et al.43 demonstrated that aCSA from a single MRI scan was highly correlated with the MV of quadriceps measured by 11 con- tinuous transverse plane MRI scans along the entire length of the femur. These findings suggest that aCSA may be useful for estimating MV. Compared with MRI and the multiple axial US scans used in previous studies, aCSA measure- ments from a single US image are easier to perform and ac- cess, and also require much less time for analysis. In this context, the clinical implication of the MV prediction equa- tion obtained in our study is noteworthy. As far as we are aware, this is the first study to show the suitability of aCSA measurements using 2D US for estimating MV in children with CP.
Nevertheless, the relatively high SEE values, ranging from 18.0--33.6% in simple regression and 15.5--25.6% in multi- ple regression, suggest a limitation in the MV prediction equation for use in individual assessment in longitudinal studies. To reduce the SEE values, increasing the number of levels of measurement and standardisation of US imaging with respect to the ankle joint position, the severity of spas- ticity and ankle joint limitations in motion should be taken into consideration. Further studies are needed to find the most efficient and accurate way to estimate MV for individ- ual assessment in longitudinal studies.
In conclusion, MV prediction equations using MT and MV of ankle plantar flexor against MV measured by water
displacement of dissected muscles in cadaveric human legs, and the regression between estimated MV and measured MV was r2=0.373 by a simple regression equation and r2=0.497 by a multiple regression equation. However, the results ob- tained in cadavers may differ from data obtained from liv- ing humans because of cell shrinkage resulting from freez- ing of human tissue, which might account for the discrepancy in their data. On the other hand, Miyatani, et al.27 investigat- ed the accuracy of estimating ankle plantar flexor MV in healthy adults using MT measurement from a single US image, and demonstrated that the regression between MV estimated by a MV prediction equation and that measured by MRI was r2=0.649 by a simple regression equation and r2=0.820 by a multiple regression equation.27 They conclud- ed that MT on US images is useful for estimating ankle plantar flexor MV. The results of our study are in accor- dance with those of Miyatani, et al.,27 and confirmed that MT on 2D US is a useful parameter when combined with TL for estimating GCM MV in children with spastic CP.
The functional importance of changes in the aCSA of a muscle can be seen in its contribution to total force produc- tion,38 and aCSA is therefore often analysed in studies of strength training, in which it shows a strong relationship with the maximum capacity of muscle force production.4,39,40 In the literature, aCSA measured using 2D B-mode US scan- ning shows a high correlation with other imaging techniques such as MRI or CT.16,25,41 Therefore, US has been common- ly used to measure human skeletal muscle aCSA in vivo in different subjects and different muscles.25,40,42 For children and adolescents with CP, aCSA measurement using 2D US had excellent reliability.21 Using this technique, aCSA of large muscles can be reliably and validly measured using 2D US.17 We measured aCSA of each head of GCM muscles from routine single transverse plane US images without use of the
Table 3. Multiple Regression Model for Predicting Muscle Volume in Children with Cerebral Palsy Muscle group Variable r2 (p value) SEE (cm3, %) Regression
coefficient Standard regression
coefficient Contribution %
GCM medial head
TL 0.831 (0.001) 4.1 (20.6) 2.271 0.658 62.9
MT 15.982 0.468 20.1
TL 0.903 (0.000) 3.1 (15.5) 1.896 0.549 24.8
aCSA 5.192 0.578 65.6
GCM lateral head
TL 0.779 (0.003) 3.1 (25.6) 1.479 0.651 59.1
MT 13.347 0.449 18.8
TL 0.858 (0.001) 2.4 (20.5) 1.101 0.484 18.0
aCSA 4.903 0.590 67.8
TL, tibial length; MT, muscle thickness; aCSA, anatomical cross-sectional area; SEE, standard error of the estimate; GCM, gastrocnemius.
muscle thickness as quantitative muscle evaluation for adults with severe cerebral palsy. Phys Ther 2006;86:1231-9.
12. McNee AE, Gough M, Morrissey MC, Shortland AP. Increases in muscle volume after plantarflexor strength training in children with spastic cerebral palsy. Dev Med Child Neurol 2009;51:429- 35.
13. Tok F, Ozçakar L, Safaz I, Alaca R. Effects of botulinum toxin-A on the muscle architecture of stroke patients: the first ultrasono- graphic study. J Rehabil Med 2011;43:1016-9.
14. Heymsfield SB, McManus C, Smith J, Stevens V, Nixon DW. An- thropometric measurement of muscle mass: revised equations for calculating bone-free arm muscle area. Am J Clin Nutr 1982;36:
680-90.
15. Rice CL, Cunningham DA, Paterson DH, Lefcoe MS. A compari- son of anthropometry with computed tomography in limbs of young and aged men. J Gerontol 1990;45:M175-9.
16. Reeves ND, Narici MV, Maganaris CN. Effect of resistance train- ing on skeletal muscle-specific force in elderly humans. J Appl Physiol (1985) 2004;96:885-92.
17. Ahtiainen JP, Hoffren M, Hulmi JJ, Pietikäinen M, Mero AA, Avela J, et al. Panoramic ultrasonography is a valid method to measure changes in skeletal muscle cross-sectional area. Eur J Appl Physiol 2010;108:273-9.
18. Linney AD, Deng J. Three-dimensional morphometry in ultra- sound. Proc Inst Mech Eng H 1999;213:235-45.
19. Fenster A, Downey DB. Three-dimensional ultrasound imaging.
Annu Rev Biomed Eng 2000;2:457-75.
20. Barber L, Barrett R, Lichtwark G. Validation of a freehand 3D ul- trasound system for morphological measures of the medial gas- trocnemius muscle. J Biomech 2009;42:1313-9.
21. Moreau NG, Teefey SA, Damiano DL. In vivo muscle architec- ture and size of the rectus femoris and vastus lateralis in children and adolescents with cerebral palsy. Dev Med Child Neurol 2009;
51:800-6.
22. Mohagheghi AA, Khan T, Meadows TH, Giannikas K, Baltzo- poulos V, Maganaris CN. In vivo gastrocnemius muscle fascicle length in children with and without diplegic cerebral palsy. Dev Med Child Neurol 2008;50:44-50.
23. Infantolino BW, Gales DJ, Winter SL, Challis JH. The validity of ultrasound estimation of muscle volumes. J Appl Biomech 2007;
23:213-7.
24. Bandholm T, Sonne-Holm S, Thomsen C, Bencke J, Pedersen SA, Jensen BR. Calf muscle volume estimates: implications for botuli- num toxin treatment? Pediatr Neurol 2007;37:263-9.
25. Esformes JI, Narici MV, Maganaris CN. Measurement of human muscle volume using ultrasonography. Eur J Appl Physiol 2002;
87:90-2.
26. Miyatani M, Kanehisa H, Kuno S, Nishijima T, Fukunaga T. Va- lidity of ultrasonograph muscle thickness measurements for esti- mating muscle volume of knee extensors in humans. Eur J Appl Physiol 2002;86:203-8.
27. Miyatani M, Kanehisa H, Ito M, Kawakami Y, Fukunaga T. The accuracy of volume estimates using ultrasound muscle thickness measurements in different muscle groups. Eur J Appl Physiol 2004;91:264-72.
28. Miyatani M, Kanehisa H, Fukunaga T. Validity of bioelectrical impedance and ultrasonographic methods for estimating the mus- cle volume of the upper arm. Eur J Appl Physiol 2000;82:391-6.
29. Choi WH, Song CW, Kim YB, Ha CS, Yang GH, Woo HD, et al.
Skeletal muscle atrophy induced by intramuscular repeated dose
aCSA of GCM muscles measured by 2D US combined with TL were obtained based on MV of GCM measured by MRI in children with spastic CP. The high values of r2 in each multiple regression MV prediction equation obtained in our study indicate that MV estimates using MT or aCSA mea- surement using 2D US are suitable when combined with tibial length. In addition, aCSA is more useful than MT for estimating the MV of GCM. The final MV prediction equa- tions obtained in our study may provide a quick and easy way to estimate the volume of GCM muscles in these chil- dren, which may ultimately be useful for population studies or field surveys. However, at present the SEE values ob- served in our study indicate that it might be better to limit use of these prediction equations to individual assessment in longitudinal studies. Further attempts to improve the ac- curacy of MV estimation using 2D US are needed.
REFERENCES
1. Bax M, Goldstein M, Rosenbaum P, Leviton A, Paneth N, Dan B, et al. Proposed definition and classification of cerebral palsy, April 2005. Dev Med Child Neurol 2005;47:571-6.
2. Barrett RS, Lichtwark GA. Gross muscle morphology and struc- ture in spastic cerebral palsy: a systematic review. Dev Med Child Neurol 2010;52:794-804.
3. Barber L, Hastings-Ison T, Baker R, Barrett R, Lichtwark G. Me- dial gastrocnemius muscle volume and fascicle length in children aged 2 to 5 years with cerebral palsy. Dev Med Child Neurol 2011;53:543-8.
4. Fukunaga T, Miyatani M, Tachi M, Kouzaki M, Kawakami Y, Kanehisa H. Muscle volume is a major determinant of joint torque in humans. Acta Physiol Scand 2001;172:249-55.
5. Fukunaga T, Ito M, Ichinose Y, Kuno S, Kawakami Y, Fukashiro S. Tendinous movement of a human muscle during voluntary con- tractions determined by real-time ultrasonography. J Appl Physiol (1985) 1996;81:1430-3.
6. Blazevich AJ, Coleman DR, Horne S, Cannavan D. Anatomical predictors of maximum isometric and concentric knee extensor moment. Eur J Appl Physiol 2009;105:869-78.
7. Gadeberg P, Andersen H, Jakobsen J. Volume of ankle dorsiflex- ors and plantar flexors determined with stereological techniques. J Appl Physiol (1985) 1999;86:1670-5.
8. Akagi R, Takai Y, Ohta M, Kanehisa H, Kawakami Y, Fukunaga T.
Muscle volume compared to cross-sectional area is more appro- priate for evaluating muscle strength in young and elderly individ- uals. Age Ageing 2009;38:564-9.
9. Pitcher CA, Elliott CM, Williams SA, Licari MK, Kuenzel A, Shipman PJ, et al. Childhood muscle morphology and strength:
alterations over six months of growth. Muscle Nerve 2012;46:
360-6.
10. McBurney H, Taylor NF, Dodd KJ, Graham HK. A qualitative analysis of the benefits of strength training for young people with cerebral palsy. Dev Med Child Neurol 2003;45:658-63.
11. Ohata K, Tsuboyama T, Ichihashi N, Minami S. Measurement of
ing walking in spastic hemiplegic cerebral palsy? Clin Orthop Relat Res 2012;470:1278-85.
37. Fry NR, Gough M, McNee AE, Shortland AP. Changes in the vol- ume and length of the medial gastrocnemius after surgical reces- sion in children with spastic diplegic cerebral palsy. J Pediatr Or- thop 2007;27:769-74.
38. Morse CI, Thom JM, Reeves ND, Birch KM, Narici MV. In vivo physiological cross-sectional area and specific force are reduced in the gastrocnemius of elderly men. J Appl Physiol (1985) 2005;
99:1050-5.
39. Masuda K, Kikuhara N, Takahashi H, Yamanaka K. The relation- ship between muscle cross-sectional area and strength in various isokinetic movements among soccer players. J Sports Sci 2003;
21:851-8.
40. Bemben MG. Use of diagnostic ultrasound for assessing muscle size. J Strength Cond Res 2002;16:103-8.
41. Noorkoiv M, Nosaka K, Blazevich AJ. Assessment of quadriceps muscle cross-sectional area by ultrasound extended-field-of-view imaging. Eur J Appl Physiol 2010;109:631-9.
42. Howe TE, Oldham JA. The reliability of measuring quadriceps cross-sectional area with compound B ultrasound scanning. Phys- iother Res Int 1996;1:112-26.
43. Morse CI, Degens H, Jones DA. The validity of estimating quad- riceps volume from single MRI cross-sections in young men. Eur J Appl Physiol 2007;100:267-74.
of botulinum toxin type A in rats. Drug Chem Toxicol 2007;30:
217-27.
30. Cosgrove AP, Corry IS, Graham HK. Botulinum toxin in the man- agement of the lower limb in cerebral palsy. Dev Med Child Neu- rol 1994;36:386-96.
31. Williams SA, Reid S, Elliott C, Shipman P, Valentine J. Muscle volume alterations in spastic muscles immediately following botu- linum toxin type-A treatment in children with cerebral palsy. Dev Med Child Neurol 2013;55:813-20.
32. Bénard MR, Becher JG, Harlaar J, Huijing PA, Jaspers RT. Ana- tomical information is needed in ultrasound imaging of muscle to avoid potentially substantial errors in measurement of muscle ge- ometry. Muscle Nerve 2009;39:652-65.
33. e Lima KM, da Matta TT, de Oliveira LF. Reliability of the rectus femoris muscle cross-sectional area measurements by ultrasonog- raphy. Clin Physiol Funct Imaging 2012;32:221-6.
34. Lampe R, Grassl S, Mitternacht J, Gerdesmeyer L, Gradinger R.
MRT-measurements of muscle volumes of the lower extremities of youths with spastic hemiplegia caused by cerebral palsy. Brain Dev 2006;28:500-6.
35. Williams SA, Elliott C, Valentine J, Gubbay A, Shipman P, Reid S.
Combining strength training and botulinum neurotoxin interven- tion in children with cerebral palsy: the impact on muscle mor- phology and strength. Disabil Rehabil 2013;35:596-605.
36. Riad J, Modlesky CM, Gutierrez-Farewik EM, Broström E. Are muscle volume differences related to concentric muscle work dur-